

Abstract
Cooking oil fumes contain polycyclic aromatic hydrocarbons (PAHs), heterocyclic aromatic amines, benzene, and formaldehyde which may cause oxidative damages to DNA and lipids. We assessed the relations between exposure to cooking oil fumes (COF) and subsequent oxidative DNA damage and lipid peroxidation among military cooks and office-based soldiers. The study population, including 61 Taiwanese male military cooks and a reference group of 37 office soldiers, collected urine samples pre-shift of the first weekday and post-shift of the fifth workday. We measured airborne particulate PAHs in military kitchens and offices and concentrations of urinary 1-OHP, a biomarker of PAH exposure, urinary 8-hydroxydeoxyguanosine (8-OHdG), a biomarkers of oxidative DNA damage, and urinary isoprostane (Isop). Airborne particulate PAHs levels in kitchens significantly exceeded those in office areas. The concentrations of urinary 1-OHP among military cooks increased significantly after 5 days of exposure to COF. Using generalized estimating equation (GEE) analysis adjusting for confounding, a change in log(8-OHdG) and log(Isop) were statistically significantly related to a unit change in log(1-OHP) (regression coefficient [β], β= 0.06, 95% CI 0.001 to 0.12) and (β= 0.07, 95% CI 0.001 to 0.13), respectively. Exposure to PAHs, or other compounds in cooking-oil fumes, may cause both oxidative DNA damage and lipid peroxidation.
Keywords: military cooks, polycyclic aromatic hydrocarbons (PAHs), 1-hydroxypyrene (1-OHP), 8-hydroxydeoxyguanosine (8-OHdG), isoprostane
Introduction
Stir-frying and deep-frying in cooking oil, central features of Chinese cooking, produce high concentrations of oil fumes. Cooking oil fumes (COFs) constitute a complex mixture, and this mixture varies according to the type of cooking practice (e.g., boiling, broiling and frying) and the type of cooking oils (e.g., rape-seed oil, lard, and soybean oil), as well as according to the use of fume extractors. Cooking habits and the use of fume extractors are biologically plausible determinants of lung cancer risk because they influence the exposure concentrations of established mutagens and carcinogens emitted from oil fumes, including polycyclic aromatic hydrocarbons (PAHs), heterocyclic aromatic amines, benzene, and formaldehyde.(1, 2) Among them, PAHs are well-documented for their mutagenic and carcinogenic potential. Pyrene is commonly found in mixtures of PAHs, and it has metabolites such as 1-hydroxypyrene (1-OHP) and 1-hydroxypyrene-glucuronide (1-OHPG-gluc), which can be measured in human urine. These metabolites have previously been used as biomarkers of recent exposure to cooking oil fume in restaurant workers. (3)
Previous studies have demonstrated increased oxidative stress in subjects exposed to environmental air pollution (4, 5) through the assessment of oxidative damage to DNA, lipids, or proteins. Attacks on DNA by reactive oxygen species frequently result in oxidative DNA damage. Urinary 8-hydroxydeoxyguanosine (8-OHdG) is a biomarker of oxidative DNA stress reflecting its repair from DNA. Biomonitoring in humans has demonstrated that 8-OHdG may be correlated with oxidative stress and damage to DNA.(6) Reactive oxygen species (ROS) may be also responsible for oxidative changes in lipids.(7) Free radicals may induce peroxidation of arachidonic acid generating F2-isoprostanes.(8) Urinary or plasma F2-isoprostanes are thought to be useful markers of lipid peroxidation.
In general, military cooks are younger and healthier, have a shorter work history, serve more people and have longer working hours in cooking compared with ordinary professional cooks. There is limited evidence regarding the application of this biomarker in individuals with high exposure to PAHs, such as military cooks, who are considered to be exposed to high levels of cooking oil fumes. Sampling at the beginning and end of the working week is justified when the half life of biomarker of exposure is longer than 5 h because of possible accumulation, which is the case with urinary 1-OHP as a biomarker of exposure to cooking oil fumes. Previous studies applied a cross-sectional design and collected post-shift urine samples only.(3, 9, 10) In the present study, we assessed longitudinally the relations between exposure to oil fumes and subsequent oxidative DNA and lipid peroxidation damages among military cooks and office-based soldiers. In addition, we examined military cooks to evaluate whether urinary 1-OHP could be used as a biomarker of exposure to oil fumes in a longitudinal study design.
Methods
Study Population
We conducted a longitudinal study among 61 male military cooks who were exposed to COFs at work and a reference group of 37 male administrative personnel. Study subjects were recruited from 3 military bases in the northern, central and southern areas of Taiwan. All the military bases are located in the rural area where there are no industrial emissions within 10 kilometers. In order to achieve comparability of the two groups, we selected a similar number of cooks and office workers from the northern, central, and southern areas. Both the exposed and the reference groups constituted of healthy soldiers that lived and ate together in the corresponding areas of military camp. We distributed a questionnaire to the subjects, inquiring details of personal characteristics such as age, education, smoking habits, medical history, consumption of broiled, grilled and barbecued food, and use of personal protective equipment. Workers were asked to collect urine samples from a pre-shift of the first weekday (Monday) and a post-shift of the fifth workday (Friday). This study was approved by the institutional review board of the Tri-Service General Hospital in Taipei, Taiwan. All participants signed informed consent forms prior to study enrolment.
Determinants and Outcome of Interest
The determinant of interest (i.e., exposure biomarker) was the urinary concentration of 1-OHP following completion of the work shift. The outcome of interest (i.e., outcome biomarker) was the urinary concentration of 8-OHdG following completion of the work shift.
Data Collection
Questionnaire
At the beginning of the study, we distributed a questionnaire to the participants. Details on cooking conditions and habits were collected. Each questionnaire contained inquiries about personal characteristics (e.g., age; education; smoking habits; medical history; cooking history; use of cooking fuel(s); cooking oil(s); cooking practice(s); and ventilation conditions (a dichotomous variable); and the use of a fume extractor in the kitchen. A daily diary contained entries on the number of cigarettes smoked; second-hand smoke exposure; consumption of broiled, grilled, or barbecued foods; use of incense, candles, or mosquito coils; and use of personal protective equipment. Because stir frying, frying, and deep frying are the three cooking techniques that are typically used to prepare Chinese food, we also measured how frequently cooks used each technique. We also asked about their regular cooking habits, including whether they waited for fumes to be emitted from cooking oils before they began to cook. According to the concepts of traditional Chinese cooking, quick frying in oils that have been heated to reach high temperatures keeps food as fresh as possible.
Urine Samples
We collected pre-shift urine samples on the first day of the work week from both the exposure and reference groups. Immediately following the last shift of each work week, each soldier provided a urine sample in a brown polyethylene 50-ml container labelled with the subject’s identification number and date and time of collection. Standard laboratory practice was followed to ensure contamination-free collection of the urine specimens. The samples were stored in a cooler with dry ice and transported to the School of Public Health, National Defence Medical Centre, where they were maintained at −80°C until analysis. Urine samples were centrifuged after thawing.
Particulate PAHs
Area particulate PAH samplings were conducted on 7 kitchens and 3 offices during the sampling period of 5 consecutive days. A total of 50 PAH samples were obtained, including 35 kitchen samples and 15 office samples. Air samplers [Personal Environmental Monitors (PEM), SKC761-203, SKC Inc., Eighty Four, PA, USA] with a size cut of 2.5μm were used to collect PM2.5 (PM with aerodynamic diameters less than or equal to 2.5μm) at 4 l/min on Teflon filters (37mm, Pall corporation, Ann Arbor, Michigan, USA) for approximately 9 hours.
Analysis of Air Samples
After sampling, filters were added with surrogate standards and preserved in brown glassware in −4°C. These filters were extracted by three-time 15-min sonication with a 10ml of hexane:methylene chloride mixture (volume ratio 1:4). Extracts were concentrated down to about 0.5 ml under a gentle stream of nitrogen, cleaned up with silica gel, and concentrated again to about 200 μl to be analyzed.
PAH analysis was performed on an API 3000 atmospheric pressure photoionization-tandem mass spectrometry (APPI-MS/MS) from Applied Biosystems/MDS SCIEX (Toronto, Canada), connected to a Waters 2695 high performance liquid chromatography system (HPLC, Waters, Milford, MA). In order to compare with previous studies associated with exposure to cooking oil fume, the concentrations of the 5 PAH species in the filter were determined, including pyrene (Pyr), benzo(a)anthracene (BaA), benzo(k)fluoranthene (BkF), benzo(a)pyrene (BaP), and benzo(ghi)perylene (BghiP). The total PAH content was defined as the sum of the contents of the 5 PAH compounds. This study yielded recovery efficiencies (corrected by the two internal standards of CHR-d12, and PER-d12) of the 21 PAH compounds from 0.74 to 0.964 (average= 0.894). The limits of detection (LODs) of the 21 PAH compounds were determined based on the analysis of serial dilutions of PAH standards. Their values were in the range of 14–114 pg. The limit of quantification (LOQ) of a given PAH compound was defined as its LOD divided by the sampling air volume. The range of LOQs for the 21 PAH compounds was 6.5–52.8 pg/m3. Analyses of field blanks (Teflon filters) found no significant contamination (i.e., GC/MS integrated area<detection limit).
Analysis of Urinary 1-OHP
All urine samples were analyzed to determine their 1-OHP concentration by the HPLC method first developed by Jongeneelen and his colleagues and adopted in our previous study.(11, 12) The detection limit of the method was 5.43 ng, according to the data obtained from seven repeated analyses at a concentration 15.0 ng/dL. The reproducibility of the method, determined by repeated analysis of urine samples at concentrations from 2.85 to 9.99 μg/dL, was found with variation coefficients ranging from 1.87 to 8.40%.
Analysis of 8-OHdG
Levels of urinary 8-OHdG were determined using the indirect competitive enzyme-linked immunosorbent assay (ELISA) (New 8-OHdG Check; Institute for the Control of Aging, Fukuroi, Shizuoka, Japan) according to Maeshima et al. and Lai et al. (13–15) The coefficient of variation of the assay was within 6% during the period of sample analysis. The results were expressed as ng/ml.
Analysis of Urinary Isoprostane
The quantification of 15-F2t-isoprostane in urine, the product of free radical-mediated peroxidation of lipoproteins, was determined by a competitive enzyme-linked immunoassay (ELISA) using Urinary isoprostane kit (Oxford Biomedical Research, Oxford, Ohio, USA) in accordance with the manufacturer’s recommendations. The lower limit of reliable detection was suggested as 0.2 ng/ml. The lowest value of 15-F2t-isoprostane detected by ELISA in our study was 1.3 ng/ml. The coefficient of variation of the assay was 5–10% during the period of sample analysis.
Analysis of Urinary Cotinine and Creatinine
Cotinine levels were measured with ELISA kits from Calbiotech Inc., Spring Valley, CA, USA. The coefficient of variation of the assay was within 7% during the period of sample analysis. The urinary creatinine was analyzed using a creatinine kit from Sigma (St. Louis, MD). The coefficient of variation of the assay was within 5% during the period of sample analysis.
Statistical Methods
Initially, we adopted the Spearman correlation analysis to evaluate the correlation between pyrene levels and levels of other PAHs in kitchens and office areas. Wilcoxon rank-sum tests were used to compare differences in work place PAH levels between kitchens and offices. We compared the distribution of 1-OHP and 8-OHdG concentrations between the exposed and reference groups. We compared concentrations and applied both parametric (unpaired t-test) and nonparametric (Wilcoxon rank-sum test) statistical tests between the exposed and reference groups. We then compared the concentrations of 8OHdG and isoprostane between the post-shift and pre-shift samples by using the paired t-test for the exposed and reference groups. Post-shift and pre-shift differences of 8-OHdG and isoprostane levels were placed on the y-axis, and post-shift and pre-shift differences of 1-OHP were placed on the x-axis in plots. We assessed the determinants of 8-OHdG and isoprostane levels using the method of generalized estimating equations (GEE), which accounted for correlated successive measurements in the same individuals. Since the creatinine-corrected urinary level was the dependent variable in the multivariate analyses, independent variables may have been unrelated to the chemical concentration itself, but related to the urinary creatinine concentration.(16) In the linear regression and GEE analyses, we used the creatinine-unadjusted urinary chemical level as the dependent variable to determine significant predictors of exposure to that chemical. All the analyses were performed with the STATA 11 statistical package.
Results
Particulate Polycyclic Aromatic Hydrocarbon (PAH) Levels between Military Kitchens and Offices
Table 1 lists the particulate PAH levels in the kitchens and offices of area monitoring. The median levels of pyrene, benzo(a)anthracene, and benzo(ghi)perylene in the kitchens were significantly higher than those in the offices. The median levels of total PAHs in the kitchens were also significantly higher than those in the offices. Pyrene levels were significantly correlated with BaA, BkF, Bap, Bghi levels and total PAHs in both kitchens and offices (data not shown).
Table 1.
Comparisons of PAHs levels (ng/m3) in military kitchen and offices.
| Kitchens (n=35) | Offices (n=13) | ||||||
|---|---|---|---|---|---|---|---|
|
| |||||||
| Compound | Median | Geometric mean | GSD | Median | Geometric mean | GSD | P |
| Pyrene* | 1.05 | 2.26 | 11.38 | 0.31 | 0.39 | 6.38 | 0.006 |
| BaA | 0.39 | 0.65 | 8.06 | 0.12 | 0.15 | 1.51 | 0.033 |
| BkF | 0.84 | 1.51 | 5.77 | 0.39 | 0.66 | 5.04 | 0.103 |
| BaP | 1.74 | 3.35 | 7.38 | 0.74 | 1.23 | 6.65 | 0.095 |
| BghiP | 4.88 | 9.55 | 10.62 | 0.81 | 1.69 | 9.18 | 0.004 |
| Summed 5 PAH | 7.87 | 20.37 | 9.35 | 2.21 | 4.23 | 7.93 | 0.006 |
Pyrene (Pyr), benzo(a)anthracene (BaA), benzo(k)fluoranthene (BkF), benzo(a)pyrene (BaP), and benzo(ghi)perylene (BghiP)
Study Population
The characteristics of the study population were compared between the exposed and reference groups (Table 2). The mean age of the exposed and reference group was 21.4 yrs [standard deviation (SD) = 1.8 yrs] and 23.1 yrs (SD) = 2.4 yrs, respectively. The exposed subjects were less educated, measured as the percentage of college educated, than the reference group (21.3 vs. 70.3%, respectively). There were more current smokers among the exposed subjects (60.7%) than among the reference individuals (36.0%).
Table 2.
Characteristics of the study population.
| Characteristic | Exposed N(%) |
Reference N(%) |
Total N(%) |
p value |
|---|---|---|---|---|
| Gender | ||||
| Male | 61(100) | 37(100) | 98(100) | |
| Age*† | 21.4±1.8 | 23.1±2.4 | 22.0±2.2 | <0.001 |
| BMI(kg/m2)*† | 22.3±3.1 | 22.8±2.3 | 22.5±2.8 | 0.39 |
| Education‡ | ||||
| High school | 48(78.7) | 11(29.7) | 59(60.2) | <0.001 |
| College | 13(21.3) | 26(70.3) | 39(39.8) | |
| Geographic location‡ | ||||
| Northern | 21(34.4) | 10(27.0) | 31(31.6) | 0.70 |
| Central | 25(41.0) | 18(48.7) | 43(43.9) | |
| Southern | 15(24.6) | 9(24.3) | 24(24.5) | |
| Current smoking habits‡ | ||||
| Smokers | 37(60.7) | 13(36.0) | 50(51.0) | 0.001 |
| Non-smokers | 24(39.3) | 24(64.0) | 48(48.9) |
Mean±SD
Unpaired t-test
χ2 test
The mean pre-shift number of cigarettes smoked per day in the exposed and reference groups were 17 and 11, respectively. The mean post-shift number of cigarettes smoked per day in exposed and reference groups were 15 and 6, respectively.
On average, military cooks spent 6 months cooking (data not shown). Most military cooks were chefs. Only 21% were executive and assistant cooks. The daily average time spent cooking was 6.3 hours. Lunch and dinner took much more time than breakfast. They worked an average of 5.2 days for an average of 11 working hours. Stir frying was the most frequent method military cooks used. Bottle propane gas and underground line propane gas were regular cooking fuels.
Comparison of the Mean of Intraindividual Differences between Post-shift and Pre-shift Urinary 1-OHP and 8-OHdG Concentrations among the Exposed and Reference Groups
Following 5 days exposure, only exposed subjects demonstrated a statistically significant increase in urinary 1-OHP compared to pre-shift. We stratified the military cooks as chefs and assistant cooks, and results showed greater increasing magnitude of 1-OHP in chefs than that in assistant cooks after 5 days exposure (data not shown). A significant decrease was found between pre-shift and post-shift in reference group (p<0.05).
The levels of urinary 8-OHdG and urinary isoprostane were higher at pre-shift compared to that of post-shift in both exposed and reference groups in general. As shown in Table 3, the means of post and pre-shift differences in 1-OHP of exposed and reference groups were 0.25 (95% CI −0.17 to 0.66) and −0.28 (95% CI −0.50 to −0.06), respectively. The difference between the group means was 0.53 (95% CI 0.11 to 0.94). The mean of intraindividual post-shift and pre-shift differences in 8-OHdG of exposed and reference groups was −6.23 ng/ml (95% CI −8.73 to −3.74) and −7.82 ng/ml (95% CI −10.72 to −4.92), respectively. The difference between the group means was 1.74 ng/ml (95% −1.56 to 5.03). Regarding to the mean of intraindividual post-shift and pre-shift differences in isoprostane of exposed and reference groups was −0.83 ng/ml (95% CI −1.27 to −0.40) and −0.66 ng/ml (95% CI −1.14 to −0.18), respectively.
Table 3.
Comparison of mean pre and post-shift concentrations of 8-OHdG and Isoprostane among the exposed and reference groups and comparison of the mean of intraindividual differences between the exposed and the reference groups.
| Exposed group (N=61) | Reference group (N=37) | Comparison between groups |
|||||
|---|---|---|---|---|---|---|---|
|
|
|||||||
| post-shift mean (95% CI) |
pre-shift mean (95% CI) |
Mean of intraindividual post-preshift differences (95% CI) |
post-shift mean (95% CI) |
pre-shift mean (95% CI) |
Mean of intraindividual post-preshift differences (95% CI) |
Difference between the group means (95% CI) |
|
| Exposure | |||||||
| 1-OHP ng/ml | |||||||
| Smokers | 0.95 (0.37 to 1.52) | 0.69(0.44 to 0.94) | 0.26(−0.21 to 0.73) | 0.29(0.11 to 0.46) | 0.77(0.30 to 1.23) | −0.48(−0.83 to −0.14) | 0.74(−0.04 to 1.52) |
| Non-smokers | 0.69(0.25 to 1.12) | 0.46(0.25 to 0.66) | 0.23(−0.11 to 0.57) | 0.20(0.10 to 0.31) | 0.36(0.18 to 0.53) | −0.16(−0.37 to 0.05) | 0.39(−0.01 to 0.78) |
| Total | 0.84 (0.46 to 1.23) | 0.60 (0.43 to 0.77) | 0.25 (−0.17 to 0.66) | 0.23 (0.15 to 0.32) | 0.51 (0.31 to 0.72) | −0.28 (−0.50 to −0.06) | 0.53 (0.11 to 0.94) |
| Log(1-OHP) ng/ml | |||||||
| Smokers | −0.36(−0.53 to −0.19) | −0.32(−0.44 to −0.20) | −0.04(−0.18 to 0.10) | −0.69(−0.90 to −0.49) | −0.29(−0.53 to −0.06) | −0.40(−0.62 to −0.18) | 0.36(0.10 to 0.63) |
| Non-smokers | −0.48(−0.71 to −0.25) | −0.53(−0.71 to −0.35) | 0.05(−0.20 to 0.30) | −0.92(−1.12 to −0.72) | −0.67(−0.86 to −0.47) | −0.26(−0.51 to −0.002) | 0.31(−0.04 to 0.66) |
| Total | −0.41 (−0.54 to−0.27) | −0.41 (−0.51 to −0.30) | −0.004 (−0.17 to 0.16) | −0.84 (−0.98 to−0.69) | −0.52 (−0.68 to −0.37) | −0.31 (−0.52 to −0.10) | 0.31 (0.10 to 0.52 |
| Cotinine ng/ml | |||||||
| Smokers | 6744.9(4916.8 to 8573.0) | 8897.6(6891.9 to 10903.27) | −2152.7(−4372.2 to 67.8) | 3078.6(1107.0 to 5050.1) | 6547.9(535.3 to 12560.5) | −3469.3(−9154.8 to 2216.2) | 1316.6(−3486.7 to6119.9) |
| Non-smokers | 265.5(−233.7 to 764.7) | 109.0(−72.3 to 290.4) | 156.4(−162.6 to 475.4) | 8.1(5.9 to 10.4) | 9.2(6.3 to 12.1) | −1.1(−4.0 to 1.8) | 157.5(−175.4 to 490.5) |
| Total | 4109.2(2743.5 to 5474.8) | 5322.6(3694.8 to 6950.4) | −1213.4 (−3315.8 to 889.0) | 1182.1 (315.8 to 2048.4) | 2509.3 (132.5 to 4886.1) | −1327.2 (−3809.7 to 1155.4) | 113.8 (−2202.3 to 2429.9) |
| Log(cotinine) ng/ml | |||||||
| Smokers | 3.64(3.42 to 3.81) | 3.80(3.65 to 3.95) | −0.16(−0.27 to −0.06) | 3.15(2.72 to 3.58) | 3.46(3.10 to 3.81) | −0.31(−0.70 to 0.09) | 0.14(−0.13 to 0.42) |
| Non-smokers | 1.09(0.74 to 1.42) | 1.17(0.91 to 1.44) | −0.09(−0.35 to 0.16) | 0.77(0.56 to 0.98) | 0.71(0.40 to 1.01) | 0.06(−0.30 to 0.42) | −0.16(−0.58 to 0.26) |
| Total | 2.60 (2.23 to 2.97) | 2.73 (2.37 to 3.10) | −0.13 (−0.65 to 0.38) | 1.68 (1.23 to 2.13) | 1.76 (1.24 to 2.38) | −0.08 (−0.76 to 0.60) | −0.057(−0.304 to −0.191) |
|
| |||||||
| Outcome | |||||||
| 8OHdG ng/ml | |||||||
| Smokers | 10.03(7.84 to 12.21) | 17.97(15.52 to 20.42) | −7.94(−10.87 to −5.02) | 11.00(7.72 to 14.29) | 19.44(16.17 to 22.70) | −8.44(−13.07 to −3.80) | 0.49(−4.91 to 5.90) |
| Non-smokers | 10.18(7.29 to 13.07) | 13.78(11.02 to 16.54) | −3.60(−7.20 to −0.002) | 11.54(8.21 to 14.87) | 19.23(16.86 to 21.60) | −7.69(−9.82 to −5.56) | 4.09(−0.03 to 8.20) |
| Total | 10.09 (8.39 to 11.78) | 16.32 (14.46 to 18.19) | −6.23 (−8.73 to −3.74) | 11.34 (9.02 to 13.65) | 19.15 (17.33 to 20.98) | −7.82 (−10.72 to −4.92) | 1.74 (−1.56 to 5.03) |
| log(8-OHdG) ng/ml | |||||||
| Smokers | 0.88(0.65 to 1.00) | 1.22(1.15 to 1.28) | −0.33(−0.46 to −0.21) | 0.97(0.80 to 1.13) | 1.27(1.19 to 1.35) | −0.30(−0.48 to −0.12) | −0.03(−0.13 to 0.06) |
| Non-smokers | 0.90(0.75 to 1.04) | 1.10(1.01 to 1.18) | −0.20(−0.36 to −0.04) | 0.97(0.85 to 1.10) | 1.27(1.22 to 1.32) | −0.30(−0.40 to −0.19) | 0.10(−0.09 to 0.28) |
| Total | 0.89 (0.80 to 0.98) | 1.17 (1.12 to 1.22) | −0.28 (−0.39 to−0.18) | 0.97 (0.88 to 1.07) | 1.27 (1.22 to 1.31) | −0.29 (−0.40 to −0.19) | 0.01 (−0.12 to 0.16) |
| Isoprostane ng/ml | |||||||
| Smokers | 1.78(1.33 to 2.22) | 2.72(2.02 to 3.41) | −0.94(−1.61 to −0.27) | 1.97(1.12 to 2.83) | 2.55(2.07 to 3.04) | −0.58(−1.57 to 0.41) | −0.36(−1.59 to 0.86) |
| Non-smokers | 1.53(1.10 to 1.97) | 2.21(1.78 to 2.64) | −0.68(−1.18 to −0.17) | 1.52(1.24 to 1.79) | 2.23(1.71 to 2.76) | −0.72(−1.28 to 0.15) | 0.04(−0.69 to 0.77) |
| Total | 1.68(1.37 to 1.99) | 2.51(2.07 to 2.95) | −0.83(−1.27 to −0.40) | 1.69(1.34 to 2.04) | 2.35(1.99 to 2.71) | −0.66(−1.15 to −0.18) | −0.17(−0.84 to 0.50) |
| log(Isoprostane) ng/ml | |||||||
| Smokers | 0.14(0.04 to 0.25) | 0.36(0.27 to 0.44) | −0.22(−0.34 to −0.09) | 0.21(0.05 to 0.38) | 0.39(0.30 to 0.47) | −0.17(−0.37 to 0.02) | −0.04(−0.27 to 0.19) |
| Non-smokers | 0.08(−0.05 to 0.22) | 0.30(0.21 to 0.39) | −0.22(−0.35 to −0.08) | 0.15(0.06 to 0.23) | 0.29(0.19 to 0.40) | −0.15(−0.27 to −0.03) | −0.07(−0.25 to 0.11) |
| Total | 0.12 (0.04 to 0.20) | 0.33 (0.27 to 0.39) | −0.21 (−0.30 to −0.12) | 0.17 (0.10 to 0.25) | 0.33 (0.26 to 0.40) | −0.16 (−0.26 to −0.06) | −0.06 (−0.20 to −0.08) |
Relations between Urinary 8-OHdG, Isoprostane and Urinary 1-OHP
We examined the relationship where post-shift and pre-shift difference of log(8-OHdG) and log(isoprostane) levels are shown on the y-axis and post-shift and pre-shift difference of log(1-OHP) are shown on the x-axis in figure 1 and figure 2 (Supplemental Material), respectively. There was a statistically significant relationship between post-shift and pre-shift difference of log(8-OHdG) levels and post-shift and pre-shift difference of log(1-OHP) levels (R2=0.41, p<0.001). Further there was also a statistically significant relationship between post-shift and pre-shift difference of log(isoprostane) levels and post-shift and pre-shift difference of log(1-OHP) levels (R2=0.24, p<0.001).
Figure 1.
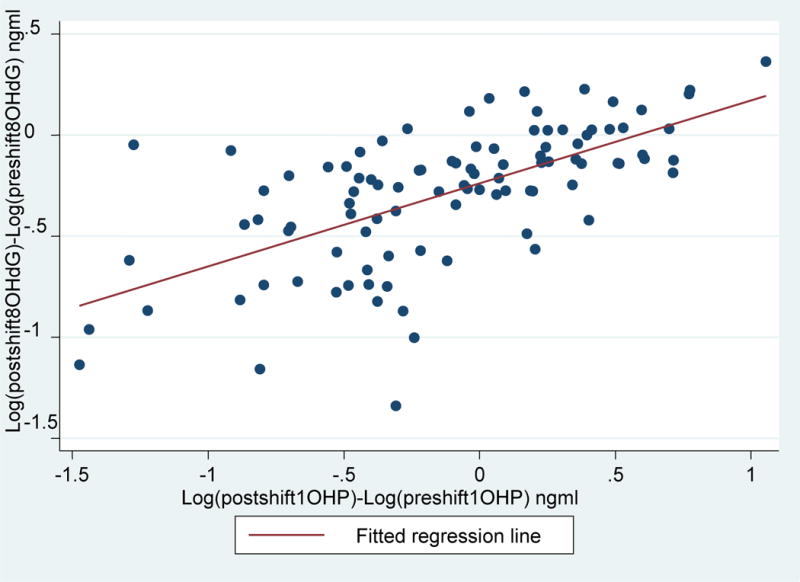
Relationship of post-shift and pre-shift differences of log[8OHdG] (ng/ml) on the y-axis and post-shift and pre-shift differences of log[1-OHP] (ng/ml) on the x-axis. Log[8OHdG]= −0.24+ Log(1-OHP)*0.41; R2=0.41, p<0.001
Figure 2.
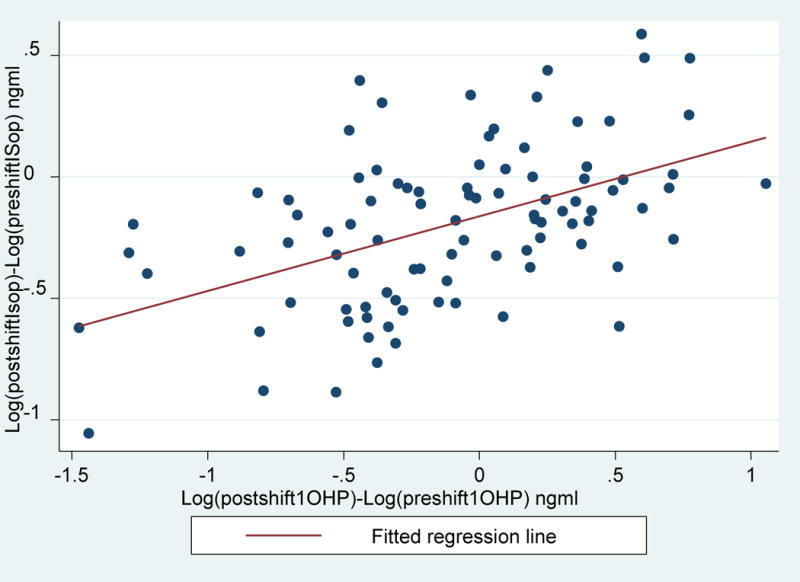
Relationship of post-shift and pre-shift differences of log[Isoprostane] (ng/ml) on the y-axis and post-shift and pre-shift differences of log[1-OHP] (ng/ml) on the x-axis. Log[Isoprostane]= −0.16+ Log(1-OHP)*0.31; R2=0.24, p<0.001
The relations between urinary 8-OHdG, isoprostane and urinary 1-OHP were examined using GEE analysis, which included adjustments for the potential confounders– age, and current smoking habit (Table 4). A significant increase in the group (exposed vs. reference) and time (post-shift vs. pre-shift) interaction effect was observed which indicated the accumulation of outcome biomarkers during the working week was on average greater in the exposed than the reference group. In the GEE analysis adjusted for confounding, a change in log(8-OHdG) and log(isoprostane) were statistically significantly related to a unit change in log(1-OHP) (β= 0.06, 95% CI 0.001 to 0.12) and (β= 0.07, 95% CI 0.001 to 0.13), respectively. Comparing post-shift with pre-shift, there was a 0.03 ng/ml increase in log8OHdG. Comparison of the exposed to the reference group revealed a 0.02 ng/ml increase in log8OHdG. Neither the group nor the time effect was statistically significant. The increase in 8-OHdG concentration was statistically significant with increasing urinary creatinine.
Table 4.
A Generalized Estimating Equation of 8-OHdG by 1-OHP with potential confounders as covariates (N=196).
| Log (1-OHP) (ng/ml) |
Log(8OHdG) (ng/ml) |
Log(Isoprostane) (ng/ml) |
|
|---|---|---|---|
|
| |||
| Predictors | Regression coefficient (95% CI) |
Regression coefficient (95% CI) |
Regression coefficient (95% CI) |
| Log(1-OHP) (ng/ml) | 0.06 (0.001 to 0.12)* | 0.07 (0.001 to 0.13)* | |
| Central Area/ South | 0.23 (0.07 to 0.39)** | −0.04 (−0.11 to 0.02) | −0.02 (−0.10 to 0.05) |
| North Area / South | −0.04(−0.20 to 0.13) | −0.02 (−0.09 to 0.05) | −0.02 (−0.10 to 0.05) |
| Group (Exposed/Reference) | 0.22 (0.06 to 0.38)** | 0.02 (−0.05 to 0.09) | 0.09 (0.01 to 0.17)* |
| Time (Post/Pre-shift) | 0.04 (−0.11 to 0.19) | 0.03 (−0.04 to 0.10) | 0.10 (0.02 to 0.18)* |
| Group* Time | 0.21 (0.05 to 0.37)* | −0.09 (−0.17 to −0.01)* | −0.13 (−0.22 to −0.04)* |
| Age | 0.01 (−0.03 to 0.04) | 0.01 (−0.001 to 0.02) | 0.02 (0.004 to 0.03)* |
| Smoking (yes/no) | 0.21 (0.07 to 0.34)** | −0.01 (−0.07 to 0.04) | 0.04 (−0.02 to 0.10) |
| Urinary creatinine | 0.004 (0.003 to 0.005)** | 0.003 (0.003 to 0.004)** | 0.003 (0.002 to 0.003)** |
| Constant | −1.67 (−2.46 to −0.89) | 0.50 (0.12 to 0.87) | −1.39 (−1.81 to −0.98) |
p<0.05
p<0.01
Discussion
The above results showed that indoor air concentrations of total PAHs and pyrene in military kitchens were closely correlated. It was also demonstrated that COFs exposure among military cooks was higher than exposure among office workers. Airborne particulate PAH levels in kitchens significantly exceeded those in office areas. The mean intra-individual post-shift and pre-shift difference in 1-OHP was statistically significantly greater among the exposed compared with reference group indicating that exposure to COFs over the working week increases the levels of exposure biomarker. There was a statistically significant relation between the log-transformed urinary exposure biomarker (1-OHP) and the urinary measure of DNA damage (8-OHdG). This relation did not change substantially when adjusting for determinants of 8-OHdG, such as cigarette smoking and age.
Validity of Results
The strength of this study was in longitudinal design and the possibility of intra-individual comparison of change in the outcome biomarker in relation to the level of and change in the exposure biomarker. There is no temporal ambiguity concern. A daily diary was used to take into account the exposure related to PAHs on the previous day. In order to achieve comparability of the two groups, we selected a reference group from the northern, central, and southern areas, with similar distributions within each exposed group. None of the workers reported consumption of broiled, grilled and barbecued food 24 hr prior to urine collection. The two groups were healthy soldiers that lived and ate together, but differed in certain potential determinants of urinary 1-OHP, which might have influenced the comparison. Smoking was a strong determinant of urinary 1-OHP levels, and there were more smokers among the cooks (Pearson X2=9.9, p=0.002) compared with office work soldiers. We controlled potential confounding by two analytical approaches. In the comparison between the exposed and reference groups, the intra-individual outcome comparison eliminated the potential confounding. In the assessment of the relations between change in exposure and outcome biomarkers, the GEE models were applied for adjustment for age and smoking.
Previous studies indicated that N45 overestimates 8-OHdG levels, but they also showed that levels determined by ELISA using N45 correlate well with their LC/MS/MS method.(17),(18) Il’yasova et al.(19) indicated that ELISA measurements overestimate F2-Isoprostane levels compared to the GC/MS measurements. Although the ELISA is less accurate than the GC/MC method, levels determined by ELISA correlate well with the corresponding GC/MS method (r=0.51 [p<0.01]). Gariti et al.(20) showed that the concordance of ELISA test with GC/MS was excellent (kappa=0.736, p<0.001). The sensitivity and specificity of cotinine ELISA method were 90.5% and 90.6%, respectively. It would be of interest to use more advanced methods of analysis for 8-OHdG and isoprostane in these subjects in the future.
Synthesis with Previous Knowledge
Our findings are consistent with those of Pan and his colleagues who reported that oxidative DNA damage was associated with exposure to cooking oil fume (9, 21). Pan et al. (9) applied summed concentration of 5 PAHs which included pyrene(Pyr), benzo(a)anthracene (BaA), benzo(k)fluoranthene (BkF), benzo(a)pyrene (BaP), and benzo(ghi)perylene (BghiP). The median sum of PAHs was 24.8 ng/m3 in the kitchens and 4.8 ng/m3 in the dining areas. The corresponding median concentrations of pyrene were 2.9 ng/m3 and 0.3 ng/m3. In our study, the median concentrations in the kitchens were lower; the median concentration of the summed PAHs 7.9 ng/m3 and the median of pyrene concentrations 1.1 ng/m3. In Pan et al.(9) the geometric mean of urinary 8-OHdG among the kitchen staff was 7.0 μg/g creatinine and of urinary 1-OHP 4.1 μg/g creatinine, being significant higher than the corresponding values among the service staff (4.7 and 1.8 μg/g creatinine respectively). In the present study the mean levels of post-shift urinary 8-OHdG and 1-OHP concentrations among the non-smoking military cooks were 7.96 μg/g creatinine and 0.51 μg/g creatinine at the post-shift. Similarly, 1-OHP levels were not related to the total amount of time spent in the kitchen during the workweek. The amount of food cooked and the cooking time may be less sensitive exposure assessment parameters because the most common cooking method in the military kitchen is stir-frying, where the ingredients are raw or partially cooked by pan-frying, and the process itself takes only a few minutes. A large proportion of time might be spent on preparation of the ingredients during which the exposure to COFs is minimal or non-existent.
Our findings clearly show that cooking increases PAH exposure. Stir-frying is an important cooking practice and involves high temperatures, but the process itself takes only a few minutes. Chefs always pour hot oil and wait until the desired pot temperature. Sometimes, the visible oil fume is used as an indicator of desired pot temperature. We found that almost all the cooks (96.1%) would turn on fume extractors whenever they cooked. When we asked whether kitchens were full of cook oil fumes whenever they cooked, we observed a significantly increased urinary 1-OHP trend (z=1.98, p=0.05) for those who reported such increased frequencies (data not shown). Cooks from the central area reported their kitchens to be full of cooking oil fumes more frequently (92%) than cooks from the north (60%) and south (61%). Traffic was recognized as a major contributor to PAH concentration in the urban atmosphere. Our exposed cooks and the office work soldiers generally lived and ate together and thus the dietary contribution of PAHs was expected to be similar. On the basis of local air monitoring data the mean levels of particulate matter were highest in the southern military base, PM2.5 58 μg/m3 (SD 13) and 96 μg/m3 (SD 18), followed by the central base, 50 μg/m3 (SD 19) and 89 μg/m3 (SD 36), and the lowest in the northern base, 35 μg/m3 (SD 11) and PM10 57 μg/m3 (SD 23). We balanced the potential influence of different levels of air pollution on exposure and outcome biomarkers by recruiting similar numbers of exposed and reference subjects from each geographical area, and therefore the traffic pollution was not a likely explanation for differences in change of outcome biomarkers between the cooks and the office workers.
Wei et al. found that differences in the levels of particulate pollution among the Chinese, Malay and Indian stalls may be attributed to the different cooking methods employed at the food stalls.(22) The most important parameter appears to be the predominant cooking method used. Frying processes, especially deep-frying, produce more air pollutants, possibly due to the high oil temperatures used in such operations. Deep-frying at the Malay stall or stir-frying at the Chinese stall gave rise to an abundance of higher molecular weight PAHs, whereas low-temperature cooking, such as simmering at the Indian stall, had a higher concentration of lower molecular weight PAHs.
The observation of lower levels of 1-OHP, isoprostane and 8-OHdG on post-shift compared to pre-shift in the reference group warrants consideration. Based on their report both the cooks and the office workers smoked less towards the end of the week, which could at least partially explain the lower post-shift values in both biomarkers of exposure and outcome. The urinary cotinine measurements showed the same phenomenon. A previous study showed that the half-life of 1-OHP is about 6–35 h.(23) The 8-OHdG represents the DNA repair process for damage from exposure over a longer time period.(24, 25) The higher levels of 1-OHP and 8-OHdG at the pre-shift could be explained by a higher consumption of cigarettes during the weekend.
Exposure to second-hand tobacco smoke was recorded in the daily diary, but there was no influence on urinary 8OHdG and isoprostane concentrations. This could be explained by the smoke-free regulation both in kitchens and office space and therefore exposure to second-hand smoke was minimal. In the linear regression and GEE analyses, creatinine was a significant determinant for all three biomarkers. Adjustment for creatinine is a common practice when assessing the concentration and determinants of urinary metabolites. Creatinine reflects liver and renal function, muscle activity and correspondingly age in a complex manner. The effect of creatinine can also be explained by the fact that it is an indicator for urine dilution.
Sato et al. reported that extreme physical activity could increase the excretion of urinary 8-OHdG.(26) No extreme training was reported during the period of data collection, but the office soldiers performed regular exercise more commonly than the exposed group. Regular and mild exercise has a beneficial effect on the maintenance of low levels of 8-OHdG. Urinary creatinine is also a by-product of muscle exercise. We also found that urinary creatinine concentrations were higher in the control group in comparison to exposed group. The difference in mean urinary creatinine levels between exposed and reference groups could possibly, at least partly, be explained due the higher temperature in the kitchen environments.
Although almost all the cooks (96.1%) turned on fume extractors during cooking, the levels of urinary 1-OHP increased during 5 days of exposure to COF. The possible explanations are that the fume extractors are not positioned appropriately, and ventilation is not efficient. Chiang and his colleagues found that fume samples were mutagenic when the fume extractor was located 70 cm above the oil surface, only weakly or not at all when the distance was 50 cm or less.(2) More recently, a new engineering intervention measure, an embracing air curtain device (EACD) has been demonstrated to be effective in reducing COFs.(27, 28) Levels of PM10, PM2.5 and PM10 in kitchen air were reduced with 55.7–65.8%. The levels of particulate PAHs were also reduced after the introduction of the EACD. Properly designed, installed and maintained extractors prevent exposure by capturing the cooking oil fume at its source and removing it before reaching the breathing zone. However, the statement “properly designed, installed and maintained” does not fully convey the complicated nature of extractor design or the importance of extractor maintenance. The number of windows in the kitchen, the sizes of openings to the outside, and ventilation conditions are also important determinants of the effectiveness of fume extractor.(29) The oil fume collected from heated edible oils, including rapeseed oil, soybean oil, peanut oil, and animal oil, at a high temperature were noted to possess mutagenicity and genetic toxicity.(1, 21, 30) Another important explanation is that most military kitchens use vegetable oil rather than lard oil because it is low in cholesterol. However, vegetable oil containing unsaturated fatty acids was found to be more unstable than lard oil at higher temperatures and could emit benzo[a]pyrene, not present in lard oil fumes.(1) Therefore, changing cooking habits or cooking at lower temperatures, installing a well-designed fume extractor in the kitchen and adequate extractor maintenance should be encouraged.
Conclusions
Our results indicate that exposure to cooking-oil fumes increases the urinary concentration of 8-OHdG, and isoprostane suggesting that these might be useful biomarkers of oxidative stress from cooking-oil fume exposure. Our data suggest that exposure to PAHs or possibly other compounds in cooking-oil fumes may cause oxidative DNA damage. A well-designed fume extractor and adequate extractor maintenance practice are highly recommended for use in military kitchens. Controlled intervention studies are needed to assess whether a well-designed engineering intervention can reduce occupational exposure to cooking oil fumes and changes in oxidative DNA damage among military and other professional cooks.
Acknowledgments
This research was supported by Ministry of National Defence (Republic of China). JJ was supported by the Academy of Finland grants No. 129419 (SALVE Research Program).
Footnotes
Competing Interest: None declared.
Contributor Information
Ching-Huang Lai, Email: lgh@mail.ndmctsgh.edu.tw.
Jouni J.K. Jaakkola, Email: jouni.jaakkola@oulu.fi.
Chien-Yi Chuang, Email: yihung.wang@mail.ndmctsgh.edu.tw.
Saou-Hsing Liou, Email: shliou@nhri.org.tw.
Shih-Chun Lung, Email: sclung@rcec.sinica.edu.tw.
Ching-Hui Loh, Email: twdoc@mail.ndmctsgh.edu.tw.
Dah-Shyong Yu, Email: yuds@ms21.hinet.net.
Paul T. Strickland, Email: pstrickl@jhsph.edu.
References
- 1.Chiang TA, Wu PF, Wang LF, Lee H, Lee CH, Ko YC. Mutagenicity and polycyclic aromatic hydrocarbon content of fumes from heated cooking oils produced in Taiwan. Mutat Res. 1997;381:157–61. doi: 10.1016/s0027-5107(97)00163-2. [DOI] [PubMed] [Google Scholar]
- 2.Chiang TA, Wu PF, Ko YC. Prevention of exposure to mutagenic fumes produced by hot cooking oil in Taiwanese kitchens. Environ Mol Mutagen. 1998;31:92–6. [PubMed] [Google Scholar]
- 3.Pan CH, Chan CC, Huang YL, Wu KY. Urinary 1-hydroxypyrene and malondialdehyde in male workers in Chinese restaurants. Occup Environ Med. 2008;65:732–5. doi: 10.1136/oem.2007.036970. [DOI] [PMC free article] [PubMed] [Google Scholar]
- 4.Singh VK, Patel DK, Jyoti, Ram S, Mathur N, Siddiqui MK. Blood levels of polycyclic aromatic hydrocarbons in children and their association with oxidative stress indices: an Indian perspective. Clin Biochem. 2008;41:152–61. doi: 10.1016/j.clinbiochem.2007.11.017. [DOI] [PubMed] [Google Scholar]
- 5.Svecova V, Rossner P, Jr, Dostal M, Topinka J, Solansky I, Sram RJ. Urinary 8-oxodeoxyguanosine levels in children exposed to air pollutants. Mutat Res. 2009;662:37–43. doi: 10.1016/j.mrfmmm.2008.12.003. [DOI] [PubMed] [Google Scholar]
- 6.Pilger A, Rudiger HW. 8-Hydroxy-2′-deoxyguanosine as a marker of oxidative DNA damage related to occupational and environmental exposures. Int Arch Occup Environ Health. 2006;80:1–15. doi: 10.1007/s00420-006-0106-7. [DOI] [PubMed] [Google Scholar]
- 7.Liu X, Meng Z. Effects of airborne fine particulate matter on antioxidant capacity and lipid peroxidation in multiple organs of rats. Inhal Toxicol. 2005;17:467–73. doi: 10.1080/08958370590964467. [DOI] [PubMed] [Google Scholar]
- 8.Cracowski JL. Isoprostanes: an emerging role in vascular physiology and disease? Chem Phys Lipids. 2004;128:75–83. doi: 10.1016/j.chemphyslip.2003.10.006. [DOI] [PubMed] [Google Scholar]
- 9.Pan CH, Chan CC, Wu KY. Effects on Chinese restaurant workers of exposure to cooking oil fumes: a cautionary note on urinary 8-hydroxy-2′-deoxyguanosine. Cancer Epidemiol Biomarkers Prev. 2008;17:3351–7. doi: 10.1158/1055-9965.EPI-08-0075. [DOI] [PubMed] [Google Scholar]
- 10.Ke Y, Cheng J, Zhang Z, Zhang R, Shuai Z, Wu T. Increased levels of oxidative DNA damage attributable to cooking-oil fumes exposure among cooks. Inhal Toxicol. 2009;21:682–7. doi: 10.1080/08958370802474728. [DOI] [PubMed] [Google Scholar]
- 11.Jongeneelen FJ, Anzion RB, Henderson PT. Determination of hydroxylated metabolites of polycyclic aromatic hydrocarbons in urine. J Chromatogr. 1987;413:227–32. doi: 10.1016/0378-4347(87)80230-x. [DOI] [PubMed] [Google Scholar]
- 12.Tsai PJ, Shih TS, Chen HL, Lee WJ, Lai CH, Liou SH. Urinary 1-hydroxypyrene as an indicator for assessing the exposures of booth attendants of a highway toll station to polycyclic aromatic hydrocarbons. Environ Sci Technol. 2004;38:56–61. doi: 10.1021/es030588k. [DOI] [PubMed] [Google Scholar]
- 13.Chuang CY, Lee CC, Chang YK, Sung FC. Oxidative DNA damage estimated by urinary 8-hydroxydeoxyguanosine: influence of taxi driving, smoking and areca chewing. Chemosphere. 2003;52:1163–71. doi: 10.1016/S0045-6535(03)00307-2. [DOI] [PubMed] [Google Scholar]
- 14.Maeshima E, Liang XM, Otani H, Mune M, Yukawa S. Effect of environmental changes on oxidative deoxyribonucleic acid (DNA) damage in systemic lupus erythematosus. Arch Environ Health. 2002;57:425–8. doi: 10.1080/00039890209601432. [DOI] [PubMed] [Google Scholar]
- 15.Lai CH, Liou SH, Lin HC, Shih TS, Tsai PJ, Chen JS, et al. Exposure to traffic exhausts and oxidative DNA damage. Occup Environ Med. 2005;62:216–22. doi: 10.1136/oem.2004.015107. [DOI] [PMC free article] [PubMed] [Google Scholar]
- 16.Barr DB, Wilder LC, Caudill SP, Gonzalez AJ, Needham LL, Pirkle JL. Urinary creatinine concentrations in the U.S. population: implications for urinary biologic monitoring measurements. Environ Health Perspect. 2005;113:192–200. doi: 10.1289/ehp.7337. [DOI] [PMC free article] [PubMed] [Google Scholar]
- 17.Shimoi K, Kasai H, Yokota N, Toyokuni S, Kinae N. Comparison between high-performance liquid chromatography and enzyme-linked immunosorbent assay for the determination of 8-hydroxy-2′-deoxyguanosine in human urine. Cancer Epidemiol Biomarkers Prev. 2002;11:767–70. [PubMed] [Google Scholar]
- 18.Hu CW, Wu MT, Chao MR, Pan CH, Wang CJ, Swenberg JA, et al. Comparison of analyses of urinary 8-hydroxy-2′-deoxyguanosine by isotope-dilution liquid chromatography with electrospray tandem mass spectrometry and by enzyme-linked immunosorbent assay. Rapid communications in mass spectrometry: RCM. 2004;18:505–10. doi: 10.1002/rcm.1367. [DOI] [PubMed] [Google Scholar]
- 19.Il’yasova D, Morrow JD, Ivanova A, Wagenknecht LE. Epidemiological marker for oxidant status: comparison of the ELISA and the gas chromatography/mass spectrometry assay for urine 2,3-dinor-5,6-dihydro-15-F2t-isoprostane. Annals of epidemiology. 2004;14:793–7. doi: 10.1016/j.annepidem.2004.03.003. [DOI] [PubMed] [Google Scholar]
- 20.Gariti P, Rosenthal DI, Lindell K, Hansen-Flaschen J, Shrager J, Lipkin C, et al. Validating a dipstick method for detecting recent smoking. Cancer Epidemiol Biomarkers Prev. 2002;11:1123–5. [PubMed] [Google Scholar]
- 21.Wu SC, Yen GC, Sheu F. Mutagenicity and identification of mutagenic compounds of fumes obtained from heating peanut oil. J Food Prot. 2001;64:240–5. doi: 10.4315/0362-028x-64.2.240. [DOI] [PubMed] [Google Scholar]
- 22.Wei See S, Karthikeyan S, Balasubramanian R. Health risk assessment of occupational exposure to particulate-phase polycyclic aromatic hydrocarbons associated with Chinese, Malay and Indian cooking. J Environ Monit. 2006;8:369–76. doi: 10.1039/b516173h. [DOI] [PubMed] [Google Scholar]
- 23.Buckley TJ, Lioy PJ. An examination of the time course from human dietary exposure to polycyclic aromatic hydrocarbons to urinary elimination of 1-hydroxypyrene. Br J Ind Med. 1992;49:113–24. doi: 10.1136/oem.49.2.113. [DOI] [PMC free article] [PubMed] [Google Scholar]
- 24.Nilsson RI, Nordlinder RG, Tagesson C, Walles S, Jarvholm BG. Genotoxic effects in workers exposed to low levels of benzene from gasoline. Am J Ind Med. 1996;30:317–24. doi: 10.1002/(SICI)1097-0274(199609)30:3<317::AID-AJIM10>3.0.CO;2-Z. [DOI] [PubMed] [Google Scholar]
- 25.Kondo K, Watanabe A, Akiyama H, Maitani T. The metabolisms of agaritine, a mushroom hydrazine in mice. Food and chemical toxicology: an international journal published for the British Industrial Biological Research Association. 2008;46:854–62. doi: 10.1016/j.fct.2007.10.022. [DOI] [PubMed] [Google Scholar]
- 26.Sato Y, Nanri H, Ohta M, Kasai H, Ikeda M. Increase of human MTH1 and decrease of 8-hydroxydeoxyguanosine in leukocyte DNA by acute and chronic exercise in healthy male subjects. Biochem Biophys Res Commun. 2003;305:333–8. doi: 10.1016/s0006-291x(03)00774-5. [DOI] [PubMed] [Google Scholar]
- 27.Pan CH, Shih TS, Chen CJ, Hsu JH, Wang SC, Huang CP, et al. Reduction of cooking oil fume exposure following an engineering intervention in Chinese restaurants. Occup Environ Med. 68:10–5. doi: 10.1136/oem.2009.049767. [DOI] [PubMed] [Google Scholar]
- 28.Pan CH, Shih TS, Chen CJ, Hsu JH, Wang SC, Huang CP, et al. Reduction of cooking oil fume exposure following an engineering intervention in Chinese restaurants. Occup Environ Med. 2011;68:10–5. doi: 10.1136/oem.2009.049767. [DOI] [PubMed] [Google Scholar]
- 29.Ko YC, Cheng LS, Lee CH, Huang JJ, Huang MS, Kao EL, et al. Chinese food cooking and lung cancer in women nonsmokers. Am J Epidemiol. 2000;151:140–7. doi: 10.1093/oxfordjournals.aje.a010181. [DOI] [PubMed] [Google Scholar]
- 30.Dung CH, Wu SC, Yen GC. Genotoxicity and oxidative stress of the mutagenic compounds formed in fumes of heated soybean oil, sunflower oil and lard. Toxicol In Vitro. 2006;20:439–47. doi: 10.1016/j.tiv.2005.08.019. [DOI] [PubMed] [Google Scholar]