

Abstract
Objectives
Treatment for atypical endometrial hyperplasia (AEH) is based on pathologic diagnosis. About 40% of AEH is found to be carcinoma at surgery. This study's objective is to derive an objective characterization of nuclei from cases diagnosed as AEH or superficially invasive endometrial cancer (SIEC).
Methods
Cases from GOG study 167A were classified by a central pathology committee as AEH (n=39) or SIEC (n=39). High resolution digitized images of cell nuclei were recorded. Features of the nuclear chromatin pattern were computed. Classification rules were derived by discriminant analysis.
Results
Nuclei from cases of AEH and SIEC occupy the same range on a progression curve for endometrial lesions. Cases of AEH and SIEC both comprise nuclei of two phenotypes: hyperplastic characteristics and premalignant/neoplastic characteristics. The principal difference between AEH and SIEC is percentage of premalignant/neoplastic nuclei. When this percentage approaches 50-60% superficial invasion is likely. SIEC may develop already from lesions at the low end of the progression curve.
Conclusions
AEH comprises cases which may constitute a low risk group involving <40% of AEH cases. These cases hold a percentage of <20% of nuclei of a preneoplastic phenotype. AEH cases from the central and high end of progression have >40 % of nuclei of preneoplastic phenotype. Nuclei of the preneoplastic phenotype in AEH lesions are almost indistinguishable from nuclei in SIEC, where this percentage exceeds 60%. The percentage of nuclei of the preneoplastic phenotype in AEH lesions might serve as criterion for assessment of risk for the development of invasive disease.
Keywords: Atypical endometrial hyperplasia, endometrial cancer, karyometry, risk stratification
Introduction
Endometrial cancer is the most common gynecologic cancer diagnosis in the United States, accounting for an estimated 40,100 new cases and 7,470 deaths in 2008 [1]. Worldwide, cases are believed to exceed 180,000 per annum [2]. The most common subtype of endometrial cancer (Type I) is characterized by low to moderate grade lesions with good prognosis and is often associated with a hyper-estrogen condition such as obesity or in the setting of estrogen therapy. Type I endometrial cancer is believed to be preceded by atypical endometrial hyperplasia (AEH) [3], which is a histopathologic diagnosis made on the basis of the World Health Organization classification criteria [4], or using endometrial intraepithelial neoplasia (EIN) criteria [5].
The histopathologic classification of endometrial lesions is a difficult task requiring extensive experience. The Gynecologic Oncology Group (GOG) conducted a study (GOG 167A) that was designed to estimate the frequency of endometrial cancer in hysterectomy specimens in subjects who had a biopsy diagnosis of atypical endometrial hyperplasia. The reproducibility of the diagnosis of atypical endometrial hyperplasia was surprisingly low [6]. The study found a low rate of agreement (kappa value = 0.28) for AEH diagnosis. The reproducibility even among the central review panel members was slightly better but still limited. Paired kappa values ranged from 0.34-0.43. This is important because 42.6% of patients diagnosed with AEH at biopsy had concurrent endometrial carcinoma at hysterectomy [7]. Therefore, there is a need to develop an objective diagnostic approach to distinguish between endometrial precancer and cancerous lesions in order to improve the clinical management of these patients.
The co-occurrence of endometrial carcinoma in cases of atypical hyperplasia had been explored by Dunton et al. [8] and by Garcia et al. [9]. There were several image analysis studies to predict risk for invasive disease, outcome, survival, and recurrence [10-14]. The earliest study of digitized imagery from atypical hyperplasia of the endometrium dates back to 1969 [15]. Subsequent studies provided a karyometric characterization of the nuclear chromatin pattern in endometrial lesions [9,16-18]. We previously demonstrated a progression curve for endometrial lesions from normal proliferative endometrium to simple hyperplasia, atypical hyperplasia, and to invasive endometrial cancer with a karyometric approach [19]. A progression curve is a graphic tool in the analysis which provides a measure for the deviation of a lesion from normal. It is not to be interpreted as representing a histopathologic process. Progression curves have found useful application in defining preneoplastic prostatic [20] and colonic lesions [21], and in the measurement of efficacy of chemopreventive interventions [22,23].
Karyometry assesses nuclear chromatin pattern information. It is a method that can be used to detect very early events in the process of carcinogenesis [24]. Earlier measurements found lesions of atypical endometrial hyperplasia to contain nuclei of different phenotypes [9]. Nuclei in endometrial lesions appear to undergo a continuous progression in the process of carcinogenesis with the more abnormal phenotypes found in lesions of atypical hyperplasia and carcinoma [9].
The objectives of the GOG 167A study [6,7] included the development of procedures for an objective diagnostic discrimination of endometrial lesions. The distinction of atypical endometrial hyperplasia from cancer, either superficially invasive or involving deep invasion of the myometrium, was clinically the most important aspect of this project. A karyometric study was designed to utilize prospectively collected tissue samples collected in GOG 167A to explore the karyometric characteristics of tissue from patients with a referred diagnosis of AEH.
The present study revealed that the nuclear populations of atypical hyperplasia and superficially invasive endometrial cancer comprise nuclei of two main phenotypes. One of these has a chromatin pattern as seen in hyperplastic nuclei, whereas the other has pre-neoplastic/neoplastic characteristics, as detailed below. Both phenotypes are present in cases of AEH and of SIEC. The pre-neoplastic/neoplastic phenotype increases in proportion in AEH cases further along on the progression curve. It predominates in SIEC lesions.
This finding added to the original objective of the karyometric study, the defining of objective criteria to distinguish AEH from SIEC, the search for a criterion allowing a stratification of risk for the development of invasive cancer.
Materials and Methods
Clinical cases
The clinical materials evaluated in this study included hysterectomy specimens from patients enrolled on GOG 167A. Briefly, GOG 167A was designed and implemented to estimate and compare the frequency of endometrial carcinoma at hysterectomy in patients diagnosed with atypical endometrial hyperplasia at initial biopsy and those not considered AEH by central review. The GOG consensus diagnosis by the central pathology review panel was accepted as the reference standard.. Additional details of GOG 167A are presented elsewhere [6,7].
GOG 167A enrolled 306 women with a referred diagnosis of AEH. Among them, 130 had a consensus diagnosis and histopathologic sections from the hysterectomy specimen. Our study was restricted to cases diagnosed as AEH or SIEC. The 130 cases with a consensus diagnosis included 39 cases of AEH and 29 cases of SIEC. All cases were derived from hysterectomy specimens obtained from patients with endometrial biopsies of AEH diagnosed by referral pathologists. All of the diagnoses for the study cases were made by the GOG central review pathology panel and represented the consensus opinion of three experienced gynecologic pathologists [6].
The study was presented to and approved by local institutional review boards prior to activation and all patients provided written consent prior to enrollment on the study. The GOG 167 study involved 130 cases for which a consensus diagnosis was available. The current study was aimed strictly at the distinction between AEH and superficially invasive cancer; there were 68 cases for which the consensus diagnosis had been AEH or superficially invasive endometrial cancer. All of these cases were included in this study. The 39 cases of AEH were recorded with 3,904 nuclei. The cases of invasive cancer included 29 cases of superficially invasive lesions with 3,188 nuclei recorded.
Reference cases
Also recorded were nuclei from 21 cases of normal endometrium. This set of 21 cases of normal endometrium have been published elsewhere [17]. These normal cases were used as the reference point for the determination of a progression curve. From the 21 cases of normal endometrium 2,072 nuclei were recorded. Eleven cases of endometrial carcinoma with deep myometrial invasion were recorded to establish the high end of the progression curve.
Karyometric studies
All hysterectomy sections were cut to 5 microns and put on positively charged slides. All the slides were stained with routine hematoxylin and eosin (H&E) in a single batch to avoid variations in dye from different concentrations and staining times. One of the three gynecologic pathologists (C.T.) outlined most representative areas from which nuclei were to be recorded.
The image of every recorded nucleus, segmented and processed for analysis, can be recalled from the image data bank. Images were recorded on a 3 CCD video microphotometer equipped with a 100:1, N.A. 1.40 plan apochromatic oil immersion objective by NIKON (Melville, N.Y) and a DXC 9000 3CCD camera (SONY, New York, NY). Relay optics adjusted the sampling frequency to 6 pixels per linear micron. A narrow band interference filter with a band pass at 620 nm was used to enhance contrast. The nuclei were segmented by an automated process followed by careful manual correction where needed.
Feature selection
Features were selected for high discrimination potential by a Kruskal Wallis test [25]. This non-parametric test was chosen because it does not impose distributional assumptions. A level of significance of p<0.005 was chosen in view of the multiple comparisons being conducted. Features were then selected not strictly in order of value of test statistic, but rather to reflect different aspects of chromatin texture. Feature selection also took into account an ambiguity function [26,27].
Classification procedures included linear discriminant analysis [28] and an unsupervised learning algorithm P-index [29]. Discriminant analysis allows the combined use of several karyometric features to distinguish between two categories of nuclei. The algorithm forms a linear combination of the features such that a direction in feature space best separating the two categories is found. For each nucleus a discriminant score is computed which assigns it to one of the two categories. It also reflects how much the nucleus differs from the nuclei in the other category. For the unsupervised learning algorithm, the two features relative nuclear area and the number of dark pixels were used. The case mean feature values for both, nuclei from AEH and SIEC, were combined into a single file and submitted to the unsupervised learning algorithm P-index. This algorithm searches for, and forms in an iterative fashion, natural subgroups of cases, based on similarities in the mean values of the selected features. The statistical significance of a partitioning into subgroups is tested by the Beale statistic [30].
Results
Figure 1 shows a progression curve for endometrial lesions from normal endometrial tissue to tissue from AEH, SIEC and deeply invasive cancer. The ellipses are the 95% confidence ellipses for the case means. The distributions, from AEH to cancer, overlap widely. For cases with a consensus diagnosis of AEH, or of SIEC, the bivariate distributions of nuclear populations overlap, i.e. for the two key variables indicative of lesion progression - relative nuclear area and number of dark pixels - there is no statistically significant difference between nuclei from AEH and from SIEC.
Fig. 1.

Progression curve of endometrial lesions. The distributions of case mean values for AEH and for SIEC, with their 95% confidence ellipses, fall between normal proliferative endometrial epithelium, and deeply invasive endometrial carcinoma.
Figure 2 shows the case mean values. It demonstrates two important findings. Cases diagnosed as AEH or as SIEC occupy the same range on the progression curve. The figure shows that the case mean values fall into three loosely defined groups, a cluster at the low end of progression, a central cluster and a cluster of cases at the high end of progression, as formed by the unsupervised learning algorithm P-index. Furthermore, the figure shows that the ability to invade, at least superficially, exists already for nuclei from cases at the low end of the progression curve, i.e. it is not a capability developing as a function of advanced lesion progression.
Fig. 2.

Case mean values for AEH and SIEC. The “+” mark indicates the subgroup centroids.
It is possible to develop a discriminant function for the distinction of nuclei from cases diagnosed as AEH, or as SIEC, even though one would not expect a better than modest classification success. There were 3,904 nuclei from AEH, and 3,188 nuclei from SIEC available. Feature selection identified 6 chromatin texture features with good discrimination potential.
The discriminant function score for the distinction of nuclei from AEH versus nuclei from SIEC is defined as: DF = 0.56 (run percentage) + 0.54 (# of runs 3 - 4 pixels in length) - 0.51 (total optical density) + 0.43 (# of dark stained pixels) - 0.40 (long run emphasis) - 0.15 (pixel optical density variance).
The classification rule led to a correct assignment of 65.8 % of AEH nuclei and of 60 % of SIEC nuclei.
The very modest success in the correct classification of nuclei from AEH and SIEC suggests one of two interpretations. First, assuming that the nuclear populations from cases of AEH, or from cases of SIEC each are homogeneous it would mean that the nuclei from these two diagnostic categories are very similar in their chromatin pattern, and that karyometry just cannot effectively distinguish them. Second, the nuclear populations in both diagnostic categories contain a mixture of nuclei of the same two phenotypes, but in different proportions. On the average thus, the nuclear populations would appear to be very similar which would result in a low classification success.
Figure 3 shows the distribution of discriminant function scores. A shift towards high score values indicates increased deviation from normal.
Fig. 3.
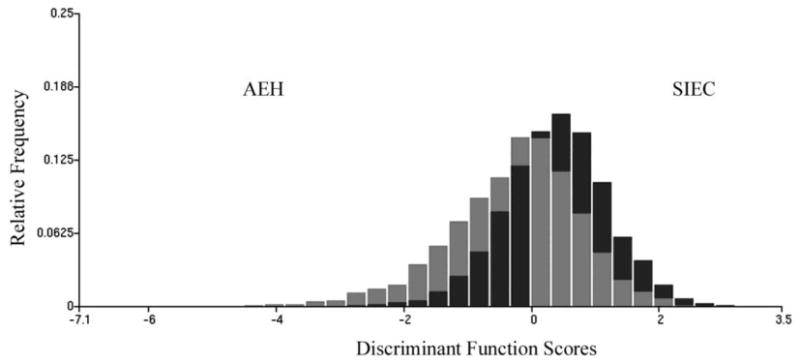
Distribution of discriminant function scores for nuclei from AEH and SIEC cases. Shift to higher score values indicates higher deviation from normal tissue. The dark bars indicate the relative frequency of occurrence of nuclei of the phenotype II with a discriminant score in each interval of the discriminant function score axis, the grey bars indicate those for the nuclei of phenotype I.
The modest classification success thus is at least partially due to the model underlying the discriminant analysis. In this model the nuclear populations from cases of AEH or from SIEC are assumed to be homogeneous and the dispersion of feature values, in direction of lesion progression, is assumed to be due only to randomness.
From a biologic standpoint it must be assumed that the nuclear populations undergo changes in their feature distributions as a function of lesion progression, increased dispersion of values. To probe for natural groupings or clusters of cases due to such changes, along the progression curve, the cases from AEH and SIEC were merged into a single file. The case means for the two variables relative nuclear area and number of dark pixels were submitted to the unsupervised learning algorithm P-index, to provide an objective basis for a partitioning of the data sets as a function of lesion progression.
The algorithm formed three subgroups that significantly differ statistically as already indicated in Figure 2. Each subgroup contained cases of AEH and of SIEC. The cluster at the low end of the progression curve held 24 cases of AEH with 2,416 nuclei, and 14 cases of SIEC, with 1,599 nuclei. In the cluster at the center of the progression curve there were 8 cases of AEH with 802 nuclei, and 8 cases of SIEC with 737 nuclei. In the cluster at the high end of progression there were 7 cases of AEH with 686 nuclei and 7 cases of SIEC with 852 nuclei.
The three subgroups of cases coined “low end, central, or high end of progression” were formed by the unsupervised learning algorithm P-index, i.e., they are natural groupings of cases. The definition thus is based on karyometric procedures. The reference to “progression” is made because the three subgroups comprise cases with increasing deviation from normal, which places them, on the progression curve, increasingly closer to cases with deeply invasive cancer.
Applying the above discriminant function to the cases diagnosed as AEH, in each of the three clusters formed by P-index classification results were obtained as shown in Table 1. The nuclear populations in cases diagnosed as AEH comprise nuclei with karyometric characteristics of nuclei from SIEC, as a function of lesion progression, to the extent that for cases in the central and high end of the progression curve close to 60% of nuclei are similar to nuclei from SIEC. In contrast, nuclei from cases diagnosed as SIEC from the low end, central portion and high end of the progression were classified as SIEC to 64.4 %, 63.9 % and 78.2 %. The subpopulations from cases of AEH, which are thresholded off and assigned to the SIEC category by the discriminant function, are not pure populations of the type of nuclei found in SIEC. In their feature values they approximate the data obtained from SIEC nuclei.
Table 1. Classification results for nuclei from AEH from three clusters formed by P-index.
| AEH (%) | SIEC (%) | |
|---|---|---|
| Cluster at low end of progression | 71.3 | 28.7 |
| Central portion | 42.7 | 57.3 |
| High end | 41.8 | 58.2 |
Nuclear Phenotypes
The above results are consistent with the hypothesis that the nuclear populations of cases diagnosed as AEH or diagnosed as SIEC both contain nuclei of two major phenotypes. One may be referred to as phenotype I, representing a hyperplastic situation, the other as phenotype II, which is preneoplastic/neoplastic.
For two key variables reflecting progression to invasive disease, the relative nuclear area and the number of dark pixels, i.e. densely staining chromatin granules, the differences between nuclei of the two phenotypes are very clear.
Compared to a population of nuclei from normal endometrium, nuclei of phenotype I have an increased relative nuclear area by 5%, comparable to the 10% increase seen in cases of simple hyperplasia. Nuclei of phenotype II have a relative nuclear area increased by 63%, comparable to 55%, seen in deeply invasive carcinoma. The comparison is made to deeply invasive carcinoma, since the SIEC population is not of pure phenotype II. For SIEC the increase is 37%. For the number of dark pixels the increase from normal, for phenotype I is by 9 %, compared to 6% in simple hyperplasia. For phenotype II the increase is by 81%, closer to the increase by 61% seen in deeply invasive carcinoma, or 44% in SIEC.
The data suggest that the main difference between the two diagnostic categories of AEH and SIEC is the proportion of nuclei of the preneoplastic type. When this proportion approaches 60% or more, superficial invasion is likely.
There were among the cases diagnosed as AEH several which had close to 100% of their nuclei classified as AEH. These cases represent a nearly pure population of the hyperplastic phenotype I. There also were AEH cases with a near 100% classification rate of their nuclei as SIEC. They constitute a nearly pure population of nuclei of the preneoplastic/neoplastic phenotype II.
Four hundred nuclei each from these two “pure” populations from cases diagnosed as AEH were submitted to a discriminant analysis. The discriminant function score for the distinction of the hyperplastic versus the preneoplastic/neoplastic phenotype defined as: DF = 0.57 (pixel optical density condensation) + 0.45 (total optical density) + 0.22 (# of runs 1 - 2 pixels in length). The feature weights are given as standardized coefficients. The average correct classification rate was 86.3 %. Fig. 4 shows the distribution of discriminant function scores.
Fig. 4.

Discrimination of phenotype I from phenotype II.
Risk stratification
Fig. 5 shows the distribution of nuclear classification rates. For AEH cases at the low end of the progression curve, 37% have less than 20% of their nuclei classified as SIEC. Only 12% have more than 60% of their nuclei thus classified. The group of AEH cases with only 20% of nuclei classified as SIEC might be considered as a low risk group. Of the SIEC cases at the low end of the progression curve, only 3% have such a moderate percentage of nuclei classified as SIEC. Of the AEH cases from the central and high end of the progression, in contrast, only 7% fall into the low risk group. About 60% of them have from 60-100% of their nuclei classified as SIEC. In comparison, 60% of SIEC cases also have 60-100% of nuclei assigned to the SIEC category.
Fig. 5.

5a, Plot of the percentage of AEH cases having a certain percentage of nuclei classified as SIEC for the low end of progression and 5b, for the central and high end of progression, in comparison to 5c, cases of SIEC.
Fig. 5a shows, for the 24 cases diagnosed as AEH at the low end of progression, the distribution of percentages of nuclei designated as SIEC. The corresponding plot for the combined cases from the central and high end portion of progression is shown in Figure. 5b. Only 13% of cases diagnosed as AEH in the combined subgroups had nuclei assigned to the SIEC category at rates of 80% or more. However, there were about 47% of cases where the assignment of nuclei to SIEC exceeded 60%. These cases clearly constitute a higher risk group. Of the cases diagnosed as SIEC 38% had more than 80% of their nuclei so assigned, as seen in Figure. 5c.
The sample size of 39 cases of AEH is not adequate to set definitive criteria for risk assessment. However, it seems reasonable to conclude that when the proportion of nuclei of phenotype II equals or exceeds the proportion seen in SIEC, an assessment of high risk is indicated.
Discussion
While karyometric assessment does not provide a distinctive diagnostic criterion for an individual patient, it does provide a measure of risk for the development of invasive disease. Studies to support the diagnostic assessment of endometrial lesions by computer aided morphometric analyses go back over 30 years. These efforts were aimed at two objectives, the diagnostic distinction between benign and cancer, and procedures that allow a stratification of patients into risk groups for the development of myometrial invasion.
Diegenbach and Baak [16] in 1978 employed features descriptive of the nuclear chromatin texture to classify 30 nuclei from hyperplastic, and 27 nuclei from malignant appearing glands in the same paraffin section. Baak et al [10] concluded, in a 1981 study, that the notable overlap in the values of quantitative histologic features from cases of AEH or well differentiated adenocarcinoma precluded an application to the assessment of individual patients. However, a discriminant analysis based on three histologic, tissue architectural features and six features descriptive of nuclear shape resulted in a correct recognition of practically all processed cases. The study led to the development of the so-called 4-class rule, for a case classification as normal, atypical hyperplasia, well differentiated or poorly differentiated endometrial carcinoma. This study involved eight cases of marked AEH and eight cases of well differentiated carcinoma in the training set.
The problem of risk stratification was addressed by Baak et al by introducing the so-called multivariate computerized morphometric D-score for a prognostic assessment of hyperplastic endometrial lesions [11]. This score is based on two histologic criteria - evaluated by a stereologic procedure - and one morphometric feature, the standard deviation of measurements of the shortest nuclear axis. The D-score was reported by Orbo et al. [13, 14] to have a sensitivity of 100 % and to be better than the WHO classification. A study by Dunton et al. [8] involved 45 patients with endometrial hyperplasia and 10 patients with grade I endometrial carcinoma. Of the 45 patients with hyperplasia 12 were found to have co-existent cancer. All of these cases occurred in patients with atypical hyperplasia. These authors used a combination of the D-score and the 4-class score classification by Baak, and found a specificity for the prediction of carcinoma of 100 %. Finally, Mutter et al, utilizing endometrial biopsy samples from GOG-167 and the Baak 4-class score classification, documented a high predictive accuracy for myoinvasion by endometrial carcinoma [31]. In the present study all 39 cases of AEH had been carefully adjudicated to be free of cancer. A risk assessment thus is based solely on information offered by the AEH lesion. McKenney and Longacre, in their recent comprehensive review [32] make it clear that the distinction of endometrial hyperplasia from well differentiated adenocarcinoma continues to be a difficult differential diagnosis in surgical pathology. They identify, as helpful for the distinction the criteria of complex glandular architectural patterns and marked cytologic atypia.
McKenney and Longacre distinguish three groups of patients, based on the spectrum of tissue architectural complexity. There are patients with complex atypical hyperplasia at very low risk for myometrial invasion, patients for which borderline well differentiated adenocarcinoma cannot be excluded who are at intermediate risk, and those at very high risk.
The findings of our karyometric study are compatible with the conclusions reached by McKenney and Longacre. An assessment of risk for the progression from AEH to well differentiated adenocarcinoma might be based on the percentage of nuclei of the pre-neoplastic/neoplastic phenotype. In this study, of the 24 AEH cases at the low end of the progression curve 9/24 had less than 20 % of such nuclei, and 20/24 of these cases had fewer than 60 %. In the 15 cases diagnosed as AEH falling onto the central and high end of the progression curve, all had more than 60 % nuclei of the pre-neoplastic/neoplastic phenotype.
The karyometric study revealed another finding related to risk. The nuclear populations observed in cases diagnosed as AEH or as SIEC occupy the same range on the progression curve. The ability to invade may be independent of the general progression of a lesion, as indicated by the increase in relative nuclear area and the increase in densely stained chromatin granules.
Nuclei of the preneoplastic phenotype are larger than nuclei of the hyperplastic phenotype, and they stain denser. A risk assessment based on the percentage of such nuclei may require a precise estimate of that percentage. It is here where one would expect a karyometric procedure to offer an advantage over a visual assessment.
The results obtained in this karyometric study may lead to a numerically defined assessment of risk for invasive disease and thus contribute to the clinical management of patients. However, the results were obtained from hysterectomy specimen. A confirmation on biopsy specimen would be required before a pathology laboratory test is developed for a clinical application.
Research Highlights.
AEH or superficially invasive carcinoma occupy the same range on the progression curve.
Superficial invasion may develop from lesions at the low end of the progression curve.
Both AEH and superficially invasive carcinoma comprise nuclei of two main phenotypes.
Acknowledgments
This research was supported in part by grants CA-23074, CA-82715 and CA-418190 from the National Institutes of Health, Bethesda, MD. The content of this paper is solely the responsibility of the authors and does not necessarily represent the official views of the National Institutes of Health. This study was also supported by National Cancer Institute grants to the Gynecologic Oncology Group Administrative Office (CA 27469) and the Gynecologic Oncology Group Statistical and Data Center (CA 37517). Funds for this study are supported by CA 101165.
The following Gynecologic Oncology Group member institutions participated in this study: Duke University Medical Center, Walter Reed Army Medical Center, University of Arizona, University of Mississippi Medical Center, University of Pennsylvania Cancer Center, Milton S. Hershey Medical Center, University of North Carolina School of Medicine, University of Iowa Hospitals and Clinics, University of Texas Southwestern Medical Center at Dallas, Wake Forest University School of Medicine, University of California Medical Center at Irvine, Tufts-New England Medical Center, University of Kentucky, The Cleveland Clinic Foundation, State University of New York at Stony Brook, Washington University School of Medicine, Memorial Sloan-Kettering Cancer Center, Columbus Cancer Council, University of Massachusetts Medical School, Fox Chase Cancer Center, Women's Cancer Center, University of Oklahoma, University of Virginia, University of Chicago, Tacoma General Hospital, Brookview Research Inc, Ellis Fischel Cancer Center, and Fletcher Allen.
Footnotes
Conflict Of Interest Statement: The authors wish to report that Dr. Bartels and Alberts own two U.S. patents concerning the application of karyometry the documentation of progression curves from normal human tissue to invasive carcinoma..
Publisher's Disclaimer: This is a PDF file of an unedited manuscript that has been accepted for publication. As a service to our customers we are providing this early version of the manuscript. The manuscript will undergo copyediting, typesetting, and review of the resulting proof before it is published in its final citable form. Please note that during the production process errors may be discovered which could affect the content, and all legal disclaimers that apply to the journal pertain.
References
- 1.Jemal AR, Siegel R, Ward E, et al. Cancer statistics, 2008. CA Cancer J Clin. 2008;58:71–96. doi: 10.3322/CA.2007.0010. [DOI] [PubMed] [Google Scholar]
- 2.Parkin DM, Pisani P, Ferlay J. Estimates of the worldwide incidence of 25 major cancers in 1990. Int J Cancer. 1999;80:827–841. doi: 10.1002/(sici)1097-0215(19990315)80:6<827::aid-ijc6>3.0.co;2-p. [DOI] [PubMed] [Google Scholar]
- 3.Kurman RJ, Kaminski PF, Norris HJ. The behavior of endometrial hyperplasia: A long term study of “untreated” hyperplasia in 170 patients. Cancer. 1985;56:403–412. doi: 10.1002/1097-0142(19850715)56:2<403::aid-cncr2820560233>3.0.co;2-x. [DOI] [PubMed] [Google Scholar]
- 4.Mazur MT. Endometrial hyperplasia/adenocarcinoma. a conventional approach. Ann Diagn Pathol. 2005;9:174–181. doi: 10.1016/j.anndiagpath.2005.03.001. [DOI] [PubMed] [Google Scholar]
- 5.Mutter GL, Zaino RJ, Baak JP, Bentley RC, Robboy SJ. Benign endometrial hyperplasia sequence and endometrial intraepithelial neoplasia. Int J Gynecol Pathol. 2007;26:103–114. doi: 10.1097/PGP.0b013e31802e4696. [DOI] [PubMed] [Google Scholar]
- 6.Zaino RJ, Kauderer J, Trimble C, et al. Reproducibility of the diagnosis of atypical endometrial hyperplasia: a Gynecologic Oncology Group study. Cancer. 2006;106:804–811. doi: 10.1002/cncr.21649. [DOI] [PubMed] [Google Scholar]
- 7.Trimble CL, Kauderer J, Zaino R, et al. Concurrent endometrial carcinoma in women with a biopsy diagnosis of atypical endometrial hyperplasia: a Gynecologic Oncology Group study. Cancer. 2006;106:812–819. doi: 10.1002/cncr.21650. [DOI] [PubMed] [Google Scholar]
- 8.Dunton CJ, Baak JP, Palazzo JP, van Diest PJ, McHugh M, Widra EA. Use of computerized morphometric analyses of endometrial hyperplasias in the prediction of coexistent cancer. Am J Obstet Gynecol. 1996;174:1518–1521. doi: 10.1016/s0002-9378(96)70599-9. [DOI] [PubMed] [Google Scholar]
- 9.Garcia FA, Davis JR, Alberts DS, Liu Y, Thompson D, Bartels PH. A karyometric approach to the characterization of atypical endometrial hyperplasia with and without co-occurring adenocarcinoma. Anal Quant Cytol Histol. 2003;25:339–346. [PubMed] [Google Scholar]
- 10.Baak JP, Kurver PH, Overdiep SH, et al. Quantitative, microscopical computer-aided diagnosis of endometrial hyperplasia or carcinoma in individual patients. Histopathology. 1981;5:689–695. doi: 10.1111/j.1365-2559.1981.tb01835.x. [DOI] [PubMed] [Google Scholar]
- 11.Baak JP, Wisse-Brekelmans EC, Fleege JC, van der Putten HW, Bezemer PD. Assessment of the risk on endometrial cancer in hyperplasia, by means of morphological and morphometrical features. Path Res & Pract. 1992;288:856–859. doi: 10.1016/S0344-0338(11)80244-X. [DOI] [PubMed] [Google Scholar]
- 12.Geisler JP, Wiemann MC, Zhou Z, Miller GA, Geisler HE. A difference in nuclear morphometry when frozen rather than fresh tissue is studied. Eur J Gynaecol Oncol. 1997;18:471–473. [PubMed] [Google Scholar]
- 13.Orbo A, Baak JP. Computer-based morphometric image analysis of endometrial hyperplasia. Tidsskr Nor Laegeforen. 2000;120:496–499. [PubMed] [Google Scholar]
- 14.Orbo A, Baak JP, Kleivan I, et al. Computerised morphometrical analysis in endometrial hyperplasia for the prediction of cancer development. A long-term retrospective study from northern Norway. J Clin Pathol. 2000;53:697–703. doi: 10.1136/jcp.53.9.697. [DOI] [PMC free article] [PubMed] [Google Scholar]
- 15.Wied GL, Bartels PH, Bah GF, Reagan JW. TICAS assessment of cells from atypical hyperplasia of the endometrium. Acta Cytol. 1969;13:552–556. [PubMed] [Google Scholar]
- 16.Diegenbach PC, Baak JP. Quantitative nuclear image analysis: differentiation between normal, hyperplastic, and malignant appearing uterine glands in a paraffin section. III. The use of texture features for differentiation. Eur J Obstet Gynecol Reprod Biol. 1978;8:109–116. doi: 10.1016/0028-2243(78)90138-7. [DOI] [PubMed] [Google Scholar]
- 17.Garcia FA, Davis JR, Alberts DS, et al. Nuclear chromatin patterns in normal, hyperplastic and atypical endometrium. Anal Quant Cytol Histol. 2001;23:144–150. [PubMed] [Google Scholar]
- 18.Garcia FA, Davis JR, Hatch K, Alberts DS, Thompson D, Bartels PH. Karyometry in endometrial adenocarcinoma of different grades. Anal Quant Cytol Histol. 2002;24:93–102. [PubMed] [Google Scholar]
- 19.Bartels PH, Garcia FA, Davis J, et al. Progression curves for endometrial lesions. Anal Quant Cytol Histol. 2001;23:1–8. [PubMed] [Google Scholar]
- 20.Bartels PH, Ranger-Moore J, Alberts D, Hess L, Scarpelli M, Montironi R. Carcinogenesis and the hypothesis of phylogenetic reversion. Anal Quant Cytol Histol. 2006;28:243–252. [PubMed] [Google Scholar]
- 21.Alberts DS, Einspahr JG, Krouse RS, et al. Karyometry of the colonic mucosa. Cancer Epidemiol Biomarkers Prev. 2007;16:2704–2716. doi: 10.1158/1055-9965.EPI-07-0595. [DOI] [PubMed] [Google Scholar]
- 22.Bozzo P, Alberts DS, Vaught L, et al. Measurement of chemopreventive efficacy in skin biopsies. Anal Quant Cytol Histol. 2001;23:300–312. [PubMed] [Google Scholar]
- 23.Krouse R, Alberts DS, Prasad AR, et al. Progression of skin lesions from normal skin to squamous cell carcinoma. Anal Quant Cytol Histol. 2009;31:17–25. [PMC free article] [PubMed] [Google Scholar]
- 24.Bartels PH, Ranger-Moore J, Alberts D, et al. Carcinogenesis and the hypothesis of phylogenetic reversion. Anal Quant Cytol Histol. 2006;28:243–252. [PubMed] [Google Scholar]
- 25.Kruskal WH, Wallis WA. Use of ranks on one-criterion variance analysis. J Amer Stat Assoc. 1952;47:583–621. [Google Scholar]; Addendum. 1953;48:907–911. [Google Scholar]
- 26.Genchi H, Mori K. Evaluation and feature extraction on automatic pattern recognition system. Denki Tsuchin Gakkai Pari. 1965;1 in Japanese. [Google Scholar]
- 27.Bartels PH, Olson GB. Methods of Cell separation N Catsimpoolas. Vol. 3. New York: Plenum Press; 1980. Computer analysis of lymphocyte images; pp. 1–99. [Google Scholar]
- 28.Lachenbruch PA. Discriminant Analysis. New York: Hafner; 1975. [Google Scholar]
- 29.McClellan RP. Thesis. Dept. Electrical Engineering, University of Arizona; Tucson: 1971. Optimization and stochastic approximation techniques applied to unsupervised learning. [Google Scholar]
- 30.Beale EMI. Euclidean cluster analysis. Bull Int Stat Inst. 1969;43:21–43. [Google Scholar]
- 31.Mutter GI, Krauder J, Baak JPA, Alberts DS. Biopsy histomorphometry predicts uterine myoinvasion by endometrial carcinoma: A Gynecologic Oncology Group Study. Hum Pathol. 2008;39:866–874. doi: 10.1016/j.humpath.2007.09.023. [DOI] [PMC free article] [PubMed] [Google Scholar]
- 32.McKenney JK, Longacre TA. Low-grade endometrial adenocarcinoma A diagnostic algorithm for distinguishing atypical endometrial hyperplasia and other benign (and malignant) mimics. Adv Anat Pathol. 2009;16:1–22. doi: 10.1097/PAP.0b013e3181919e15. [DOI] [PubMed] [Google Scholar]