

Abstract
Purpose
To describe methods to harmonize the classification of age-related macular degeneration (AMD) phenotypes across four population-based cohort studies: the Beaver Dam Eye Study (BDES), Blue Mountains Eye Study (BMES), Los Angeles Latino Eye Study (LALES), and Rotterdam Study (RS).
Methods
AMD grading protocols, definitions of categories, and grading forms from each study were compared to determine whether there were systematic differences in AMD severity definitions and lesion categorization among the three grading centers. Each center graded the same set of 60 images using their respective systems to determine presence and severity of AMD lesions. A common five-step AMD severity scale and definitions of lesion measurement cutpoints and early and late AMD were developed from this exercise.
Results
Applying this severity scale changed the age-sex adjusted prevalence of early AMD from 18.7% to 20.3% in BDES, from 4.7% to 14.4% in BMES, from 14.1% to 15.8% in LALES, and from 7.5% to 17.1% in RS. Age-sex adjusted prevalences of late AMD remained unchanged. Comparison of each center’s grades of the 60 images converted to the consortium scale showed that exact agreement of AMD severity among centers varied from 61.0% to 81.4%, and one-step agreement varied from 84.7% to 98.3%.
Conclusion
Harmonization of AMD classification reduced categorical differences in phenotypic definitions across the studies, resulted in a new 5-step AMD severity scale, and enhanced similarity of AMD prevalence among four cohorts. Despite harmonization it may still be difficult to remove systematic differences in grading, if present.
Introduction
In epidemiologic studies, the power to detect associations of risk factors for infrequent outcomes is often low. Many investigators have sought to minimize this problem by pooling data from several studies or by performing meta-analyses. This approach has commonly been taken in discovering genetic associations and in examining the interactions of genetic, host, and environmental factors for age-related macular degeneration (AMD) and other ocular traits and diseases.1-8 Synchronization or harmonization of the disease phenotypes and risk factors/indicators might reduce heterogeneity secondary to methodological differences among studies.9,10
Data from the Beaver Dam Eye Study (BDES), the Blue Mountains Eye Study (BMES), and the Rotterdam Study (RS) were previously pooled to examine the relationships of risk factors to the prevalence and five-year incidence of late AMD.11-13 From this established collaboration, the Three Continent AMD Consortium, consisting of four large population-based studies (the BDES, the BMES, the Los Angeles Latino Eye Study [LALES], and the RS), was formed in 2009 to examine the effects of gene × environment and gene × host interactions on the incidence of early and late AMD and the progression of AMD. The purpose of this paper is to describe the methods used to harmonize the AMD phenotype and to define the resulting AMD severity scale for use in analyses of data from the four cohorts.
Materials and Methods
Brief Descriptions of Populations, Photography and Grading
The dates of the baseline and follow-up examinations, the number of participants at each examination, the number with gradable fundus photographs, the cameras used, the multistep grading procedures, and the definitions of early AMD used by each study are presented in Table 1. The cohorts and the methods used to examine them have been described in detail elsewhere (Figure 1 and Online Supplement parts A-L, available at http://informahealthcare.com/journal/ope).14-40 Approval for the BDES was granted by the Institutional Review Board at the University of Wisconsin. Ethics committee approval for the BMES was provided by the Western Sydney Area Health Service Human Research Ethics Committee. The LALES was approved by the University of Southern California Health Sciences Campus and Cedars-Sinai Medical Center Institutional Review Boards. The Medical Ethics Committee of the Erasmus Medical Center approved the RS. Informed consent was obtained from all participants and the tenets of the Declaration of Helsinki were observed by all four studies.
TABLE 1.
Characteristics of participating studies and their grading methods
| Study | Examination periods |
N participants (N with gradable photos*) |
Angle and camera type/model used |
Fields photographed |
Grading processes |
Definition of early AMD |
|---|---|---|---|---|---|---|
| BDES | 1988-1990 | 4926 (4778) | 30° film Zeiss FF4 | ETDRS 1,2 (stereo); modified 3 (nonstereo) |
Preliminary, Detail, Edit, Adjudication, Longitudinal Review |
Any drusen size or type in the presence of pigmentary abnormalities or soft indistinct drusen ≥125 μm diameter |
| 1993-1995 | 3722 (3556) | 30° film Zeiss FF4 | ||||
| 1998-2000 | 2962 (2831) | 30° film Zeiss FF4 | ||||
| 2003-2005 | 2375 (2260) | 30° film Zeiss FF4 | ||||
| 2008-2010 | 1913 (1790) | 30° film Zeiss FF4 | ||||
|
| ||||||
| BMES | 1992-1994 | 3654 (3583) | 30° film Zeiss FF3 | ETDRS 1,2 (stereo) and four other fields |
Detail, Longitudinal Review | Soft distinct drusen ≥125 μm diameter in the presence of pigmentary abnormalities or soft indistinct drusen ≥125 μm diameter |
| 1997-1999 | 2334 (2307) | 30° film Zeiss FF3 | ||||
| 2002-2004 | 1952 (1689) | 30° film Zeiss FF3 | ||||
| 2007-2010 | 1149 (1050) | 40° digital Canon CF-60 DSi and Canon EoS 1DS Mark II |
||||
|
| ||||||
| LALES | 2000-2003 | 6357 (5875) | 30° film Zeiss FF450+ | ETDRS 1,2 (stereo); modified 3 (nonstereo) |
Preliminary, Detail, Edit, Adjudication, Longitudinal Review |
Any drusen size or type in the presence of pigmentary abnormalities or soft indistinct drusen ≥125 μm diameter |
| 2004-2008 | 4658 (3908) | 30° film Zeiss FF450+ | ||||
| 2010-date | 30° digital Topcon TRC-50DX | |||||
|
| ||||||
| RS | 1989-1993 | 6780 (6405) | 35° film Topcon TRV-50VT | ETDRS 1, 2 (stereo) |
Detail, Longitudinal Review | Soft distinct drusen ≥63 μm diameter in the presence of pigmentary abnormalities or soft indistinct drusen ≥125 μm diameter |
| 1993-1995 | 6315 (4932) | 35° film Topcon TRV-50VT | ||||
| 1997-1999 | 4797 (3625) | 35° film Topcon TRV-50VT | ||||
| 2000-2004 | 3550 (2662) | 35° digital Topcon TRC 50EX and Sony DXC-950P |
||||
| 2009-2011 | 1658 (1447) | 35° digital Topcon TRC 50EX and Sony DXC-950P |
||||
AMD, age-related macular degeneration; BDES, Beaver Dam Eye Study; BMES, Blue Mountains Eye Study; ETDRS, Early Treatment of Diabetic Retinopathy Study; LALES, Los Angeles Latino Eye Study; RS, Rotterdam Study.
In at least one eye.
Figure 1.

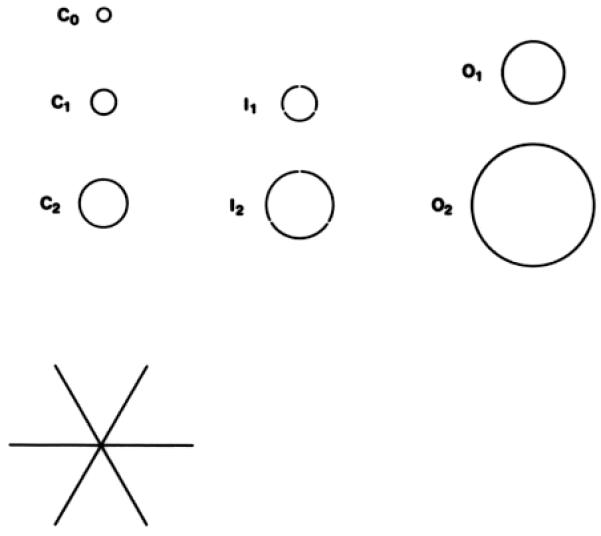
A. Grids defining the 9 macular subfields (not to scale). B. Measuring tools for lesion size and area of involvement (not to scale). Circles represent fractions of the total area of the center (C), inner (I), and outer (O) subfields of the grid in part A, and the 3 crossed lines each measure 1000 μm in length.22 CC, center circle; II, inner inferior; IN, inner nasal; IS, inner superior; IT, inner temporal; OI, outer inferior; ON, outer nasal; OS, outer superior; OT, outer temporal.
Grading Comparisons and Steps Used to Harmonize AMD Severity
In order to examine the comparability of AMD lesion grading protocols and definitions of AMD among the studies, grading forms, previous publications, and data dictionaries from each study were collected by the University of Wisconsin Ocular Epidemiology Group (UWOEG) which grades fundus photographs for BDES and LALES. We compared the conventions of the lesion-specific data assessed by each of the three grading centers (UWOEG, BMES grading team, RS grading team), i.e., whether the study graded early lesions in the presence of late AMD, how lesion locations in the macula were graded (globally or by subfield), and if there was agreement in the definitions of specific lesions and their severities as well as early and late AMD. The differences in grading protocols and the absence or presence of AMD lesions were discussed during regular teleconferences to determine whether there were systematic differences in lesion identification among the gradings performed at the three grading centers. Differences in the definitions of early and late AMD, approaches described in the grading protocols among the grading centers, and specific differences in categorizing lesions are presented in Tables 1 and 2. To ensure that each study used the same definitions for late AMD, senior investigators at each grading center (RK and BEKK of the UWOEG, PM and JJW of the BMES, JRV and CCWK of the RS) were provided with either film or digital copies of stereoscopic pairs of photographs of any eye that had been graded as having late AMD at any visit for review and discussion. Each senior investigative team independently reviewed these images and held teleconferences with the other teams to discuss disagreements in lesion classification until a consensus was reached for each case among all four studies.
TABLE 2.
Differences in grading among the four studies for specific age-related macular degeneration lesions
| Lesion | Differences | Resolution |
|---|---|---|
| Drusen Area | RS used % area in center/inner/outer rings of grid; BDES, BMES, and LALES used area within grid using μm2 cutpoints |
Reassigning drusen area in RS after application of mathematical algorithm based on regrading 60 eyes |
|
| ||
| Drusen Size/Type/Area, Pigmentary Abnormalities |
BMES did not grade in presence of late AMD | Analyses excluded eyes with late AMD |
|
| ||
| Intermediate Drusen | BMES categorized drusen 63 to 125 μm in diameter as intermediate size drusen while this was not a category in BDES, LALES, or RS |
Drusen type was not included in the AMD severity scale |
|
| ||
| Geographic Atrophy | Number of characteristics defining its presence varied | Used 2 characteristics (shape, edge definition, total absence of retinal pigment epithelium, and/or visibility of choroidal vessels) in addition to size |
BDES, Beaver Dam Eye Study; BMES, Blue Mountains Eye Study; LALES, Los Angeles Latino Eye Study; RS, Rotterdam Study.
To assess lesion-specific definitional differences among the three grading centers, the UWOEG digitized a set of stereoscopic images of 60 eyes with lesions characteristic of the range of severity of AMD selected from BDES participants, then reprinted the images on film and sent identical copies to the UWOEG, BMES, and RS grading teams. These images were graded twice, more than six months apart, by the UWOEG: one time using the BDES protocols and another time using the LALES protocols. The image set had a balanced distribution of lesion characteristics considered to be typical of AMD: varying drusen size, type, and area, increased retinal pigment, retinal pigment epithelium (RPE) depigmentation, geographic atrophy, RPE detachment/sensory serous retinal detachment, subretinal hemorrhage, or subretinal fibrous scars. The 60 images were graded independently by each center using their respective forms and approaches. Grading results were sent to the UWOEG to examine their comparability and evaluate reasons for disagreements in the gradings of the 60 eyes among the centers.
A spreadsheet was constructed with the specific AMD lesions (e.g., drusen size, type, and area, pigmentary abnormalities, geographic atrophy, exudative AMD) as well as the final severity scores of the 60 images graded by each of the centers. These data were used to create common definitions of the presence and absence of each lesion based on the common lesion cutpoints (e.g., drusen size >125 μm in diameter) across studies.
A Three Continent AMD Consortium severity scale was developed based on these harmonized cutpoints defining each early AMD lesion (Table 3). This scale allows for the common definitions of prevalence and incidence of AMD to be used in subsequent pooled data or meta-analyses conducted by the Consortium. The scale has five categories of AMD severity numbered from 10 to 50, where level 10 represents no AMD and level 50 represents late AMD. Levels 20, 30, and 40 represent mild, moderate, and severe stages of early AMD, respectively. An AMD severity scale score was assigned to each eye based on lesion severity as graded by each study’s grading protocol, i.e., each image had four grades, one from each study group.
TABLE 3.
Three Continent AMD Consortium age-related macular degeneration severity scale
| Level | Label | Description |
|---|---|---|
| 10 | No AMD | No, questionable, small, or intermediate sized drusen (<125 μm in diameter) only, regardless of area of involvement, and no pigmentary abnormalities (defined as increased retinal pigment or RPE depigmentation present) OR No definite drusen with any pigmentary abnormality. |
|
| ||
| 20 | Mild early AMD | Small to intermediate sized drusen (<125 μm in diameter), regardless of area of involvement, with any pigmentary abnormality OR Large drusen (≥125 μm in diameter) with drusen area <331,820 μm2 (equivalent to O-2 circle, defined as a circle with diameter of 650 μm) and no pigmentary abnormalities. |
|
| ||
| 30 | Moderate early AMD | Large drusen (≥125 μm in diameter) with drusen area <331,820 μm2 and any pigmentary abnormality OR Large drusen (≥125 μm in diameter) with drusen area ≥331,820 μm2, with or without increased retinal pigment but no RPE depigmentation. |
|
| ||
| 40 | Severe early AMD | Large drusen (≥125 μm in diameter) with drusen area ≥331,820 μm2 and RPE depigmentation present, with or without increased retinal pigment. |
|
| ||
| 50 | Late AMD | Pure geographic atrophy in the absence of exudative macular degeneration OR Exudative macular degeneration with or without geographic atrophy present. |
AMD, age-related macular degeneration; RPE, retinal pigment epithelium.
To evaluate grader variability, we then compared the consortium scale score assigned based on each study’s grading scheme to the score that was assigned based on each of the other studies’ grading schemes. Weighted kappa statistics were calculated using the Fleiss-Cohen weighting method,41 which was also used by the Age-Related Eye Diseases Study for grading quality control comparisons.42 Using the new harmonized definitions, the age-sex adjusted prevalence of each AMD global lesion, and early and late AMD, were compared to the original AMD prevalence estimates reported by each study, based on their previous definitions. Age was categorized as <55 years, 55-64 years, 65-74 years and ≥75 years and the proportion of participants in each age-sex category was used to weight the age-sex adjusted prevalence rates.
Results
Differences among Grading Conventions
The differences among the studies’ grading conventions for early AMD lesions are summarized in Table 2.
Drusen Size
The RS graded drusen size at the first three visits using the same conventions as the other studies, but was the only study to discard this variable at the fourth and fifth visits. Drusen size in RS was therefore defined by type (hard/soft <125 μm diameter and soft distinct/indistinct ≥125 μm diameter). In order to construct a consistent drusen size variable that would be consistent for all four studies at all visits, we selected 125 μm as the cutpoint for presence/absence of large drusen. The drusen size variable used in all consortium analyses has three levels: no drusen, drusen with diameter <125 μm, or drusen with diameter ≥125 μm. These cutpoints were then used to define drusen size for each cohort in all phases of the study.
Drusen Area
The RS graded drusen area as the percentage of the center, inner, or outer rings of the grid involving drusen while the other studies graded the area of drusen within the grid using square micrometer cutpoints (<125 μm2, <250 μm2, <350 μm2, <650 μm2, <1/2 disc area (DA), ≥1/2 DA). To resolve this difference, the RS was asked to regrade drusen area in the 60 sample eyes using the same cutpoints as used by the other studies. Based on the results of these gradings, the RS developed a mathematical algorithm which added the center, inner, and outer values together to assign a drusen area value in μm2 to each eye based on the percent involvement cutpoint used in the RS grading system.
Algorithm used in RS
Drusen area (%) was graded in the RS for the central circle, inner circle and outer circle for each eye separately. To assign a drusen area per eye in μm2 we calculated the affected area in each circle using the formula for the area of a circle (= π × r2).
We then multiplied the percent drusen area by the area of the corresponding circle.
Omissions
The BMES did not grade drusen and pigmentary abnormalities if an eye had signs of late AMD while the other two grading centers did grade drusen and pigmentary abnormalities irrespective of the presence of other lesions. In the harmonization process the analysts agreed to exclude eyes with late AMD from consortium meta-analyses of drusen or pigmentary abnormalities.
Drusen Type
The BMES labeled drusen with a diameter between 63 μm and 125 μm as intermediate drusen, while the other studies did not use a comparable intermediate drusen descriptor. This difference was resolved by not including drusen type as part of the Consortium AMD severity scale definition.
Lesion Characteristics
There were differences among the grading centers in definitions for geographic atrophy, e.g., sharp edge, lack of RPE, visible choroidal vessels, and circular shape, and for the minimum size required to grade a lesion as being pure geographic atrophy. These differences were resolved by defining the presence of geographic atrophy as an area of RPE atrophy greater than or equal to that of a circle 350 μm in diameter, and presence of at least two of the defining characteristics described above.
Presence and Severity of AMD Categories
The presence and severity of early AMD was defined differently by each study using the AMD severity scale developed from their individual study’s grading scheme. In the BDES, early AMD was defined as presence of definite drusen of any size along with pigmentary abnormalities (Table 1). However, the RS required that drusen be at least 63 μm in diameter and the BMES at least 125 μm in diameter, combined with the presence of pigmentary abnormalities, to be graded as early AMD. For example, an eye with hard distinct drusen <63 μm in diameter and a pigmentary abnormality would be classified as not having early AMD by the BMES and RS but as having early AMD by the BDES. This difference would be expected to lead to a lower prevalence of early AMD in the BMES and RS compared to the BDES. The levels of severity of early AMD also differed in scales in which drusen area was used to define early AMD (Online Supplement sections E, G, and L). To resolve these differences, mild early AMD cases that were originally included as early AMD in the BDES and the LALES but as no AMD in the BMES or RS were coded as level 20 on the harmonized scale.
Harmonized Lesion Definitions and Grading Scale
Harmonized consortium definitions of the presence and absence of AMD lesions were agreed upon (Table 4) and used to develop a 5-step AMD consortium severity scale (Table 3). A single “worse eye” summary variable was created for each participant for both the AMD level and each individual lesion. All the studies agreed to use these person-level “worse eye” variables as the phenotype in all analyses. When a lesion or AMD severity level was ungradable in one eye it was assumed to have the same severity as the fellow eye. If any lesion used in defining the AMD scale was ungradable in both eyes, then the individual was not assigned an AMD consortium scale score. A participant with any particular lesion ungradable would still be considered for analyses for any other individual lesions that were gradable.
TABLE 4.
Definitions of age-related macular degeneration lesions used globally across all four studies
| Lesion | Global Definition |
|---|---|
| Large drusen size | ≥ 125 pm in diameter |
|
| |
| Large drusen area | ≥ 650 pm in diameter |
|
| |
| Increased pigment | Any AMD related increased pigment |
|
| |
| RPE depigmentation | Any AMD related RPE depigmentation |
|
| |
| Geographic atrophy | Area of atrophy ≥350 μm in diameter and presence of at least 2 of these features: sharp edge, lack of RPE, visible choroidal vessels, and circular shape |
|
| |
| Exudative AMD | Presence of any of the following: pigment epithelial detachment and/or retinal detachment, subretinal hemorrhage, subretinal scar, subretinal new vessels, treatment for exudative lesion |
AMD, age-related macular degeneration; RPE, retinal pigment epithelium.
We were able to assign a consortium scale score to 59 out of the 60 sample eyes graded using the BMES protocol; however, one eye was determined by the BMES grading center to have ungradable drusen size, type, and area. We were able to assign a consortium scale score to all 60 eyes graded using the BDES, LALES, and RS protocols (i.e., no lesions were determined to be ungradable in any of the test eyes).
Using the new harmonized Three Continent AMD Consortium severity scale, the exact grading agreement of the 60 eyes between centers varied from 61.0% between the BMES versus RS and RS versus LALES to 81.4% between the BMES and the LALES, and the within-one-step agreement varied from 84.7% between the RS and LALES to 98.3% between the BMES and the BDES (Figure 2). Weighted kappa scores varied from 0.66 to 0.86, indicating moderate to substantial levels of agreement among the grading centers.
Figure 2.

Agreement between each pair of grading centers for grading of age-related macular degeneration using the Three Continent AMD Consortium Age-Related Macular Degeneration Severity Scale after harmonization. A. Beaver Dam Eye Study (BDES) vs. Blue Mountains Eye Study (BMES); B. BDES vs. Rotterdam Study (RS); C. BMES vs. RS; D. BDES vs. Los Angeles Latino Eye Study (LALES); E. BMES vs. LALES; F. RS vs. LALES. CG, cannot grade; CI, confidence interval.
Comparisons of new and previous estimates of the prevalence of early and late AMD in each study population are presented in Table 5. The prevalence of early AMD in each of the four studies had greater similarity among themselves using the harmonized definition than for each study’s original definition. The largest changes in prevalence reflect changes in the cutpoints for drusen size and area after harmonization. As expected, the prevalence of late AMD did not change (Table 5).
TABLE 5.
The age-sex adjusted prevalence of early and late age-related macular degeneration in the four cohorts using the individual three grading center original definitions and the Three Continent AMD Consortium global definition
| BDES | BMES | RS | LALES | |||||
|---|---|---|---|---|---|---|---|---|
|
|
||||||||
| Lesion/Level | Original Definition % |
Consortium Definition % |
Original Definition % |
Consortium Definition % |
Original Definition % |
Consortium Definition % |
Original Definition % |
Consortium Definition % |
| Early AMD | 18.7 | 20.3 | 4.0 | 12.8 | 7.6 | 17.4 | 14.1 | 15.8 |
| Large drusen | 15.9 | 15.8 | 5.4 | 5.4 | 8.9 | 12.9 | 14.8 | 14.8 |
| Large drusen area | 6.7 | 4.0 | NA | 7.4 | NA | 10.6 | 3.0 | 3.0 |
| Increased retinal pigment | 12.4 | 12.4 | 9.1 | 9.1 | 7.5 | 7.5 | 4.7 | 4.7 |
| RPE depigmentation | 7.3 | 7.3 | 5.6 | 5.6 | 7.2 | 7.2 | 1.9 | 1.9 |
| Late AMD | 1.8 | 1.8 | 1.8 | 1.8 | 1.6 | 1.6 | 0.2 | 0.3 |
| Geographic atrophy | 0.6 | 0.6 | 0.6 | 0.6 | 0.7 | 0.7 | 0.2 | 0.2 |
| Neovascular AMD | 1.2 | 1.2 | 1.2 | 1.2 | 1.0 | 1.0 | 0.1 | 0.1 |
AMD, age-related macular degeneration; BDES, Beaver Dam Eye Study; BMES, Blue Mountains Eye Study; LALES, Los Angeles Latino Eye Study; NA, not applicable; RPE, retinal pigment epithelium; RS, Rotterdam Study.
Discussion
The Three Continent AMD Consortium, consisting of four large population-based cohorts totaling 20,655 persons at baseline examinations with gradable fundus photographs for AMD in at least one eye and varying follow-up periods from approximately 8 to 20 years, was formed to examine genetic and environmental interactions in relation to the incidence of AMD. When the three grading centers began, each study used modifications of the Wisconsin Age-Related Maculopathy Grading System to grade and define lesions of AMD. Those modifications led to several systematic differences in the way the photographs were graded as well as in the criteria to classify early AMD. There were differences in prevalence of early AMD across the studies that were hypothesized to be due, at least in part, to those grading/classification differences. These differences made harmonizing AMD phenotypes across the studies essential for collaborative research projects. We defined common lesion thresholds across the studies, which resulted in an AMD scale that differs somewhat from previous schemes used by our groups and others. Our harmonization effort resulted in more comparable estimates of the prevalence of early AMD in our studies (Table 5). While the harmonization is assumed to have reduced the variability among the studies and to have increased study power for pooled data and meta-analyses to detect associations, there are no data or examples available yet to support this assumption.
Harmonization of the classification by changing definitions can reduce some differences in phenotypes among different study cohorts. However, it does not change differences in the estimated prevalence of specific lesions; we believe that some of these differences arise from systematic variation in the image quality, the grading process itself, and other specifics of examination procedures (e.g., methods of capturing and assessing AMD such as cameras, graders, grading protocols, number of gradings, edits, and adjudication)43 although we cannot rule out the possibility of true differences among the studies arising from true differences in prevalence of lesions.
A limitation of the harmonization process is that any eye with late AMD not identified as such by the original cohort was not discussed amongst the investigators of these studies. Nevertheless, all four cohorts followed up with participants more than once, and because of the longitudinal review processes in place for each study would likely result in the detection of late AMD cases missed at a given visit at subsequent visits. We therefore expect that the number of late AMD cases missed would be very small and that those missed would most likely be individuals who died before follow-up or did not return for follow-up visits.
Misclassification of pure geographic atrophy may occur because only color images were used to identify exudative AMD and small RPE detachments may occur and collapse, leaving only atrophic lesions during the relatively long time interval between two visits. Because the time intervals were similar and RPE detachments were treated similarly among the studies, we do not think this resulted in systematic differences in their estimates of the prevalence of the two types of late AMD, exudative and pure geographic atrophy.
Conclusions
The harmonization provided an opportunity to reduce categorical differences in the estimates of early AMD and early AMD lesions with the goal of reducing variability in AMD phenotype definitions prior to data pooling and/or meta-analyses. This process will likely increase the power to detect genetic, host, and environmental risk factors, especially as we aim to use meta-analyses or pool data from multiple studies. Harmonization is, of course, a post-hoc attempt to achieve consistency of disease detection and classification. While not perfect compared to the use of the same techniques in identifying affected and non-affected subjects, it is a practical approach to decreasing phenotypic heterogeneity across studies. Because early AMD can be defined differently by different studies, absence of harmonization may lead to a failure to detect associations of risk factors in pooled or meta-analyses. If early AMD is to be used as an endpoint in analyses requiring data from multiple studies, harmonization is strongly recommended.
Supplementary Material
Acknowledgment
A full list of members of the Three Continent AMD Consortium appears in the Online Supplement, part M, available at http://informahealthcare.com/journal/ope.
Financial Support: The Beaver Dam Eye Study was supported by National Institutes of Health grant EY06594 (BEK Klein and R Klein) and, in part, by an unrestricted grant from Research to Prevent Blindness, New York, NY. The National Eye Institute provided funding for entire study including collection and analyses of data; RPB provided additional support for data analyses. The Blue Mountains Eye Study was supported by grants 974159, 211069, 457349, and 512423 from the National Health & Medical Research Council, Canberra, Australia. The Rotterdam Study is supported by Stichting Lijf en Leven, Krimpen aan de Lek; MD Fonds, Utrecht; Rotterdamse Vereniging Blindenbelangen, Rotterdam; Stichting Oogfonds Nederland, Utrecht; Blindenpenning, Amsterdam; Blindenhulp, The Hague; Algemene Nederlandse Vereniging ter Voorkoming van Blindheid (ANVVB), Doorn; Landelijke Stichting voor Blinden en Slechtzienden, Utrecht; Swart van Essen, Rotterdam; Stichting Winckel-Sweep, Utrecht; Henkes Stichting, Rotterdam; Laméris Ootech BV, Nieuwegein; Medical Workshop, de Meern; Topcon Europe BV, Capelle aan de IJssel, all in the Netherlands, and Heidelberg Engineering, Dossenheim, Germany. The Los Angeles Latino Eye Study was supported by the National Institutes of Health grants EY11753 and EY03040, an unrestricted grant from Research to Prevent Blindness, New York, NY, and Pfizer, Inc.
Footnotes
Proprietary Interests/Conflicts of Interest: None of the authors have any proprietary interests or conflicts of interest related to this submission.
Online Only Material: This article contains online-only material. The following should appear online-only: Online Supplement parts A-M.
References
- 1.Priya RR, Chew EY, Swaroop A. Genetic studies of age-related macular degeneration: lessons, challenges, and opportunities for disease management. Ophthalmology. 2012;119(12):2526–2536. doi: 10.1016/j.ophtha.2012.06.042. [DOI] [PMC free article] [PubMed] [Google Scholar]
- 2.Sivakumaran TA, Igo RP, Jr., Kidd JM, Itsara A, Kopplin LJ, Chen W, et al. A 32 kb critical region excluding Y402H in CFH mediates risk for age-related macular degeneration. PLoS One. 2011;6(10):e25598. doi: 10.1371/journal.pone.0025598. [DOI] [PMC free article] [PubMed] [Google Scholar]
- 3.Chen Y, Zeng J, Zhao C, Wang K, Trood E, Buehler J, et al. Assessing susceptibility to age-related macular degeneration with genetic markers and environmental factors. Arch Ophthalmol. 2011;129(3):344–351. doi: 10.1001/archophthalmol.2011.10. [DOI] [PMC free article] [PubMed] [Google Scholar]
- 4.McKay GJ, Patterson CC, Chakravarthy U, Dasari S, Klaver CC, Vingerling JR, et al. Evidence of association of APOE with age-related macular degeneration: a pooled analysis of 15 studies. Hum Mutat. 2011;32(12):1407–1416. doi: 10.1002/humu.21577. [DOI] [PMC free article] [PubMed] [Google Scholar]
- 5.Fan Q, Barathi VA, Cheng CY, Zhou X, Meguro A, Nakata I, et al. Genetic variants on chromosome 1q41 influence ocular axial length and high myopia. PLoS Genet. 2012;8(6):e1002753. doi: 10.1371/journal.pgen.1002753. [DOI] [PMC free article] [PubMed] [Google Scholar]
- 6.Fritsche LG, Chen W, Schu M, Yaspan BL, Yu Y, Thorleifsson G, et al. Seven new loci associated with age-related macular degeneration. Nat Genet. 2013;45(4):433–2. doi: 10.1038/ng.2578. [DOI] [PMC free article] [PubMed] [Google Scholar]
- 7.Sim X, Jensen RA, Ikram MK, Cotch MF, Li X, Macgregor S, et al. Genetic Loci for retinal arteriolar microcirculation. PLoS One. 2013;8(6):e65804. doi: 10.1371/journal.pone.0065804. [DOI] [PMC free article] [PubMed] [Google Scholar]
- 8.Verhoeven VJ, Hysi PG, Wojciechowski R, Fan Q, Guggenheim JA, Hohn R, et al. Genome-wide meta-analyses of multiancestry cohorts identify multiple new susceptibility loci for refractive error and myopia. Nat Genet. 2013;45(3):314–318. doi: 10.1038/ng.2554. [DOI] [PMC free article] [PubMed] [Google Scholar]
- 9.de Bakker PI, Neale BM, Daly MJ. Meta-analysis of genome-wide association studies. Cold Spring Harb Protoc. 2010;2010(6) doi: 10.1101/pdb.top81. pdb.top81. [DOI] [PubMed] [Google Scholar]
- 10.Cornelis MC, Agrawal A, Cole JW, Hansel NN, Barnes KC, Beaty TH, et al. The Gene, Environment Association Studies consortium (GENEVA): maximizing the knowledge obtained from GWAS by collaboration across studies of multiple conditions. Genet Epidemiol. 2010;34(4):364–372. doi: 10.1002/gepi.20492. [DOI] [PMC free article] [PubMed] [Google Scholar]
- 11.Tomany SC, Wang JJ, van Leeuwen R, Klein R, Mitchell P, Vingerling JR, et al. Risk factors for incident age-related macular degeneration: pooled findings from 3 continents. Ophthalmology. 2004;111(7):1280–1287. doi: 10.1016/j.ophtha.2003.11.010. [DOI] [PubMed] [Google Scholar]
- 12.van Leeuwen R, Tomany SC, Wang JJ, Klein R, Mitchell P, Hofman A, et al. Is medication use associated with the incidence of early age-related maculopathy? Pooled findings from 3 continents. Ophthalmology. 2004;111(6):1169–1175. doi: 10.1016/j.ophtha.2003.10.024. [DOI] [PubMed] [Google Scholar]
- 13.Smith W, Assink J, Klein R, Mitchell P, Klaver CC, Klein BE, et al. Risk factors for age-related macular degeneration: Pooled findings from three continents. Ophthalmology. 2001;108(4):697–704. doi: 10.1016/s0161-6420(00)00580-7. [DOI] [PubMed] [Google Scholar]
- 14.Linton KL, Klein BE, Klein R. The validity of self-reported and surrogate-reported cataract and age-related macular degeneration in the Beaver Dam Eye Study. Am J Epidemiol. 1991;134(12):1438–1446. doi: 10.1093/oxfordjournals.aje.a116049. [DOI] [PubMed] [Google Scholar]
- 15.Klein R, Klein BE, Linton KL, DeMets DL. The Beaver Dam Eye Study: visual acuity. Ophthalmology. 1991;98(8):1310–1315. doi: 10.1016/s0161-6420(91)32137-7. [DOI] [PubMed] [Google Scholar]
- 16.Klein R, Klein BE, Lee KE. Changes in visual acuity in a population. The Beaver Dam Eye Study. Ophthalmology. 1996;103(8):1169–1178. doi: 10.1016/s0161-6420(96)30526-5. [DOI] [PubMed] [Google Scholar]
- 17.Klein R, Klein BE, Lee KE, Cruickshanks KJ, Chappell RJ. Changes in visual acuity in a population over a 10-year period: The Beaver Dam Eye Study. Ophthalmology. 2001;108(10):1757–1766. doi: 10.1016/s0161-6420(01)00769-2. [DOI] [PubMed] [Google Scholar]
- 18.Klein R, Klein BE, Lee KE, Cruickshanks KJ, Gangnon RE. Changes in visual acuity in a population over a 15-year period: the Beaver Dam Eye Study. Am J Ophthalmol. 2006;142(4):539–549. doi: 10.1016/j.ajo.2006.06.015. [DOI] [PubMed] [Google Scholar]
- 19.Klein R, Lee KE, Gangnon RE, Klein BE. Incidence of visual impairment over a 20-year period: the Beaver Dam Eye Study. Ophthalmology. 2013;120(6):1210–1219. doi: 10.1016/j.ophtha.2012.11.041. [DOI] [PMC free article] [PubMed] [Google Scholar]
- 20.Klein R, Davis MD, Magli YL, Segal P, Klein BE, Hubbard L. The Wisconsin Age-Related Maculopathy Grading System. Ophthalmology. 1991;98(7):1128–1134. doi: 10.1016/s0161-6420(91)32186-9. [DOI] [PubMed] [Google Scholar]
- 21.Klein R, Davis MD, Magli YL, Segal P, Klein BE, Hubbard L. The Wisconsin Age-Related Maculopathy Grading System. National Technical Information Service; Springfield, VA: Jul, 1991. Report No.: PB91-184267. [DOI] [PubMed] [Google Scholar]
- 22.Klein R, Klein BE. Manual of Operations, Revised. National Technical Information Service; Springfield, VA: 1991. The Beaver Dam Eye Study. Report No.: PB91-149823. [Google Scholar]
- 23.Klein R, Klein BE, Linton KL. Prevalence of age-related maculopathy. The Beaver Dam Eye Study. Ophthalmology. 1992;99(6):933–943. doi: 10.1016/s0161-6420(92)31871-8. [DOI] [PubMed] [Google Scholar]
- 24.Klein R, Klein BE, Jensen SC, Meuer SM. The five-year incidence and progression of age-related maculopathy: The Beaver Dam Eye Study. Ophthalmology. 1997;104(1):7–21. doi: 10.1016/s0161-6420(97)30368-6. [DOI] [PubMed] [Google Scholar]
- 25.Klein R, Klein BE, Tomany SC, Meuer SM, Huang GH. Ten-year incidence and progression of age-related maculopathy: The Beaver Dam Eye Study. Ophthalmology. 2002;109(10):1767–1779. doi: 10.1016/s0161-6420(02)01146-6. [DOI] [PubMed] [Google Scholar]
- 26.Klein R, Klein BE, Knudtson MD, Meuer SM, Swift M, Gangnon RE. Fifteen-year cumulative incidence of age-related macular degeneration: the Beaver Dam Eye Study. Ophthalmology. 2007;114(2):253–262. doi: 10.1016/j.ophtha.2006.10.040. [DOI] [PubMed] [Google Scholar]
- 27.Klein R, Myers CE, Meuer SM, Gangnon RE, Sivakumaran TA, Iyengar SK, et al. Risk alleles in CFH and ARMS2 and the long term natural history of age-related macular degeneration. The Beaver Dam Eye Study. JAMA Ophthalmol. 2013;131(3):383–392. doi: 10.1001/jamaophthalmol.2013.713. [DOI] [PMC free article] [PubMed] [Google Scholar]
- 28.Klein R, Klein BE, Moss SE. Relation of smoking to the incidence of age-related maculopathy. The Beaver Dam Eye Study. Am J Epidemiol. 1998;147(2):103–110. doi: 10.1093/oxfordjournals.aje.a009421. [DOI] [PubMed] [Google Scholar]
- 29.Mitchell P, Smith W, Attebo K, Wang JJ. Prevalence of age-related maculopathy in Australia. The Blue Mountains Eye Study. Ophthalmology. 1995;102(10):1450–1460. doi: 10.1016/s0161-6420(95)30846-9. [DOI] [PubMed] [Google Scholar]
- 30.Mitchell P, Wang JJ, Foran S, Smith W. Five-year incidence of age-related maculopathy lesions: the Blue Mountains Eye Study. Ophthalmology. 2002;109(6):1092–1097. doi: 10.1016/s0161-6420(02)01055-2. [DOI] [PubMed] [Google Scholar]
- 31.Wang JJ, Rochtchina E, Lee AJ, Chia EM, Smith W, Cumming RG, et al. Ten-year incidence and progression of age-related maculopathy: the blue Mountains Eye Study. Ophthalmology. 2007;114(1):92–98. doi: 10.1016/j.ophtha.2006.07.017. [DOI] [PubMed] [Google Scholar]
- 32.Bird AC, Bressler NM, Bressler SB, Chisholm IH, Coscas G, Davis MD, et al. The International ARM Epidemiological Study Group An international classification and grading system for age-related maculopathy and age-related macular degeneration. Surv Ophthalmol. 1995;39(5):367–374. doi: 10.1016/s0039-6257(05)80092-x. [DOI] [PubMed] [Google Scholar]
- 33.Varma R, Paz SH, Azen SP, Klein R, Globe D, Torres M, et al. The Los Angeles Latino Eye Study: design, methods, and baseline data. Ophthalmology. 2004;111(6):1121–1131. doi: 10.1016/j.ophtha.2004.02.001. [DOI] [PubMed] [Google Scholar]
- 34.Varma R, Fraser-Bell S, Tan S, Klein R, Azen SP. Prevalence of age-related macular degeneration in Latinos: the Los Angeles Latino Eye Study. Ophthalmology. 2004;111(7):1288–1297. doi: 10.1016/j.ophtha.2004.01.023. [DOI] [PubMed] [Google Scholar]
- 35.McKean-Cowdin R, Varma R, Hays RD, Wu J, Choudhury F, Azen SP. Longitudinal changes in visual acuity and health-related quality of life: the Los Angeles Latino Eye study. Ophthalmology. 2010;117(10):1900–1907. 1907.e1. doi: 10.1016/j.ophtha.2010.01.059. [DOI] [PMC free article] [PubMed] [Google Scholar]
- 36.Davis MD, Gangnon RE, Lee LY, Hubbard LD, Klein BE, Klein R, et al. The Age-Related Eye Disease Study severity scale for age-related macular degeneration: AREDS Report No. 17. Arch Ophthalmol. 2005;123(11):1484–1498. doi: 10.1001/archopht.123.11.1484. [DOI] [PMC free article] [PubMed] [Google Scholar]
- 37.Hofman A, van Duijn CM, Franco OH, Ikram MA, Janssen HL, Klaver CC, et al. The Rotterdam Study: 2012 objectives and design update. Eur J Epidemiol. 2011;26(8):657–686. doi: 10.1007/s10654-011-9610-5. [DOI] [PMC free article] [PubMed] [Google Scholar]
- 38.Vingerling JR, Dielemans I, Hofman A, Grobbee DE, Hijmering M, Kramer CF, et al. The prevalence of age-related maculopathy in the Rotterdam Study. Ophthalmology. 1995;102(2):205–210. doi: 10.1016/s0161-6420(95)31034-2. [DOI] [PubMed] [Google Scholar]
- 39.Klaver CC, Assink JJ, Van LR, Wolfs RC, Vingerling JR, Stijnen T, et al. Incidence and progression rates of age-related maculopathy: the Rotterdam Study. Invest Ophthalmol Vis Sci. 2001;42(10):2237–2241. [PubMed] [Google Scholar]
- 40.van Leeuwen R, Klaver CC, Vingerling JR, Hofman A, de Jong PT. The risk and natural course of age-related maculopathy: follow-up at 6 1/2 years in the Rotterdam study. Arch Ophthalmol. 2003;121(4):519–526. doi: 10.1001/archopht.121.4.519. [DOI] [PubMed] [Google Scholar]
- 41.Fleiss JL, Cohen J. The equivalence of weighted kappa and the intraclass correlation coefficient as measures of reliability. Educ Psychol Meas. 2012;33:613–619. [Google Scholar]
- 42.Chew EY, Kim J, Sperduto RD, Datiles MB, III, Coleman HR, Thompson DJ, et al. Evaluation of the age-related eye disease study clinical lens grading system AREDS report No. 31. Ophthalmology. 2010;117(11):2112–2119. doi: 10.1016/j.ophtha.2010.02.033. [DOI] [PMC free article] [PubMed] [Google Scholar]
- 43.Milton RC, Ganley JP, Lynk RH. Variability in grading diabetic retinopathy from stereo fundus photographs: comparison of physician and lay readers. Br J Ophthalmol. 1977;61(3):192–201. doi: 10.1136/bjo.61.3.192. [DOI] [PMC free article] [PubMed] [Google Scholar]
Associated Data
This section collects any data citations, data availability statements, or supplementary materials included in this article.