

Abstract
Fluoxetine and its circulating metabolite norfluoxetine present a complex multiple inhibitor system that causes reversible or time-dependent inhibition of CYP2D6, CYP3A4, and CYP2C19 in vitro. While significant inhibition of all three enzymes in vivo is predicted, midazolam and lovastatin AUCs were unaffected by two week dosing of fluoxetine whereas dextromethorphan AUC was increased by 27-fold and omeprazole AUC by 7.1-fold. This observed discrepancy between in vitro risk assessment and in vivo DDI profile was rationalized by time-varying dynamic pharmacokinetic models that incorporated circulating concentrations of fluoxetine and norfluoxetine enantiomers, mutual inhibitor-inhibitor interactions and CYP3A4 induction. The dynamic models predicted all DDIs with less than 2-fold error. This study demonstrates that complex drug-drug interactions that involve multiple mechanisms, pathways and inhibitors with their metabolites can be predicted and rationalized via characterization of all the inhibitory species in vitro.
INTRODUCTION
Complex drug-drug interactions (DDIs) may arise from co-administration of multiple inhibitors (including racemic mixtures), presence of inhibitory metabolites, occurrence of multiple inhibition mechanisms and inhibition of multiple enzymes and/or transporters. While complex DDIs are relatively common, they present significant challenges to identification, prediction and rationalization of clinically important DDIs. For example, interactions arising from multiple inhibitors with different mechanisms of inhibition may affect observed DDI magnitude. Further, simultaneous inhibition of multiple enzymes can increase the observed in vivo DDIs. Consequently, detailed characterization and accurate in vitro-to-in vivo extrapolation of complex DDIs is challenging, and only a limited number of studies have evaluated simulation and prediction of complex DDIs with multiple inhibitors and inhibition mechanisms.
Chronic fluoxetine administration creates a model complex inhibition system, where a mixture of four inhibitors, the two stereoisomers of fluoxetine together with the corresponding norfluoxetine metabolites circulate with nonlinear and stereoselective pharmacokinetics (1, 2). Fluoxetine and norfluoxetine enantiomers are reversible and time-dependent inhibitors of multiple P450s in vitro (3, 4) and fluoxetine is predicted to cause strong inhibition of CYP2D6 and CYP2C19, and at least moderate inhibition of CYP3A4 in vivo(3). However, existing in vivo data shows a striking discrepancy with these predictions. In vivo, fluoxetine is a strong CYP2D6 inhibitor (7.8-fold increase in desipramine AUC) (5) and a moderate CYP2C19 inhibitor (2.9-fold increase in lansoprazole AUC) (6). However, the magnitude of CYP3A4 inhibition is unclear. Multiple dose fluoxetine increased alprazolam and carbamazepine AUC 1.3-fold (7, 8) but had no effect on midazolam AUC (9). Overall, prediction accuracy of fluoxetine DDIs appears to be P450- and probe-dependent. This could be due to variable fluoxetine and norfluoxetine exposures between studies resulting from different dosing regimens and nonlinear pharmacokinetics (10) or unappreciated diverse inhibition mechanisms and probe-specific factors. The aim of this study was to determine whether the simultaneous interactions with CYP2D6, CYP2C19 and CYP3A4 resulting from multiple mechanisms and interacting species related to multiple dosing of fluoxetine could be predicted. A novel dynamic simulation setup that accounts for mutual interactions between all inhibitors was used for the in vitro to in vivo extrapolation and validated by comparison to the clinical study results.
RESULTS
Parent (R)- and (S)-fluoxetine as well as (R)- and (S)-norfluoxetine metabolites were found to be high affinity reversible inhibitors of CYP2D6 (Table 2) with the (S)-enantiomers approximately 10-fold more potent than the (R)-enantiomers. Calculated unbound [I]/Ki ratios (0.3 for (R)-fluoxetine, 5.8 for (S)-fluoxetine, 0.4 for (R)-norfluoxetine and 4.5 for (S)-norfluoxetine) predicted a significant decrease in CYP2D6 activity following fluoxetine administration. (S)-fluoxetine and (S)-norfluoxetine were predicted to account for ~90% of the in vivo CYP2D6 inhibition (approximately 50% and 40%, respectively). The risk of irreversible inhibition of CYP2C19 and CYP3A4 was predicted using unbound λ/kdeg ratios (15 for (R)-fluoxetine, 4 for (S)-fluoxetine, 7 for (R)-norfluoxetine and 17 for (S)-norfluoxetine towards CYP2C19 and 1.7 for (S)-fluoxetine and 3 (R)-norfluoxetine towards CYP3A4), which suggested a significant decrease in in vivo CYP2C19 and CYP3A4 activity due almost entirely to irreversible inhibition. Based on the λ/kdeg values (R)-fluoxetine and (S)-norfluoxetine contribute the most to in vivo CYP2C19 inhibition whereas (S)-fluoxetine and (R)-norfluoxetine cause CYP3A4 inhibition. Unbound [I]/IC50 values (0.01–0.1) predict little reversible inhibition of CYP2C19 and CYP3A4 in vivo. Taken together these [I]/Ki and λ/kdeg values warrant an in vivo DDI study for simultaneous CYP3A4, CYP2D6 and CYP2C19 inhibition to determine the true DDI risk following fluoxetine dosing.
Table 2.
Summary of drug specific parameters used for simulations
| (R)-fluoxetine | (R)-norfluoxetine | (S)-fluoxetine | (S)-norfluoxetine | Omeprazole | Dextromethorphan | Midazolam | ||
|---|---|---|---|---|---|---|---|---|
| MW | 309.2 | 294.2 | 309.2 | 294.2 | 345.4 | 271.4 | 325.8 | |
| LogP | 3.9 | 3.8 | 3.9 | 3.8 | 2.23 | 3.8 | 3.53 | |
| pKa 1 | 10 | 9 | 10 | 9 | 8.7 | 8.3 | 10.95 | |
| pKa 2 | - | - | - | - | 4.4 | - | 6.2 | |
| fu | 0.22 | 0.2 | 0.14 | 0.13 | 0.043 | 0.5 | 0.032 | |
| B/P | 1.19a | 1.14a | 0.96a | 0.94a | 0.56 | 1.32 | 0.86i | |
| ka (hr−1) | 0.97 | - | 0.97 | - | - | 0.6* | 2.5j | |
| fa | 0.95 | - | 0.95 | - | See text for ADAM model parameters | 1 | 0.88 | |
| fg | 1 | - | 1 | - | 1 | 1 | ||
| Vss (L/kg) | 6.37a (method 2) | 3.5a (method 1) | 4.07a (method 2) | 3.27a (method 1) | 0.24b | 14.45f | 1.27k | |
| Vsac* (L/kg) | - | - | - | - | 0.1 | 1 | 0.75 | |
| kin (hr−1) | - | - | - | - | - | - | 11 | |
| kout (hr−1) | - | - | - | - | - | - | 7.5 | |
| Vsac Q (L/hr) | - | - | - | - | 10 | 15 | ||
| CLr (L/hr) | 0.141 | - | 0.141 | - | 0.037 | 0.375 | 0.085 | |
| CLpo (L/hr) | 40c | - | 33c | - | 80b | 1405h | ||
| CLIV (L/hr) | - | 11.8 | - | 5.8 | - | - | 33k | |
| fm | CYP2D6 | 0.58c | - | 98c | - | - | 0.98g | - |
| CYP2C9 | 0.33d | - | - | - | - | - | - | |
| CYP2C19 | 0.09d | - | - | - | 0.93e | - | - | |
| CYP3A4 | - | - | - | - | 0.07 | 0.018 | 0.94 | |
| CYP2C19l | Ki (µM) {fu}m | 2.3 {0.48} | 15 {0.42} | 34 {0.52} | 4.1 {0.47} | - | - | - |
| KI (µM) {fu} | 1.8 {0.088} | 15 {0.065} | 55 {0.095} | 7 {0.067} | - | - | - | |
| kinact (hr−1) | 1.02 | 3.0 | 3.3 | 3.5 | - | - | - | |
| CYP2D6 | Ki (µM) {fu} | 0.86 {0.48} | 0.5 {0.42} | 0.068 {0.52} | 0.035 {0.47} | - | - | - |
| CYP3A4 | Ki (µM) {fu}l | 80 {0.48} | 5.1 {0.42} | 47 {0.52} | 11 {0.47} | - | - | - |
| KI (µM) {fu}l | - | 7.7 {0.065} | 21 {0.095} | - | - | - | - | |
| kinact (hr−1)l | - | 0.66 | 0.564 | - | - | - | - | |
| Emaxn | - | - | 2.8 | 2.6 | - | - | - | |
| Ind50 (µM) {fu}n | - | - | 3.5 {0.01} | 3.9 {0.01} | - | - | - | |
| Indslope,u (µM−1)n | 30 | 80 | - | - | - | - | - | |
Unless otherwise noted, all parameters were taken from the SimCYP compound library. In order to simulate all of the inhibitors and metabolites, (R)-fluoxetine and (R)-norfluoxetine were set as substrate 1 and the primary metabolite of substrate 1, respectively. (S)-fluoxetine and (S)-norfluoxetine were set as inhibitor 1 and the metabolite of inhibitor 1, respectively. The substrate was included as inhibitor 2.
Predicted in Simcyp.
CLpo of 80L/hr for omeprazole was calculated from the reported CLiv of 37L/hr and bioavailability of 0.46 (32). Vss of omeprazole was previously reported (37).
Median CLpo values of 35.7 and 40.1L/hr for (R)-fluoxetine and (S)-fluoxetine in extensive metabolizers of spartine have been reported (38). CLpo values of 40L/hr and 33L/hr were used for (R) and (S)-fluoxetine, respectively to reflect the observed in vivo half-life and multiple dosing accumulation of both analytes. The AUC ratio in poor and extensive CYP2D6 metabolizers was used to calculate the fmCYP2D6 (34).
CYP2C9 and CYP2C19 have been implicated in the in vitro metabolism of (R)-fluoxetine, with CYP2C9 contributing more than CYP2C19(39). Scaling the CLint of each enzyme to the hepatic enzyme expression in Simcyp suggests that CYP2D6 contributes approximately 80% of the non-CYP2D6 mediated clearance of R-fluoxetine.
Omeprazole fmCYP2C19 was calculated from the AUC ratio in CYP2C19 poor and extensive metabolizers (31).
The Vss for dextromethorphan was used previously(40).
The fmCYP2D6 was calculated from the ratio of the AUC in the presence and absence of quinidine in genotyped CYP2D6 extensive metabolizers. In the same subjects, the fe was reported to be 0.02. The rest of the CL was assumed to be due to CYP3A4-mediated metabolism (28).
An oral CL of 1289 ±414L/hr was reported in 11 phenotyped CYP2D6 extensive metabolizers (28). To reflect the half-life in genotyped CYP2D6 extensive metabolizers, the oral CL of dextromethorphan was set to 1405L/hr.
The blood to plasma ratio (B/P) was previously reported (41).
The ka of midazolam was previously estimated (42).
The Vss of midazolam was previously determined after IV dosing in CYP3A5 nonexpressors (30).
Inhibition constants were previously published(3).
Inhibition parameters were previously published.
The total Ki and KI values listed were entered into Simcyp along with the corresponding fu, inc values, which are reported in brackets.
Induction parameters were not scaled to Rifampin. The observed Ind50 values were entered along with the estimated fu,inc, which is in brackets. The Indslope was corrected for fu,inc and the Indslope,u was entered into Simcyp.
Vsac, kin, kout and Vsac Q parameters were estimated to achieve desired distribution kinetics. The ka value of dextromethorphan was estimated in order to reflect observed Cmax and tmax.
The inhibition of CYP2D6, CYP2C19 and CYP3A4 was tested in a cocktail study following 12 day dosing of fluoxetine. At day 12 the average plasma concentrations were: (R)-fluoxetine 280±90 nM, (S)-fluoxetine 770±270 nM, (R)-norfluoxetine 200±70 nM and (S)-norfluoxetine 320±110 nM (Supplemental Figure 1). After 12 days, fluoxetine administration significantly decreased CYP2D6 and CYP2C19 activity based on a 99% decrease in dextromethorphan oral CL and 86% decrease in omeprazole oral CL (Table 1). The mean dextromethorphan AUC0-∞ increased 27-fold and omeprazole AUC0-∞ 7.1-fold compared to control (Table 1 and Figure 1). Surprisingly, the t1/2 of omeprazole was unchanged despite the inhibition of omeprazole oral CL. However, this is consistent with the observations that the t1/2 of omeprazole does not differ between CYP2C19 EMs and PMs (11). Plasma dextrorphan/dextromethorphan AUCm/AUCp decreased by 98% (90–99%), but dextrorphan AUC0-∞ was unchanged (P>0.05). The dextrorphan/dextromethorphan Um/Up decreased by 99% (95–>99%) after fluoxetine administration, resulting in EM to PM phenotype conversion in all subjects except one, whose Um/Up decreased by 95% after fluoxetine administration but was <3.3 on control day. No change in AUC0-∞ for the CYP2C19-formed metabolite, 5-hydroxyomeprazole, was observed (p>0.05), but the plasma AUCm/AUCp of 5-hydroxyomeprazole/omeprazole decreased by 87% (80–94%) (p<0.01) (Table 1 and Figure 1). Based on the decrease in AUCm/AUCp, 5 of the 9 subjects converted from EM to PM phenotype.
Table 1.
Summary of the pharmacokinetic parameters of dextromethorphan, dextrorphan (n=10), omeprazole and 5-hydroxyomeprazole (n=9) at the control and fluoxetine treatment study days.
| Control | Treatment | Treatment/Control | |
|---|---|---|---|
| Dextromethorphan | |||
| AUC0-∞ (nmol*hr/L) | 68±100 | 1850±800*** | 27 (5.8–160) |
| Cl (L/hr) | 5800±4500 | 70±30 | |
| t1/2 (hr) | 5±1 | 21±6 | |
| Dextrorphan | |||
| AUC0-∞ (nmol*hr/L) | 29±18 | 28±17 | 0.97 (0.47–1.4) |
| AUCm/AUCp | 1.1 (0.047–2.9) | 0.017 (0.0043–0.038)** | 0.015 (0.005–0.08) |
| Um/Up | 8.2 (1.0–37) | 0.058 (0.026–0.10)* | 0.007 (0.0014–0.051) |
| Omeprazole | |||
| AUC0-∞ (µmol*hr/L) | 1.2±0.6 | 8.5±3.6** | 7.1 (4.4–20) |
| Cl (L/hr) | 70±65 | 8±3 | |
| t1/2 (hr) | 1.2±0.5 | 1.3±0.1 | |
| 5-Hydroxyomeprazole | |||
| AUC0-∞ (µmol*hr/L) | 1.0±0.4 | 1.1±0.3 | 1.1 (0.69–1.7) |
| AUCm/AUCp | 0.90 (0.32–3.3) | 0.12 (0.045–0.21)* | 0.13 (0.063–0.20) |
| Midazolam | |||
| AUC0-∞ (nmol*hr/L) | 30±27 | 24±17 | 0.80 |
| Cl (L/hr) | 300 (67–1000) | 340 (110–1300) | |
| t1/2 (hr) | 2.2 (1.6–3.5) | 2.3 (1.4–4.0) | |
| Lovastatin | |||
| AUC0-∞ (nmol*hr/L)* | 180±90 | 170±70 | 0.94 |
| Cl (L/hr)* | 300 (130–780) | 320 (160–620) | |
| t1/2 (hr)* | 5.1 (3.3–10) | 4.4 (2.8–8.9) | |
| Cortisol | |||
| Cp (nM) | 140±60 | 160±80 | |
| Clr (mL/hr) | 36 (9.0–77) | 35 (16–80) | |
| Cortisone | |||
| Cp (nM) | 27±9 | 23±5 | |
| Clr (L/hr) | 0.43 (0.14–1.2) | 0.48 (0.14–0.91) | |
| 6β-hydroxycortisol | |||
| Clr (L/hr) | 4.2 (0.85–30) | 3.4 (0.43–13) | |
| Clf (mL/hr) | 40 (5.8–340) | 28 (6.8–130) | 0.7 |
| Um/Up | 1.1 (0.25–5.8) | 0.79 (0.17–3.0) | |
| 6β-hydroxycortisone | |||
| Clr (L/hr) | 25 (13–68) | 19 (7.1–30) | |
| Clf (mL/hr) | 100 (38–390) | 87 (39–190) | 0.87 |
n=7, N.D. not determined.
Significant differences between control and treatment days are indicated as
p <0.01,
P<0.001 and
p<0.0001.
Figure 1.

The effect of fluoxetine administration on dextromethorphan and omeprazole pharmacokinetics. The mean (with standard deviation) plasma concentration versus time curves for dextromethorphan (A), dextrorphan (B) omeprazole (D), and 5-hydroxyomeprazole (E) in the presence (circles) and absence (triangles) of fluoxetine (n=10) are shown with the effect of fluoxetine on the AUC0-∞ of dextromethorphan and omeprazole in each individual subject shown in panels C and F.
Following 12 days of fluoxetine administration, midazolam AUC0-∞, oral CL and t1/2 were unchanged (p>0.05) (Table 3 and Figure 4). Following 14 days of fluoxetine administration, lovastatin AUC0-∞, oral CL and t1/2 (n=7) were also unchanged (p>0.05) (Table 1 and Figure 2). Based on post hoc analysis (β=0.20), the study had sufficient power to detect a ≥34% increase in midazolam AUC0-∞ (n=10) and a ≥24% increase in lovastatin AUC0-∞ (n=7). In agreement with the lack of effect on midazolam and lovastatin, fluoxetine had no effect on endogenous (6β-hydroxycortisol or 6β-hydroxycortisone) measures of hepatic CYP3A4 activity (Table 1), or of cortisol, cortisone, 6β-hydroxycortisol or 6β-hydroxycortisone CLr (p>0.05). Fluoxetine did not affect the AUC0-∞(43±22µmol*hr/L versus 43±15µmol*hr/L), oral CL (13L/hr versus 12L/hr) or t1/2(4.3hr versus 4.5hr) of caffeine (p>0.05), a CYP1A2 probe (Figure 2).
Figure 4.

Induction of CYP3A4 by fluoxetine and norfluoxetine enantiomers. Concentration dependent effects of fluoxetine and norfluoxetine on CYP3A4 mRNA (A) and activity (B) are shown for three donors. Rifampicin was used as the positive control for CYP3A4 induction. The mRNA induction parameters obtained were Imax of 2.8 fold and EC50 of 3.5µM for (S)-fluoxetine and Imax of 2.6 fold and EC50 of 3.9 µM for (S)-norfluoxetine. For (R)-fluoxetine and (R)-norfluoxetine toxicity to the hepatocytes prevented treatments at concentrations that would be high enough to show saturation of induction and hence the induction slope was determined. The slopes were 0.3 µM−1 for (R)-fluoxetine and 0.8 µM−1 for (R)-norfluoxetine respectively.
Figure 2.

Disposition of caffeine (A and D), midazolam (B and E) and lovastatin (C and F) in the presence and absence of fluoxetine administration. Mean and standard deviation (n=10) plasma concentration versus time curves are displayed in the presence (circles) and absence (triangles) of fluoxetine. AUC0-∞ changes are shown for individual subjects.
To test whether the observed DDIs could be predicted from in vitro parameters, time-varying dynamic models were developed for fluoxetine and norfluoxetine enantiomers and for the three probes, midazolam, dextromethorphan and omeprazole (Table 2, Figure 3 and Supplemental Figure 1). Fluoxetine and norfluoxetine enantiomer accumulation and concentration-time profiles at day 12 of the DDI study were simulated using in vitro and in vivo kinetic parameters (Supplemental Figure 1), The mean simulated AUCs (n=100) for all three probes were within 25% of the observed on study day 1 (Figure 3). The simulated mean AUC for dextromethorphan after 12 days of fluoxetine dosing was 37% lower than the observed and within the 95% confidence interval of the simulated AUC. For midazolam and omeprazole the simulated mean AUCs were 2000% and 320% higher than the observed, respectively, (Figure 3) demonstrating a significant over-prediction of the DDI (predicted fold increase from control AUC was 31-fold for omeprazole and 13.5-fold for midazolam). When omeprazole and midazolam DDIs were simulated without CYP3A4 inactivation, the simulated mean AUCs for omeprazole and midazolam were 1% and 55% higher than observed, respectively (Figure 3) suggesting that over-prediction of CYP3A4 inhibition was responsible for the prediction failures. Since racemic fluoxetine has been shown to be a weak inducer (maximum 2-fold induction) of CYP3A4 in vitro (12), CYP3A4 induction by fluoxetine and norfluoxetine enantiomers was characterized in hepatocytes from three donors to determine whether CYP3A4 induction explained the over-prediction. Fluoxetine and norfluoxetine enantiomers increased CYP3A4 mRNA in a concentration dependent manner in vitro (Figure 4), with (R)-norfluoxetine exhibiting the greatest effect. Yet, no induction of CYP3A4 activity was observed in human hepatocytes (Figure 4). When CYP3A4 induction was incorporated into the dynamic DDI simulations together with all the inhibition parameters, the simulated mean AUC for omeprazole was within 31% of the observed and the mean predicted AUC for midazolam was 80% higher than observed (Figure 5). For both probes the 95% confidence interval of the simulated plasma concentrations (n=100) incorporated all observed data. The predicted mean AUC fold-change was 1.2-fold for midazolam and 9.5-fold for omeprazole. Since the in vivo study was conducted in a sample of 10 individuals from the population, the between study variability in the observed DDIs was simulated in 10 separate studies with 10 subjects (Supplemental Figure 2). This simulation shows that the above differences between observed and predicted data could be entirely due to between study variability in probe kinetics and DDIs and not a function of simulation accuracy.
Figure 3.

Simulated and observed concentration profiles of dextromethorphan (A and D), omeprazole (B and E) and midazolam (C and F) on day 12 of the study following fluoxetine administration (right panel) and in the control day (left panel). Observed mean and standard deviation plasma concentration versus time curves are shown as circles and simulated curves are shown as lines. The grey lines represent the 95 and 5% confidence intervals of the simulated data in 100 subjects. In panels E and F the red lines represent the simulated concentration versus time curve of omeprazole and midazolam in the absence of CYP3A4 inactivation, respectively. The control day observed Cmax values were 8.7 ± 11.4 nM, 660 ±380 nM, and 17±16nM for dextromethorphan, omeprazole and midazolam, respectively. The corresponding predicted control day Cmax values were 6.2±4nM, 340±230nM, and 15±15nM. The observed day 12 Cmax values were 74±31nM, 2500 ± 1400 nM and 14.5 ± 10 nM for dextromethorphan, omeprazole and midazolam, respectively. The corresponding predicted day 12 Cmax values were 40±25nM, 1700±940 nM and 58 ± 62nM.
Figure 5.
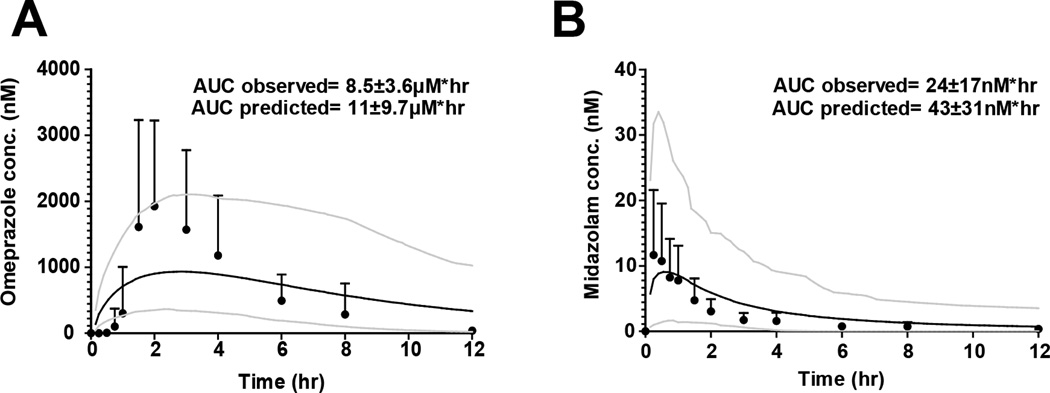
Simulated and observed concentration profiles following fluoxetine administration when CYP3A4 induction is incorporated. Mean and standard deviation plasma concentration versus time curves along with the simulated curves are displayed for omeprazole (A) and midazolam (B) Black circles represent observed concentrations, the solid black line represents the simulated concentration versus time curve resulting from the incorporation of CYP3A4 induction. Grey lines represent the 95 and 5% confidence intervals of the simulated curve. The observed Cmax values for omeprazole and midazolam were 2500 ± 1400 nM and 15 ± 15 nM, respectively. The corresponding predicted Cmax values were 980 ± 550 nM and 10 ± 11 nM.
DISCUSSION
This study shows that multiple dose fluoxetine strongly inhibits CYP2D6 and CYP2C19 activity in vivo, without affecting CYP3A4 or CYP1A2 activity. The strong inhibition of CYP2D6 and CYP2C19 was classified based on the AUC change in dextromethorphan and omeprazole. However, for both of these probes various metabolic ratios have also been used for classification of in vivo DDIs and for detection of genetic variability. The effect of fluoxetine dosing on dextrorphan/dextromethorphan AUCm/AUCp, (99% decrease) and on the OH-omeprazole/omeprazole AUCm/AUCp (87% decrease) is consistent with the observed 99% and 87% decreases in dextromethorphan and omeprazole oral clearances, and suggest that fluoxetine does not affect the elimination clearances of these metabolites (glucuronidation of dextrorphan and oxidation of OH-omeprazole to carboxy-omeprazole), a potentially confounding feature of metabolic ratios. As such the change in AUCm/AUCp values is likely due to decreased formation clearance of the metabolites.
This study demonstrates that complex DDIs involving multiple inhibitors and metabolites and multiple DDI mechanisms can be predicted using in vitro to in vivo extrapolations as long as all interacting species are adequately characterized and all elimination pathways of substrates incorporated. The fluoxetine enantiomers with their norfluoxetine metabolites present significant challenges to DDI prediction due to stereoselective P450 inhibition and pharmacokinetics, multiple enzyme inhibition by reversible and time-dependent mechanisms, inhibitor-inhibitor interactions and simultaneous inhibition and induction of CYP3A4 by multiple species. As such this system is much more complicated than inhibitor-metabolite combinations with single enzyme inhibition that have been accurately modeled in the past. The initial dynamic model predicted the reversible inhibition of CYP2D6 by fluoxetine and norfluoxetine and dextromethorphan disposition within 2-fold. However, the omeprazole (including CYP2C19 and CYP3A4 mediated clearance) and midazolam AUCs following fluoxetine dosing were greatly over-predicted. Conversely, the DDIs with omeprazole and midazolam were within 2-fold of the observed data when CYP3A4 inactivation was not included in predictions. This, together with the lack of observed change in midazolam or lovastatin AUC when a significant CYP3A4 inhibition was predicted, suggested that the reason for the over-prediction was due to concurrent CYP3A4 inhibition and induction. Indeed, fluoxetine and norfluoxetine were found to induce CYP3A4 mRNA but not activity in human hepatocytes. The lack of increase in CYP3A4 activity in the hepatocytes was expected due to the simultaneous reversible and irreversible inhibition of CYP3A4 by fluoxetine and norfluoxetine isomers. When the mRNA induction was incorporated into the dynamic DDI predictions for all four inhibitors the prediction accuracy with midazolam and omeprazole improved resulting in accurate (within 2-fold) predictions of the AUCs of all probes following 12 days of fluoxetine dosing.
This study highlights the importance of accounting for all elimination pathways of substrate drugs and the effect of inhibitors on those pathways as well as characterization of all the relevant circulating species including metabolites. Norfluoxetine enantiomers were found to play an important role in determining the magnitude of in vivo DDIs observed following fluoxetine administration: Accurate prediction of accumulation of fluoxetine following multiple dosing requires incorporation of inhibition of CYP2D6 and CYP2C19 mediated fluoxetine clearance by norfluoxetine, and based on static predictions (S)-norfluoxetine is responsible for approximately half of the observed DDIs with CYP2D6 and CYP2C19 and (R)-norfluoxetine contributes approximately half to the observed inhibition and induction of CYP3A4. As such this study supports the characterization of circulating metabolites during DDI evaluation. The importance of understanding the multiple P450 inhibition by fluoxetine is well illustrated in the omeprazole simulations that incorporate both CYP2C19 and CYP3A4 inhibition and predict a 31-fold increase in the AUC in comparison to 7.4-fold increase when only CYP2C19 inhibition is included. This simulation is in agreement with the recognized risk of multiple P450 inhibition (13). While fluoxetine was not a CYP3A4 inhibitor in vivo it was identified as a strong inhibitor of two enzymes (CYP2D6 and CYP2C19). This is clinically relevant as it could result in DDIs greater in magnitude than expected from single enzyme inhibition. For example atomoxetine is used to treat ADHD and coadministration with fluoxetine is likely. In vivo, atomoxetine is eliminated via CYP2D6, demonstrating a 7.1-fold increase in AUC’/AUC after paroxetine administration (14). Remaining atomoxetine elimination is mostly due to CYP2C19 (15). Simultaneous strong inhibition of CYP2D6 and CYP2C19 due to fluoxetine coadministration could result in a greater increase in atomoxetine exposure than with paroxetine. Similarly, fluoxetine administration with CYP2C19 substrates warrants caution. The clinically plausible coadministration of fluoxetine with diazepam could cause increased diazepam concentrations, increased sedation and other adverse effects (16, 17). In contrast, CYP2C19 is principally responsible for the formation of the active metabolite of clopidogrel (18, 19) and fluoxetine is likely to inhibit the formation of this metabolite, leading to decreased anti-platelet activity. As such, the results of this study establish fluoxetine as a strong inhibitor of CYP2D6 and CYP2C19.
METHODS
CYP2D6 inhibition in vitro
Reversible CYP2D6 inhibition constants (Ki) of fluoxetine and norfluoxetine enantiomers were determined in pooled human liver microsomes (HLMs) from 6 donors confirmed to be CYP2D6 and CYP2C19 EMs and CYP3A5*3/*3 genotype. Dextromethorphan (1.7μM, 5µM and 25µM) O-demethylation was used as a probe and Ki-values were determined using nonlinear regression.
Clinical protocol
The study was approved by the University of Washington Institutional Review Board and registered at www.clinicaltrials.gov (NCT01361217). Ten subjects (5 women and 5 men) were enrolled in the study after giving their written informed consent. Eight subjects were Caucasian, one Chicano and one Hispanic. The subjects were 30±10 yr of age, 172±11 cm high and 72±14 kg on average. None of the subjects had a history of systemic disease and all had normal laboratory renal and hepatic function values. Tobacco users or subjects with history of allergy to any of the study medications or related medications were excluded. Each subject was genotyped as described (20) for CYP2D6, CYP2C19 and CYP3A5. Subjects with a CYP2D6 copy number other than 2 or CYP2D6*3, CYP2D6*4, CYP2D6*10, CYP2C19*2 or CYP3A5*1 single nucleotide polymorphism where excluded from the study. From 2 weeks before to 3 weeks after the study, subjects were asked to abstain from over-the-counter medications, prescription medications and grapefruit products. Subjects also abstained from caffeine (1 day before) and alcohol products (2 days before) through the end of each sample collection period. Each subject participated in two control and two treatment sessions. On control day 1 and treatment day 12, subjects received a validated cocktail (21) of: 100mg caffeine, 2mg midazolam, 30mg dextromethorphan and 20mg omeprazole (enteric coated formulation) orally with 250mL of water (21). On control day 3 and treatment day 14 (48 hours after cocktail administration in all cases), subjects received 20mg of lovastatin with 250mL of water. Subjects took 20mg of fluoxetine orally on treatment day 1 then increased to 60mg daily for 13 days. The probes were administered 1 hour after fluoxetine. Blood samples were collected between 0 and 12 hours on control day 1 and then from 48 to 60 hours, (control day 3). Following study day 12 (cocktail administration) blood samples were collected for 96 hours (0–24 hours and 48–96 hours) including study day 14. Plasma was isolated from blood by centrifugation and stored at −80°C until analysis. Urine was collected from 0–12 hr and 12–24 hr after each probe administration. Total urine volume was recorded and aliquots were stored at −20°C until analysis.
Quantification of study drugs and metabolites
All reference materials were obtained from Sigma Aldrich, St Louis, MO, Toronto Research Chemicals, North York Ontario CA, and Cerilliant, Round Rock, TX, except norfluoxetine stereoisomers which were synthesized in house(3). Concentrations of omeprazole, 5-hydroxyomeprazole, dextromethorphan, dextrorphan, dextrorphan-O-glucuronide, midazolam and caffeine in plasma and urine were analyzed using a Shimadzu Prominence UHPLC (Tokyo, Japan) coupled to an AB Sciex API3200 MS/MS (Framingham, MA) as described previously (3, 22). Cortisol, cortisone, 6β-hydroxycortisol, 6β-hydroxycortisone, lovastatin and hydroxylovastatin acid were analyzed using an Agilent 1290 UHPLC (Santa Clara, CA) coupled to an AB Sciex API5500 MS/MS. Analytes were separated using a Thermo Hypersil Gold 100x2.1mm, 1.9µm column (West Palm Peach, FL) with a gradient elution from 90% water with 0.1% formic acid:10% acetonitrile (0.5 min), to 90% acetonitrile by 3.5 minutes, held until 5 min, then allowed to re-equilibrate to initial conditions until 7 minutes. The (R)- and (S)- enantiomers of fluoxetine and norfluoxetine were separated using an Astec Chirobiotic V 250x2.1mm, 5µm (St. Louis, MO) column and isocratic elution with 10% water and 90% methanol with 10mM ammonium formate. All analytes were detected using positive electrospray ionization except for dextrorphan-O-glucuronide, 6β-hydroxycortisol, 6β-hydroxycortisone and hydroxylovastatin acid, which were detected using negative electrospray ionization. All MRM transitions (m/z) were as previously described (22) except the following: 272→128 (dextromethorphan), 258→157 (dextrorphan), 432→256 (dextrorphan-O-glucuronide), 195→138 (caffeine), 363→121 (cortisol), 361→163 (cortisone), 423→347 (6β-hydroxycortisol), 421→345 (6β-hydroxycortisone), 427→325 (lovastatin) and 421→319 (hydroxylovastatin acid). The injection volume for all assays was 10µL. The lower limits of quantitation were less than 1nM for all analytes, except for caffeine (15nM). Inter-day percent coefficient of variation for all analytes at 1nM (30nM for caffeine) was less than 15%. All samples were protein precipitated with 1:2 sample:acetonitrile, except omeprazole and 5-hydroxyomeprazole (2:3:1 sample:acetonitrile:methanol), centrifuged twice at 3000g for 15min and the supernatant was used for analysis. The organic solvent contained 100nM of d3-omeprazole, d4-midazolam, d6-fluoxetine or simvastatin as internal standards. Cortisol, cortisone, 6β-hydroxycortisol and 6β-hydroxycortisone were extracted from the 6 hr plasma sample and the 0–12 hr urine sample from control day 3 and study day 14 using a previously described liquid-liquid extraction method (23) with the addition of a second extraction and using the internal standard of 100nM 16β-methylprednisolone.
Human hepatocyte studies
Induction of CYP3A4 by fluoxetine and norfluoxetine enantiomers, was determined in cryopreserved hepatocytes from three donors. Hepatocytes were thawed at 37°C and immediately placed into plating media (InVitroGro CP medium plus Torpedo antibiotic mix; BioreclamationIVT, Baltimore, MD). Cell count and viability were determined by automated cell counting. Hepatocytes were plated at 240,000 live cells per well in a 24-well collagen type-I coated plates (Becton Dickinson, Franklin Lakes, NJ) and allowed to attach for ~8 hours. The plating media was then replaced with Williams E media containing cell maintenance supplements (CM4000; LifeTechnologies, Grand Island, NY) and (S)- or (R)-fluoxetine or (S)- or (R)-norfluoxetine (0.1, 1 and 5µM), rifampin (10µM) or DMSO (vehicle control). Higher concentrations of fluoxetine and norfluoxetine could not be used due to toxicity to the cells. Media and test compounds were refreshed daily. After the 48-hour induction period, the hepatocytes were washed twice with maintenance media, maintenance media containing 100µM midazolam (final concentration) was added and cells incubated for 1 hour. Incubations were stopped with two volumes of ice-cold acetonitrile containing 0.1µM tolbutamide as an internal standard. 1’-hydroxymidazolam formation was analyzed as described (24). For mRNA analysis, the cells were harvested using Tri-Reagent (Life Technologies, Grand Island, NY) and mRNA extracted according to manufacturers instructions. cDNA was generated using Taqman reagents and rt-PCR conducted using TaqMan gene expression master mix (Life Technologies, Grand Island, NY) according to manufacturers instructions. Induction of CYP3A4 mRNA was measured using a StepOne plus real time PCR (Applied Biosciences, Foster City, CA) and relative mRNA expression compared to GAPDH as a housekeeping gene was determined using the ΔΔCt method. Fold change in expression and activity was normalized to the DMSO control. Emax and EC50 values for (S)-fluoxetine and (S)-norfluoxetine were determined by fitting equation 1 to the data from each donor using using nonlinear squares analysis in Graphpad Prism (Graphpad Software, San Diego CA). Emax is the maximum induction effect and the EC50 is the concentration causing half maximal induction. Average Emax and EC50 values were incorporated into predictions. A linear relationship between concentration and mRNA fold induction was used for (R)-fluoxetine and (R)-norfluoxetine. To account for induction by both compounds in the predictions, a slope was fit to the average values of the three donors.
| (1) |
In vitro-to-in vivo predictions
Overall DDI risk was first assessed via static predictions using [I]/Ki and λ/kdeg (time-dependent inhibition rate divided by P450 degradation rate constant) (25) using unbound inhibitor concentrations and inhibition constants. The kdeg values were 0.02 hr−1 for CYP2C19 and 0.029hr−1 for CYP3A4 (26, 27). The previously determined IC50, KI and kinact,app and fu values are listed in Table 2. In vivo DDIs and increase in probe drug AUC were predicted via semi-physiologically-based pharmacokinetic (dynamic) modeling with SimCYP v.12 (Certara, Sheffield, UK) using the default healthy population (n=100) with the same gender proportion, age range and genotypes as the study population. In order to assess the variability between trials, 10 trials were run with 10 subjects each. Several modifications were made to the default dextromethorphan, omeprazole and midazolam models and drug specific parameters for each of these probes are presented in Table 2. Recombinant enzyme CLint values for dextromethorphan were predicted using oral CL value of 1405L/hr and fmCYP2D6 of 0.98 (28), based on a reported oral CL of 1289±414L/hr in CYP2D6 phenotyped extensive metabolizers (29). The remainder of the hepatic clearance was attributed to CYP3A4. For midazolam, the recombinant enzyme intrinsic clearance values were calculated in Simcyp using fmCYP3A4 of 0.94 and a CLiv of 33L/hr reported after 1mg IV dosing in CYP3A5 nonexpressors (30). For omeprazole, recombinant enzyme intrinsic clearance values were calculated in Simcyp using fmCYP2C19 of 0.93 and fmCYP3A4 of 0.07 (31), and oral CL of 80L/hr (32). Additionally, an ADAM model was used to simulate the absorption profile of enteric-coated omeprazole capsules. The triggering pH was set to 6, the intrinsic solubility to 0.25mg/mL, and the Caco-2 permeability was 26.2*10−06 cm/s, as reported (33). Drug files were created for (S)- and (R)-fluoxetine and for (S)- and (R)-norfluoxtine as metabolites of fluoxetine with the drug specific parameters (Table 2). The recombinant enzyme intrinsic clearance values were calculated in Simcyp from the in vivo oral CL in CYP2D6 extensive metabolizers and the CYP2D6 fm of 0.98 based on EM versus PM studies (34), and simulated kinetics were compared to observed. CLiv values for the norfluoxetine enantiomers were estimated to reflect the reported t1/2 for each compound following a single oral dose. Distribution parameters for all four inhibitors were predicted in Simcyp from the LogP and pKa values. No other enzymes or transporters were included in the simulations than those listed in Table 2. The interactions between fluoxetine and norfluoxetine and their CYP2C19 and CYP3A4 inhibition kinetics were simulated as described (35) incorporating the interplay and mutual inhibition between the four moieties. The rac-fluoxetine dosage regimen simulated was identical to the dosage regimen in the in vivo study. Simulated day 12 concentrations agreed well with the observed day 12 concentrations in the study.
Pharmacokinetic calculations
Noncompartmental pharmacokinetic analysis was performed using Phoenix (Pharsight, Mountainview, CA). For lovastatin, the ring closed lactone and ring opened hydroxylovastatin acid were measured separately and summed for pharmacokinetic analysis. One subject was excluded from the omeprazole analysis as an outlier (Grubb’s outlier test, p<0.01). This individual’s omeprazole concentrations were <4nM on the fluoxetine administration day (compared to 2800±1200nM in the other subjects) except for 34nM at the 12-hour sample. The metabolite/parent AUC ratios (AUCm/AUCp) were calculated using AUC0-∞. The metabolite/parent urinary molar amount excreted over 24 hr ratio (Um/Up) was measured for dextrorphan plus dextrorphan-O-glucuronide then divided by dextromethorphan. Based on literature values, the cutoff for categorizing subject phenotype between extensive metabolizers (EM) and poor metabolizers (PM) was EM>3.3>PM for dextrorphan/dextromethorphan Um/Up and EM>0.11>PM for 5-hydroxyomeprazole/omeprazole AUCm/AUCp (31, 36). The formation clearance (Clf) of 6β-hydroxycortisol and 6β-hydroxycortisone was calculated from the amount of metabolite excreted in urine from 0–12hr divided by the 6hr plasma concentration of parent as described (23). The renal clearance (Clr) was calculated from the amount excreted in urine from 0–12hr divided by the plasma concentration at 6hr.
Statistical analysis
The mean and standard deviation are reported for AUC0-∞. The mean change and range are reported for all other values. Two-sided paired t-tests were used to evaluate the significance of change in in vivo parameters between control and treatment days. Post hoc power analysis was performed assuming a paired, two-sided hypothesis, α=0.05 and β=0.20. All statistical analyses were performed using Excel (Microsoft Office 2011, Redmond, WA).
Supplementary Material
STUDY HIGHLIGHTS.
What is the current knowledge on the topic?
Fluoxetine isomers and their norfluoxetine metabolites are inhibitors of multiple P450s in vitro and in vivo and act through both time-dependent and reversible mechanisms.
What question this study addressed?
This study was designed to evaluate whether in vivo complex DDIs precipitated by enantiomers of fluoxetine and their metabolites could be predicted from in vitro data.
What this study adds to our knowledge?
This study shows that complex DDIs with a combination of mechanisms and inhibitors can be predicted from in vitro data and characterization of metabolites in DDIs is important. The results of this study also establish fluoxetine as a strong inhibitor of CYP2C19.
How this might change clinical pharmacology and therapeutics?
Understanding of DDI mechanisms and relevant inhibitors is essential for evaluating DDI risk for novel compounds. Strong CYP2C19 inhibition by fluoxetine requires attention when fluoxetine is coadministered with drugs cleared by CYP2C19.
ACKNOWLEDGEMENTS
The authors thank the University of Washington Clinical Research Center and Investigational Drug Services staff for their help in conducting this study The authors are grateful for Dr Amin Rostami-Hodjegan, Dr Gaohua Lu, Dr Lisa Almond and Dr Masoud Jamei from SimCYP Ltd for their help in developing the time varying PK models and for Dr. Wendel Nelson for helpful discussion during the conduct of this study. The authors wish to thank Dr. Alysa Walker for her help in the development of the chiral assay for fluoxetine and norfluoxetine enantiomers.
FUNDING SUPPORT
This work was partially supported by NIH grants P01 GM32165 (J.D.L., C.D., K.K., N.I.), T32 GM007750 (J.E.S) and UL1 TR000423 (University of Washington Clinical Research Center).
Footnotes
CONFLICT OF INTEREST/DISCLOSURE
The authors state no conflict of interest in the preparation of this manuscript
AUTHOR CONTRIBUTIONS
J.E.S., J.D.L., R.S.F. and N.I. wrote the manuscript, performed the research and analyzed the data. C.D., J.E.S., J.D.L., R.S.F. K.L.K. and N.I. designed the research. * J.E.S and J.D.L contributed equally to this manuscript.
REFERENCES
- 1.Jannuzzi G, et al. Plasma concentrations of the enantiomers of fluoxetine and norfluoxetine: sources of variability and preliminary observations on relations with clinical response. Ther Drug Monit. 2002;24:616–627. doi: 10.1097/00007691-200210000-00006. [DOI] [PubMed] [Google Scholar]
- 2.Scordo MG, Spina E, Dahl ML, Gatti G, Perucca E. Influence of CYP2C9: 2C19 and 2D6 genetic polymorphisms on the steady-state plasma concentrations of the enantiomers of fluoxetine and norfluoxetine. Basic Clin Pharmacol Toxicol. 2005;97:296–301. doi: 10.1111/j.1742-7843.2005.pto_194.x. [DOI] [PubMed] [Google Scholar]
- 3.Lutz JD, VandenBrink BM, Babu KN, Kunze KL, Isoherranen N. Stereoselective inhibition of CYP2C19 and CYP3A4 by fluoxetine and its metabolite: implications for risk assessment of multiple time-dependent inhibitor systems. Drug Metab Dispos. 41:2056–2065. doi: 10.1124/dmd.113.052639. [DOI] [PMC free article] [PubMed] [Google Scholar]
- 4.Stevens JC, Wrighton SA. Interaction of the enantiomers of fluoxetine and norfluoxetine with human liver cytochromes P450. J Pharmacol Exp Ther. 1993;266:964–971. [PubMed] [Google Scholar]
- 5.Bergstrom RF, Peyton AL, Lemberger L. Quantification and mechanism of the fluoxetine and tricyclic antidepressant interaction. Clin Pharmacol Ther. 1992;51:239–248. doi: 10.1038/clpt.1992.18. [DOI] [PubMed] [Google Scholar]
- 6.Vlase L, Popa A, Neag M, Muntean D, Leucuta SE. Effect of fluoxetine on the pharmacokinetics of lansoprazole: a two-treatment period study in healthy male subjects. Clin Drug Investig. 2011;31:727–733. doi: 10.2165/11589010-000000000-00000. [DOI] [PubMed] [Google Scholar]
- 7.Greenblatt DJ, Preskorn SH, Cotreau MM, Horst WD, Harmatz JS. Fluoxetine impairs clearance of alprazolam but not of clonazepam. Clin Pharmacol Ther. 1992;52:479–486. doi: 10.1038/clpt.1992.175. [DOI] [PubMed] [Google Scholar]
- 8.Grimsley SR, Jann MW, Carter JG, D'Mello AP, D'Souza MJ. Increased carbamazepine plasma concentrations after fluoxetine coadministration. Clin Pharmacol Ther. 1991;50:10–15. doi: 10.1038/clpt.1991.98. [DOI] [PubMed] [Google Scholar]
- 9.Lam YW, Alfaro CL, Ereshefsky L, Miller M. Pharmacokinetic and pharmacodynamic interactions of oral midazolam with ketoconazole, fluoxetine, fluvoxamine, and nefazodone. J Clin Pharmacol. 2003;43:1274–1282. doi: 10.1177/0091270003259216. [DOI] [PubMed] [Google Scholar]
- 10.Altamura AC, Moro AR, Percudani M. Clinical pharmacokinetics of fluoxetine. Clin Pharmacokinet. 1994;26:201–214. doi: 10.2165/00003088-199426030-00004. [DOI] [PubMed] [Google Scholar]
- 11.Uno T, Niioka T, Hayakari M, Yasui-Furukori N, Sugawara K, Tateishi T. Absolute bioavailability and metabolism of omeprazole in relation to CYP2C19 genotypes following single intravenous and oral administrations. European journal of clinical pharmacology. 2007;63:143–149. doi: 10.1007/s00228-006-0251-7. [DOI] [PubMed] [Google Scholar]
- 12.Fahmi OA, et al. Comparison of different algorithms for predicting clinical drug-drug interactions, based on the use of CYP3A4 in vitro data: predictions of compounds as precipitants of interaction. Drug Metab Dispos. 2009;37:1658–1666. doi: 10.1124/dmd.108.026252. [DOI] [PubMed] [Google Scholar]
- 13.Isoherranen N, Lutz JD, Chung S, Hachad H, Levy RH, Ragueneau-Majlessi I. Importance of multi-P450 inhibition in drug-drug interactions: evaluation of incidence, inhibition magnitude and prediction from in vitro data. Chem Res Toxicol. 2012;25:2285–2300. doi: 10.1021/tx300192g. [DOI] [PMC free article] [PubMed] [Google Scholar]
- 14.Belle DJ, Ernest CS, Sauer JM, Smith BP, Thomasson HR, Witcher JW. Effect of potent CYP2D6 inhibition by paroxetine on atomoxetine pharmacokinetics. J Clin Pharmacol. 2002;42:1219–1227. doi: 10.1177/009127002762491307. [DOI] [PubMed] [Google Scholar]
- 15.Ring BJ, Gillespie JS, Eckstein JA, Wrighton SA. Identification of the human cytochromes P450 responsible for atomoxetine metabolism. Drug Metab Dispos. 2002;30:319–323. doi: 10.1124/dmd.30.3.319. [DOI] [PubMed] [Google Scholar]
- 16.Ishizaki T, et al. Comparison of the interaction potential of a new proton pump inhibitor, E3810, versus omeprazole with diazepam in extensive and poor metabolizers of S-mephenytoin 4'-hydroxylation. Clin Pharmacol Ther. 1995;58:155–164. doi: 10.1016/0009-9236(95)90193-0. [DOI] [PubMed] [Google Scholar]
- 17.Jung F, Richardson TH, Raucy JL, Johnson EF. Diazepam metabolism by cDNA-expressed human 2C P450s: identification of P4502C18 and P4502C19 as low Km diazepam N-demethylases. Drug Metab Dispos. 1997;25:133–139. [PubMed] [Google Scholar]
- 18.Farid NA, Kurihara A, Wrighton SA. Metabolism and disposition of the thienopyridine antiplatelet drugs ticlopidine, clopidogrel, and prasugrel in humans. J Clin Pharmacol. 2010;50:126–142. doi: 10.1177/0091270009343005. [DOI] [PubMed] [Google Scholar]
- 19.Gilard M, et al. Influence of omeprazole on the antiplatelet action of clopidogrel associated with aspirin: the randomized, double-blind OCLA (Omeprazole Clopidogrel Aspirin) study. J Am Coll Cardiol. 2008;51:256–260. doi: 10.1016/j.jacc.2007.06.064. [DOI] [PubMed] [Google Scholar]
- 20.Templeton I, Peng CC, Thummel KE, Davis C, Kunze KL, Isoherranen N. Accurate prediction of dose-dependent CYP3A4 inhibition by itraconazole and its metabolites from in vitro inhibition data. Clin Pharmacol Ther. 2010;88:499–505. doi: 10.1038/clpt.2010.119. [DOI] [PMC free article] [PubMed] [Google Scholar]
- 21.Ryu JY, et al. Development of the "Inje cocktail" for high-throughput evaluation of five human cytochrome P450 isoforms. Clin Pharmacol Ther. 2007;82:531–540. doi: 10.1038/sj.clpt.6100187. [DOI] [PubMed] [Google Scholar]
- 22.Shirasaka Y, Sager JE, Lutz JD, Davis C, Isoherranen N. Inhibition of CYP2C19 and CYP3A4 by Omeprazole Metabolites and Their Contribution to Drug-Drug Interactions. Drug Metab Dispos. 2013;41:1414–1424. doi: 10.1124/dmd.113.051722. [DOI] [PMC free article] [PubMed] [Google Scholar]
- 23.Peng CC, Templeton I, Thummel KE, Davis C, Kunze KL, Isoherranen N. Evaluation of 6beta-hydroxycortisol: 6beta-hydroxycortisone, and a combination of the two as endogenous probes for inhibition of CYP3A4 in vivo. Clin Pharmacol Ther. 2011;89:888–895. doi: 10.1038/clpt.2011.53. [DOI] [PMC free article] [PubMed] [Google Scholar]
- 24.Foti RS, Rock DA, Wienkers LC, Wahlstrom JL. Selection of alternative CYP3A4 probe substrates for clinical drug interaction studies using in vitro data and in vivo simulation. Drug Metab Dispos. 2010;38:981–987. doi: 10.1124/dmd.110.032094. [DOI] [PubMed] [Google Scholar]
- 25.Fujioka Y, Kunze KL, Isoherranen N. Risk assessment of mechanism-based inactivation in drug-drug interactions. Drug Metab Dispos. 2012;40:1653–1657. doi: 10.1124/dmd.112.046649. [DOI] [PMC free article] [PubMed] [Google Scholar]
- 26.Ghanbari F, et al. A critical evaluation of the experimental design of studies of mechanism based enzyme inhibition, with implications for in vitro-in vivo extrapolation. Curr Drug Metab. 2006;7:315–334. doi: 10.2174/138920006776359293. [DOI] [PubMed] [Google Scholar]
- 27.Obach RS, Walsky RL, Venkatakrishnan K. Mechanism-based inactivation of human cytochrome p450 enzymes and the prediction of drug-drug interactions. Drug Metab Dispos. 2007;35:246–255. doi: 10.1124/dmd.106.012633. [DOI] [PubMed] [Google Scholar]
- 28.Capon DA, Bochner F, Kerry N, Mikus G, Danz C, Somogyi AA. The influence of CYP2D6 polymorphism and quinidine on the disposition and antitussive effect of dextromethorphan in humans. Clinical pharmacology and therapeutics. 1996;60:295–307. doi: 10.1016/S0009-9236(96)90056-9. [DOI] [PubMed] [Google Scholar]
- 29.Borges S, Li L, Hamman MA, Jones DR, Hall SD, Gorski JC. Dextromethorphan to dextrorphan urinary metabolic ratio does not reflect dextromethorphan oral clearance. Drug Metab Dispos. 2005;33:1052–1055. doi: 10.1124/dmd.104.003459. [DOI] [PubMed] [Google Scholar]
- 30.Kharasch ED, et al. Influence of CYP3A5 genotype on the pharmacokinetics and pharmacodynamics of the cytochrome P4503A probes alfentanil and midazolam. Clinical pharmacology and therapeutics. 2007;82:410–426. doi: 10.1038/sj.clpt.6100237. [DOI] [PubMed] [Google Scholar]
- 31.Furuta T, et al. Effects of clarithromycin on the metabolism of omeprazole in relation to CYP2C19 genotype status in humans. Clin Pharmacol Ther. 1999;66:265–274. doi: 10.1016/S0009-9236(99)70034-2. [DOI] [PubMed] [Google Scholar]
- 32.Cederberg C, Andersson T, Skanberg I. Omeprazole: pharmacokinetics and metabolism in man. Scandinavian journal of gastroenterology Supplement. 1989;166:33–340. doi: 10.3109/00365528909091241. discussion 1-2. [DOI] [PubMed] [Google Scholar]
- 33.Pauli-Magnus C, et al. P-glycoprotein-mediated transport of digitoxin, alpha-methyldigoxin and beta-acetyldigoxin. Naunyn Schmiedebergs Arch Pharmacol. 2001;363:337–343. doi: 10.1007/s002100000354. [DOI] [PubMed] [Google Scholar]
- 34.Fjordside L, Jeppesen U, Eap CB, Powell K, Baumann P, Brosen K. The stereoselective metabolism of fluoxetine in poor and extensive metabolizers of sparteine. Pharmacogenetics. 1999;9:55–60. doi: 10.1097/00008571-199902000-00008. [DOI] [PubMed] [Google Scholar]
- 35.Rowland Yeo K, Jamei M, Yang J, Tucker GT, Rostami-Hodjegan A. Physiologically based mechanistic modelling to predict complex drug-drug interactions involving simultaneous competitive and time-dependent enzyme inhibition by parent compound and its metabolite in both liver and gut - the effect of diltiazem on the time-course of exposure to triazolam. Eur J Pharm Sci. 2010;39:298–309. doi: 10.1016/j.ejps.2009.12.002. [DOI] [PubMed] [Google Scholar]
- 36.Basci NE, Bozkurt A, Kayaalp SO, Sayal A, Isimer A. Omission of the deconjugation step in urine analysis and the unaltered outcome of CYP2D6 phenotyping with dextromethorphan. Eur J Drug Metab Pharmacokinet. 1998;23:1–5. doi: 10.1007/BF03189819. [DOI] [PubMed] [Google Scholar]
- 37.Regardh CG, Andersson T, Lagerstrom PO, Lundborg P, Skanberg I. The pharmacokinetics of omeprazole in humans--a study of single intravenous and oral doses. Therapeutic drug monitoring. 1990;12:163–172. doi: 10.1097/00007691-199003000-00010. [DOI] [PubMed] [Google Scholar]
- 38.Fjordside L, Jeppersen U, Eap CB, Powell K, Baumann P, Brosen K. The stereoselective metabolism of fluoxetine in poor and extensive metabolizers of sparteine. Pharmacogenetics. 1999;9:55–60. doi: 10.1097/00008571-199902000-00008. [DOI] [PubMed] [Google Scholar]
- 39.Ring BJ, Eckstein JA, Gillespie JS, Binkley SN, VandenBranden M, Wrighton SA. Identification of the human cytochromes p450 responsible for in vitro formation of R- and S-norfluoxetine. The Journal of pharmacology and experimental therapeutics. 2001;297:1044–1050. [PubMed] [Google Scholar]
- 40.Ke AB, Nallani SC, Zhao P, Rostami-Hodjegan A, Isoherranen N, Unadkat JD. A physiologically based pharmacokinetic model to predict disposition of CYP2D6 and CYP1A2 metabolized drugs in pregnant women. Drug metabolism and disposition: the biological fate of chemicals. 41:801–813. doi: 10.1124/dmd.112.050161. [DOI] [PMC free article] [PubMed] [Google Scholar]
- 41.Chien JY, Lucksiri A, Ernest CS, 2nd, Gorski JC, Wrighton SA, Hall SD. Stochastic prediction of CYP3A-mediated inhibition of midazolam clearance by ketoconazole. Drug Metab Dispos. 2006;34:1208–1219. doi: 10.1124/dmd.105.008730. [DOI] [PubMed] [Google Scholar]
- 42.Ke AB, Nallani SC, Zhao P, Rostami-Hodjegan A, Unadkat JD. A PBPK Model to Predict Disposition of CYP3A-Metabolized Drugs in Pregnant Women: Verification and Discerning the Site of CYP3A Induction. CPT Pharmacometrics Syst Pharmacol. 1:e3. doi: 10.1038/psp.2012.2. [DOI] [PMC free article] [PubMed] [Google Scholar]
- 43.Eap CB, et al. Concentrations of the enantiomers of fluoxetine and norfluoxetine after multiple doses of fluoxetine in cytochrome P4502D6 poor and extensive metabolizers. Journal of clinical psychopharmacology. 2001;21:330–334. doi: 10.1097/00004714-200106000-00013. [DOI] [PubMed] [Google Scholar]
Associated Data
This section collects any data citations, data availability statements, or supplementary materials included in this article.