Abstract
Single molecule switching based super-resolution microscopy techniques have been extended into three dimensions through various 3D single molecule localization methods. However, the localization accuracy in z can be severely degraded by the presence of aberrations, particularly the spherical aberration introduced by the refractive-index-mismatch when imaging into an aqueous sample with an oil immersion objective. This aberration confines the imaging depth in most experiments to regions close to the coverslip. Here, we show a method to obtain accurate, depth dependent z calibrations by measuring the point spread function (PSF) at the coverslip surface, calculating the microscope pupil function through phase retrieval, and then computing the depth dependent PSF with the addition of spherical aberrations. We demonstrate experimentally that this method can maintain z localization accuracy over a large range of imaging depths. Our super-resolution images of a mammalian cell nucleus acquired between 0 and 2.5 μm past the coverslip show that this method produces accurate z localizations even in the deepest focal plane.
The emergence over the last decade of super-resolution microscopy techniques has opened up a wealth of biological questions that could not before be addressed with conventional optical microscopes [1, 2]. These techniques provide a lateral resolution that is an order of magnitude superior to conventional, diffraction-limited imaging. In particular, single molecule switching based super-resolution microscopy methods, also referred to as (fluorescence) photoactivated localization microscopy ((F)PALM) [3, 4] or stochastic optical reconstruction microscopy (STORM) [5], have gained in popularity because of their simple optical configuration. The principle behind these techniques is to isolate the PSF of single fluorescent molecules by switching them between fluorescent and dark states, thus allowing their positions to be determined with nanometer-scale precision.
Based on how the shape of a molecule’s PSF changes with its position normal to the focal plane, that is, in z, a variety of 3D localization methods have been developed to enable the imaging of 3D cellular structures. These methods include simultaneously imaging at two different focal planes [6] and altering the PSF so that its shape in the x-y plane encodes z position. For instance, with a spatial light modulator in the imaging path, a double-helix PSF can be produced [7]. We use an approach that introduces astigmatism to the PSF by adding a weak cylindrical lens to the imaging path [8, 9, 10]. The ellipticity of the PSF is now a function of the z position of the molecule relative to the focal plane of the objective. Through the PSF’s width in x and y, wx and wy, determined by fitting to a 2D elliptical Gaussian, we can infer the molecule’s position in z with a precision of about 50 nm. This astigmatic approach has the advantage of requiring minimum change to either the optical setup or the analysis software.
Three-dimensional localization using astigmatism first requires a calibration. Typically, we determine how the geometry of a molecule’s PSF, wx, and wy, varies with its position in z by attaching dye molecules or small fluorescent beads to the coverslip and imaging them while scanning in z. We then obtain a calibration curve in wx−wy space as in Fig. 1d. Finding a point on this curve that minimizes its distance to the measured (wx, wy) of a molecule tells the z position of this molecule relative to the focal plane. The molecule will be discarded if its (wx, wy) lies too far away from the curve. In practice, searching in the wx1/2 − wy1/2 space is performed to improve the precision [10, 12].
Fig. 1.
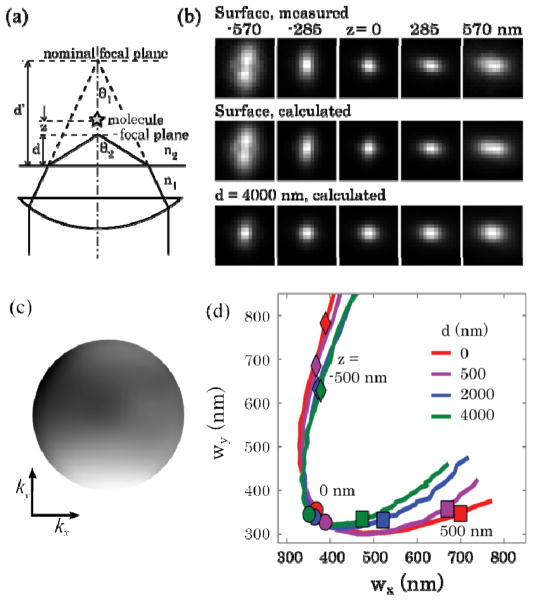
Correction to the depth-induced aberrations in z localization calibration. (a) Scheme of aberrations induced by refractive-index mismatch. (2) The phase retrieval algorithm used images of a 100 nm fluorescent bead at various amounts of defocus. Five of those images are shown where the z separation between each image is 285 nm. The position of the nominal focus is set to z = 0. The computed PSFs using the retrieved PF at the surface and when the emitter is physically 4 μm past the coverslip are displayed. (c) The phase of the PF obtained through the iterative phase retrieval process. The outer edge of the PF corresponds to the highest spatial frequency measured, k = 2 μm−1. (d) Calibration curves determined from computed PSFs at different depths past the coverslip into a medium with refractive index of 1.34. The points on the curves labeled with a circle correspond the nominal focus of the emitter, z = 0. The diamonds and rectangles label where the emitter is at z = −500 nm and 500 nm, respectively.
Non-ideal imaging conditions can complicate this process. As has long been known, when imaging with an oil immersion objective into an aqueous medium, the water-glass refractive index mismatch results in a focal shift shown in Fig. 1(a): the physical distance between an emitter and the coverglass surface (actual focal position, d) is shorter than the distance that the objective needs to move to refocus from the surface to the emitter (nominal focal position, d′) [11]. In addition, the increasing amount of spherical aberration associated with deeper imaging broadens the PSF, thus degrading the localization precision.
When small amounts of spherical aberration are present, e.g., when imaging only a couple microns past the coverglass surface, one can still use the calibration curves obtained at the surface and then computationally correct the inaccuracies in the found z coordinates. This correction has been implemented as two separate linear transforms to the positive and negative z values with pre-calculated, depth-dependent scaling factors [12]. For even deeper samples, the spherical aberrations can be physically compensated by using adaptive optics [13, 14], switching to a water immersion objective, or raising the refractive index of the sample medium [12]. Here, we report a different approach that does not further add complexities to our microscope set-up, reduce our photon collection efficiency as would happen when switching to a water-immersion objective, or compromise our ability to do live cell imaging which requires aqueous buffer.
The key to perform accurate 3D localization is to know the precise PSFs at different imaging depths. Experimentally measuring this depth-dependent PSF, however, is a very cumbersome procedure [15]. Although it is straightforward to calculate ideal PSFs with a refractive-index-mismatch [16], they do not include the other intrinsic aberrations of the microscope optical system. Therefore, we experimentally measure the PSF at the coverglass surface, and then calculate how this PSF is distorted at different depths. Because the spherical aberration caused by refractive-index-mismatch is well defined, we expect that this method can generate accurate calibration curves at arbitrary depths.
Our microscope for performing 3D STORM consists of a 100x 1.4 NA UPlanSApo oil immersion objective (Olympus) on a Nikon Eclipse Ti-U base, similar to described previously [17]. A 647 nm excitation laser (OBIS 647 LX, Coherent) and three activation lasers (OBIS 488 LX, OBIS 405 LX and Sapphire 561 LP, Coherent) are combined by dichroic mirrors and sent into the microscope back port. Fluorescent emission is filtered by a quad-band polychroic mirror (zt405/488/561/640rpc, Chroma) and a band-pass filter (ET705/72m, Chroma), directed out of a side port in the microscope base, through a cylindrical lens (f = 700 mm, placed between the side-port and the imaging plane) and a pair of 75 mm relay lenses, and onto an EMCCD camera (iXon Ultra 897 BV, Andor). We have adjusted the position of the cylindrical lens to obtain the optimal separation between the x and y focal planes. The distances between the relay lenses and the camera have also been adjusted to minimize the inherent spherical aberration in the objective lens. The sample is placed on a piezo z stage (Nano-Z100, MadCity Labs).
We measured the 3D PSF of our microscope using fluorescent molecules or beads at the coverglass surface, which allowed us to determine the phase of the pupil function (PF) of the microscope. This PF contains all intrinsic aberrations present in our imaging system, including the purposefully introduced astigmatism. We follow the method detailed in [18] to retrieve the pupil function of this imaging setup. Using 100 nm TetraSpec fluorescent beads (Invitrogen) attached to the coverslip, we first measure the PSF. From the measured PSF we used 31 256 × 256 pixel images at different focal planes separated by about 126 nm to retrieve only the phase of the PF, shown in Fig. 1c, via an iterative method. Typically, about 20 iterations were needed for the algorithm to converge. As noted in [18] we observed that PSFs reconstructed with the retrieved PF appear sharper than our measured PSF. The difference is apparent by taking the ratio of the intensity optical transfer functions (OTFs) of the measured and reconstructed PSFs. We used this ratio to rescale our reconstructed PSFs.
Next, we added in sample-induced aberrations to the measured PF to calculate a new PF at a given imaging depth, d. This new PF can then be used to calculate a new 3D PSF. Fitting x-y slices of this new 3D PSF to an elliptical Gaussian at different z positions generates the appropriate calibration curve. Specifically, we compute the depth-dependent aberration due to the refractive-index-mismatch by considering the optical path length difference, ΔOPL, between an object in an index matched and an index mismatched medium.
| (1) |
We also consider the effect that the sample medium-glass interface has on the amplitude of incident light rays: attenuation due to Fresnel reflection and wavefront compression [18]. Together these factors attenuate the light by a factor A.
| (2) |
With these depth-dependent aberrations, we modify the retrieved pupil function:
| (3) |
and reconstruct the aberrated PSF [18]. Such a computed PSF is shown in Fig. 1b where the actual distance of an emitter beyond the coverslip into an aqueous medium is 4 μm. From the computed PSFs we can determine the z calibration curves as shown in Fig. 1d.
A couple features of the new z calibration curves are worth pointing out. First, the z position of a molecule corresponding to a particular measured point wx, wy will change depending on focal plane position, d. Second, the shape of the calibration curve in wx, wy will also change with d. While the previous correction method accounts for the first issue [12], it inadequately corrects for the second issue because it still uses the calibration curve acquired at the surface. Our method, on the other hand, provides detailed knowledge on the depth-dependent PSF without having to collect an extensive amount of calibration data.
As a test of our approach we took a 5 μm z-stack of 100 nm beads embedded in agarose. Using the nominal focal position, d′, determined from the piezo z stage when each bead appeared sharply in focus, we estimated its actual position, d. Those actual focal positions were then used to calculate the 3D PSF at each depth and determine the corresponding z calibration curve. These calibration curves allowed us to accurately determine the relative z position of the beads when scanning the stage around their actual focal positions.
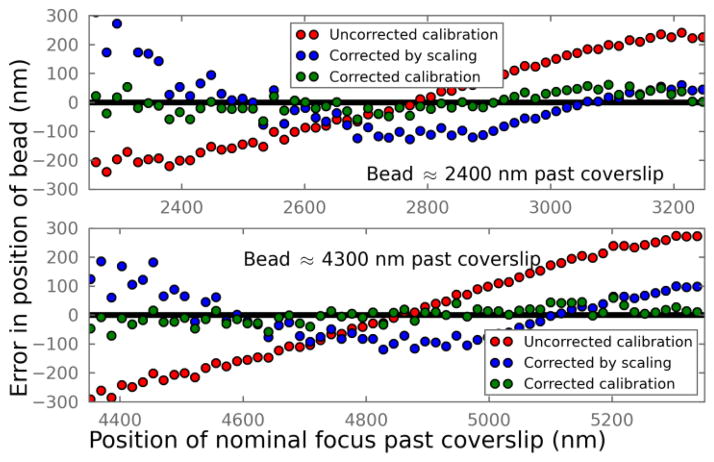
As seen in Fig. 2, when directly using the calibration curve taken at the surface, the error in z localization can be nearly 300 nm even when d is less than five microns. The previous correction method [12] reduces the error by linearly transform the z values obtained from the uncorrected calibration curve, but it still sees systematic deviations. Moreover, a large spread of the z values can be seen towards the left end of the axes, indicating a poor localization precision. In contrast, when using the corrected calibration curve at the corresponding focal plane, most localizations are within a couple tens of nanometers from the true positions.
Fig. 2.
Error in determined z positions of agarose-embedded beads that are physically about 2400 nm and 4300 nm past the coverslip. The difference between the calculated and the actual z positions of the beads are plotted. Red: directly using the uncorrected calibration curve acquired at the surface; Blue: after scaling the z coordinates as described in [12]; Green: using calculated, aberration-corrected calibration curves at the corresponding depths.
We demonstrate our approach to achieving accurate z localizations on STORM data of DNA labeled in a rat kangaroo kidney (PtK2) cell. We pulse labeled the cells with 5-ethynyl-2′-deoxyuridine (EdU), followed by click-reaction with Alexa Fluor 647 - azide. In this way, short stretches of DNA are fluorescently tagged in the nucleus. We imaged with a 100x 1.4 NA oil objective and the sample was mounted in aqueous STORM imaging buffer (PBS with 100 mM MEA, 5% glucose (wt/vol) and 1% oxygen scavenging system (0.5 mg/ml glucose oxidase and 0.04 mg/ml catalase)) with a refractive index of 1.34. We recorded data at six different focal plane positions starting from near the coverslip surface, each nominally separated by 500 nm. This step size led to an overlap between adjacent z slices. The fluorescently tagged DNA within the nucleus was found to be in enriched near the nuclear envelope for this cell. The size of the nucleus was approximately 15 μm by 24 μm in the x-y plane and 2.5 μm in the axial direction.
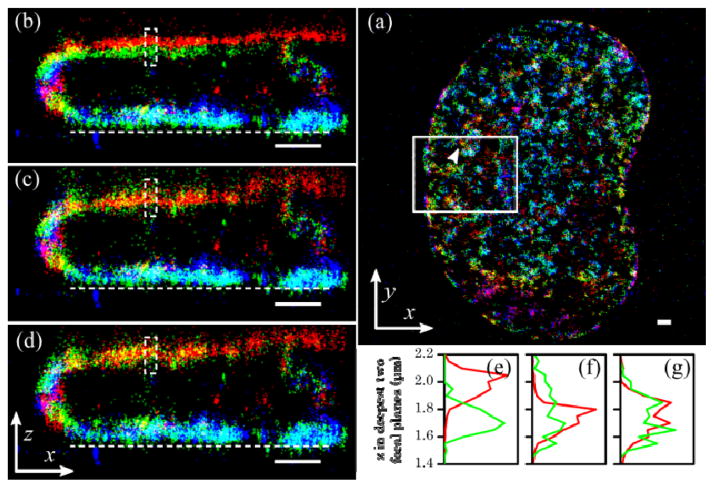
The reconstructed images are shown in Fig. 3. We used the three different methods to calculate the relative z position of the molecules to the focal plane. The data from all focal planes were combined by offsetting these z positions with the corresponding actual focal positions, d. Without accounting for the spherical aberration, the z projection of the same structures in the two deepest z slices were separated by more than 200 nm, making the DNA structures near the upper nuclear envelop appear discontinuous (Fig. 3b). For example, the mean position of localization points from the same short DNA segment was separated by 277 nm in these two slices (Fig. 3e). The linear correction method [12] could get these two z-slices aligned (Fig. 3c). Nevertheless, the two slices displayed drastically different spread in the z direction (Fig. 3f), which could lead to misinterpretation of the image. This artifact may be partially attributed to the different scaling applied to positive z’s in the lower slice (~2.5) and negative z’s in the higher slice (~1), and partially to a worse localization because the calibration curve does not match the true shape of the PSF. In contrast, z localization using the corrected calibration curves not only registered the two slices to within 25 nm (Fig. 3d and g), well below our localization precision, but also resulted in almost identical look of the structure in the two slices.
Fig. 3.
STORM image of labeled DNA in a PtK2 cell. STORM images were taken at six focal planes, each nominally separated by 500 nm. All scale bars are 1 μm in all dimensions shown. (a) The xy projection of the entire data set. (b–d) The xz projection of the solid boxed area in (a). The z coordinates are calculated with (b) uncorrected calibration, (c) after z-scaling [12], and (d) corrected calibration curves of each focal plane. The dashed line in (b–d) is the approximate position of the the coverslip surface. Each color corresponds to one the six focal planes from 0 to 2500 nm past the coverslip (blue-green-red-blue-green-red). (e-g) show the z distribution of molecules in the deepest two focal planes (red being the deepest) indicated by the arrowhead in (a) and within the dashed boxes in (b–d), respectively.
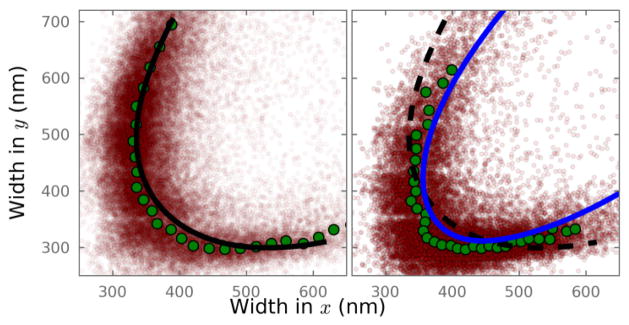
To further show that we are able to accurately recapture the depth-induced aberrations, we compared the wy − wx distribution of all molecules imaged with the calibration curves (Fig. 4). The calibration curve acquired at the coverglass surface aligns well with the molecules in the lowest z-slice, but clearly deviates from those in the deepest z-slice. In contrast, the corrected calibration curve is able to match the shape of the experimental data. However, although the calibration curve better captures the shape in wy − wx space of the experimental data, there is a small but evident systematic shift of the calculated calibration curve towards wider PSF widths compared to the experimental distribution. This shift is possibly caused by the fact that we acquired the calibration curve with 100 nm beads instead of true “point sources” such as individual fluorescent molecules. Our use of a scalar rather than vector model of light may further introduce errors. Investigating such sources of error is planned for future implementations of this method.
Fig. 4.

Plot of wx, wy for individual molecules recorded at two of the six focal planes shown in Fig. 3. (a) Data acquired at the focal plane closest to the coverslip. The black line is the z-calibration curve acquired using 100 nm beads at the coverslip. (b) Data acquired at a nominal focal position 2 μm beyond the coverslip. The dashed black line is the calibration curve from (a). The blue line is the corrected calibration curve taking into account the depth-dependent aberration. Plotted in green are the smoothed wx, wy coordinates from the measured red dots.
Though imaging microns past a refractive index mismatch will reduce localization precision, we show here that it need not produce inaccurate z localizations if correctly taken into consideration. Our method is easy to implement and is not restricted to astigmatism-based 3D localizations. The same principles could be applied to 3D localizations using biplane imaging or double-helix PSFs.
Future work includes investigating how depth-dependent aberrations may skew the PSF. It is clear that the astigmatic PSF is not truly Gaussian and skewness will produce errors in x and y localizations that likely depend on imaging depth. Characterizing such effects can easily be done using our method of calculating spherically aberrated PSFs using the retrieved PF.
Acknowledgments
This work was supported by NIH Director’s New Innovator Award (1DP2OD008479) and by California Institute of Quantitative Biology (QB3) at UCSF. J.S. acknowledges support from a Boehringer Ingelheim Fonds Ph.D. fellowship.
Footnotes
OCIS Codes: (180.6900) Three-dimensional microscopy, (100.6640) Superresolution, (220.1000) Aberration compensation
References
- 1.Hell SW. Microscopy and its focal switch. Nature Methods. 2009;6:24–32. doi: 10.1038/nmeth.1291. [DOI] [PubMed] [Google Scholar]
- 2.Huang B, Babcock H, Zhuang X. Breaking the Diffraction Barrier: Super-Resolution Imaging of Cells. Cell. 2010;143:1047–1058. doi: 10.1016/j.cell.2010.12.002. [DOI] [PMC free article] [PubMed] [Google Scholar]
- 3.Betzig E, Patterson GH, Sougrat R, Lindwasser OW, Olenych S, Bonifacino JS, Davidson MW, Lippincott-Schwartz J, Hess HF. Imaging Intracellular Fluorescent Proteins at Nanometer Resolution. Science. 2006;313:1642–1645. doi: 10.1126/science.1127344. [DOI] [PubMed] [Google Scholar]
- 4.Hess ST, Girirajan TPK, Mason MD. Ultra-High Resolution Imaging by Fluorescence Photoactivation Localization Microscopy. Biophysical Journal. 2006;91:4258–4272. doi: 10.1529/biophysj.106.091116. [DOI] [PMC free article] [PubMed] [Google Scholar]
- 5.Rust MJ, Bates M, Zhuang X. Sub-diffraction-limit imaging by stochastic optical reconstruction microscopy (STORM) Nature Methods. 2006;3:793–796. doi: 10.1038/nmeth929. [DOI] [PMC free article] [PubMed] [Google Scholar]
- 6.Juette MF, Gould TJ, Lessard MD, Mlodzianoski MJ, Nagpure BS, Bennett BT, Hess ST, Bewersdorf J. Three-dimensional sub–100 nm resolution fluorescence microscopy of thick samples. Nature Methods. 2008;5:527–529. doi: 10.1038/nmeth.1211. [DOI] [PubMed] [Google Scholar]
- 7.Pavani SRP, Thompson MA, Biteen JS, Lord SJ, Liu N, Twieg RJ, Piestun R, Moerner WE. Three-dimensional, single-molecule fluorescence imaging beyond the diffraction limit by using a double-helix point spread function. Proceedings of the National Academy of Sciences. 2009;106:2995–2999. doi: 10.1073/pnas.0900245106. [DOI] [PMC free article] [PubMed] [Google Scholar]
- 8.Kao HP, Verkman AS. Tracking of single fluorescent particles in three dimensions: Use of cylindrical optics to encode particle position. Biophysical Journal. 1994;67:1291–1300. doi: 10.1016/S0006-3495(94)80601-0. [DOI] [PMC free article] [PubMed] [Google Scholar]
- 9.Holtzer L, Meckel T, Schmidt T. Nanometric three-dimensional tracking of individual quantum dots in cells. Applied Physics Letters. 2007;90:053902. [Google Scholar]
- 10.Huang B, Wang W, Bates M, Zhuang X. Three-Dimensional Super-Resolution Imaging by Stochastic Optical Reconstruction Microscopy. Science. 2008;319:810–813. doi: 10.1126/science.1153529. [DOI] [PMC free article] [PubMed] [Google Scholar]
- 11.Gibson SF, Lanni F. Experimental test of an analytical model of aberration in an oil-immersion objective lens used in three-dimensional light microscopy. Journal of the Optical Society of America A. 1991;8:1601–1613. doi: 10.1364/josaa.9.000154. [DOI] [PubMed] [Google Scholar]
- 12.Huang B, Jones SA, Brandenburg B, Zhuang X. Whole-cell 3D STORM reveals interactions between cellular structures with nanometer-scale resolution. Nature Methods. 2008;5:1047–1052. doi: 10.1038/nmeth.1274. [DOI] [PMC free article] [PubMed] [Google Scholar]
- 13.Kner P, Sedat JW, Agard DA, Kam Z. High-resolution wide-field microscopy with adaptive optics for spherical aberration correction and motionless focusing. Journal of Microscopy. 2010;237:136–147. doi: 10.1111/j.1365-2818.2009.03315.x. [DOI] [PMC free article] [PubMed] [Google Scholar]
- 14.Izeddin I, El Beheiry M, Andilla J, Ciepielewski D, Darzacq X, Dahan M. PSF shaping using adaptive optics for three-dimensional single-molecule super-resolution imaging and tracking. Optics Express. 2012;20(5):4957–4967. doi: 10.1364/OE.20.004957. [DOI] [PubMed] [Google Scholar]
- 15.Deng Y, Shaevitz JW. Effect of aberration on height calibration in three-dimensional localization-based microscopy and particle tracking. Applied Optics. 2009;48:1886–1890. doi: 10.1364/ao.48.001886. [DOI] [PubMed] [Google Scholar]
- 16.Egner A, Hell SW. Aberrations in Confocal and Multi-Photon Fluorescence Microscopy Induced by Refractive Index Mismatch. In: Pawley JB, editor. Handbook of Biological Confocal Microscopy. Springer; 2006. pp. 404–413. [Google Scholar]
- 17.Puchner EM, Walter JM, Kasper R, Huang B, Lim WA. Counting molecules in single organelles with superresolution microscopy allows tracking of the endosome maturation trajectory. Proceedings of the National Academy of Sciences. 2013;110:16015–16020. doi: 10.1073/pnas.1309676110. [DOI] [PMC free article] [PubMed] [Google Scholar]
- 18.Hanser BM, Gustafsson MGL, Agard DA, Sedat JW. Phase-retrieved pupil functions in wide-field fluorescence microscopy. Journal of microscopy. 2004;216:32–48. doi: 10.1111/j.0022-2720.2004.01393.x. [DOI] [PubMed] [Google Scholar]


