

Abstract
Patients with established type 2 diabetes display both β-cell dysfunction and insulin resistance. To define fundamental processes leading to the diabetic state, we examined the relationship between type 2 diabetes risk variants at 37 established susceptibility loci, and indices of proinsulin processing, insulin secretion, and insulin sensitivity. We included data from up to 58,614 nondiabetic subjects with basal measures and 17,327 with dynamic measures. We used additive genetic models with adjustment for sex, age, and BMI, followed by fixed-effects, inverse-variance meta-analyses. Cluster analyses grouped risk loci into five major categories based on their relationship to these continuous glycemic phenotypes. The first cluster (PPARG, KLF14, IRS1, GCKR) was characterized by primary effects on insulin sensitivity. The second cluster (MTNR1B, GCK) featured risk alleles associated with reduced insulin secretion and fasting hyperglycemia. ARAP1 constituted a third cluster characterized by defects in insulin processing. A fourth cluster (TCF7L2, SLC30A8, HHEX/IDE, CDKAL1, CDKN2A/2B) was defined by loci influencing insulin processing and secretion without a detectable change in fasting glucose levels. The final group contained 20 risk loci with no clear-cut associations to continuous glycemic traits. By assembling extensive data on continuous glycemic traits, we have exposed the diverse mechanisms whereby type 2 diabetes risk variants impact disease predisposition.
Introduction
Type 2 diabetes is a metabolic disorder characterized by impaired insulin secretion and reduced sensitivity to the peripheral actions of insulin. Both genetic and environmental factors contribute to the development of type 2 diabetes (1), but the fundamental mechanistic defects contributing to the evolution of disease remain far from clear. Recently, genome-wide association efforts have extended the number of loci robustly implicated in type 2 diabetes risk to >60 (2–5). Each of these loci contains sequence variants that are causal for disease risk, and elucidation of the mechanisms through which these loci operate has the potential to reveal processes fundamental to disease pathogenesis.
To date, systematic review of the effects of disease risk variants on processes contributing to the diabetic state has mostly been restricted to the examination of basal indices of β-cell (BC) function or insulin sensitivity (2,3). These studies have demonstrated that most, but not all, of these loci exert their primary effects on disease risk through deficient insulin secretion rather than insulin resistance (IR) (2,4–6).
Further dissection of these mechanisms requires more intensive phenotyping in risk allele carriers and controls. In principle, such studies, particularly if performed in nondiabetic individuals, can provide readouts of the status of various aspects of intermediary metabolism. For example, disproportionately raised levels of circulating fasting proinsulin (PI), compared with those of fasting insulin (FI), reflect BC stress and impairment in early insulin processing. Fasting 32,33 split PI provides a more detailed assessment of the impact of genetic variants on insulin processing (7). Dynamic tests of insulin secretion following oral and/or intravenous glucose administration can provide insights into early BC dysfunction and loss of early insulin release (8). Studies of selected diabetes risk loci conducted using more refined dynamic measures of insulin secretion and/or sensitivity have, in the main, corroborated the broad inferences obtained from basal measures (9–13), but have often been underpowered with respect to more detailed mechanistic insights. To date, the most substantial effort to characterize the physiology of risk allele carriers involved a survey of 19 loci defined by their primary associations with quantitative glycemic traits, such as fasting glucose (FG) and FI, 8 of which were also type 2 diabetes risk loci (14). This study underscored the heterogeneity of genetic effects on glucose homeostasis.
Here we expand upon that study to examine the effect of a total of 37 type 2 diabetes risk loci across a broad range of quantitative measures of glycemic metabolism. To do this, within the Meta-Analyses of Glucose and Insulin-Related Traits Consortium (MAGIC), we have gathered basal and dynamic testing data from 15 studies providing detailed measures of insulin processing (fasting PI and 32,33 split PI), insulin secretion (insulinogenic index and acute insulin response [AIR]), insulin sensitivity (indices derived from oral and intravenous tests of glucose-stimulated insulin secretion) (15), and insulin clearance (C-peptide), and combined these with existing published data for FG, FI, and homeostasis model assessment (HOMA) data from the MAGIC meta-analysis of fasting traits (16). In doing so, we were able to demonstrate that the mechanisms of action of these various disease risk loci can be grouped into a number of specific categories.
Research Design and Methods
Contributing Studies
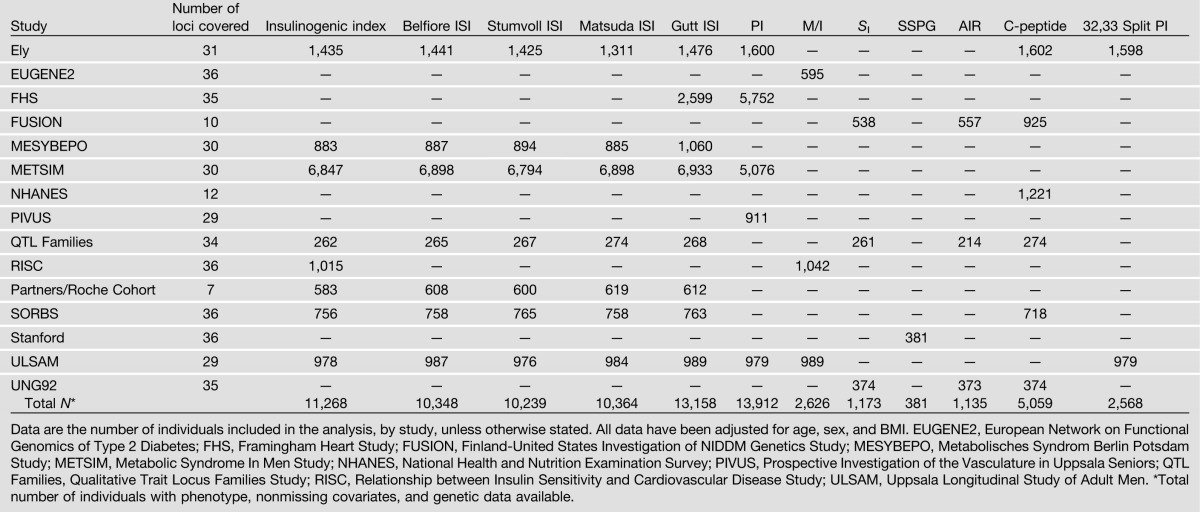
The following three partially overlapping collections of samples were used (Table 1, Supplementary Table 1): 1) nine studies with detailed physiologic basal and/or dynamic measures after oral glucose stimulation, from a total of 23,443 individuals; 2) twenty-nine studies, including up to 58,614 individuals, with fasting trait data available from the MAGIC genome-wide meta-analysis (16); and 3) seven studies, including 4,180 subjects, with intravenous-derived measures of insulin sensitivity. All participants were adult, nondiabetic (diabetes defined by clinical diagnosis, diabetes treatment, or fasting plasma glucose levels of ≥7.0 mmol/L), and of European ancestry. Individuals with impaired FG levels or impaired glucose tolerance were maintained in the analyses. Subjects provided informed consent, and all studies were approved by local ethics committees.
Table 1.
Studies and sample sizes of physiologic glycemic traits studied
Phenotypes
We collected available data from participating studies for any of 14 intermediate quantitative glycemic phenotypes, which were grouped as follows: (i) fasting glycemic traits including FG (Nmax = 58,614), FI (Nmax = 52,379), and derived HOMA indices of BC function (HOMA-B) and IR (HOMA-IR) (Nmax = 50,908) (16); (ii) oral glucose tolerance test (OGTT)-derived measures, including insulinogenic index (pmol/mmol, N = 11,268) and/or insulin sensitivity indices (ISIs) (Supplementary Table 1), including the Belfiore ISI (17) (Nmax = 10,348), the Stumvoll ISI (18) (Nmax = 10,239), the Matsuda ISI (19) (Nmax = 10,364), and the Gutt ISI (20) (Nmax = 13,158); (iii) circulating levels of fasting intact PI (pmol/L) adjusted for concomitant FI (pmol/L), measured in plasma or serum (Nmax = 13,912); (iv) intravenous measures (up to 4,180 individuals from seven studies), including glucose uptake divided by steady-state insulin concentration (M/I) derived from euglycemic-hyperinsulinemic clamp (Nmax = 2,626), insulin sensitivity index (SI) determined from the frequently sampled intravenous glucose tolerance test (Nmax = 1,173), and steady-state plasma glucose (SSPG) from the insulin suppression test (Nmax = 381); (v) AIR analyzed by the incremental area under the insulin curve from 0 to 10 min (Nmax = 1,135); and (vi) C-peptide levels (Nmax = 5,059) and 32,33 split PI (pmol/L) adjusted for concomitant FI (pmol/L; Nmax = 2,568) ([ii]–[vi] are summarized in Table 1).
Given the wide range of sample sizes available for different traits, we divided these 14 phenotypes into two groups based on a sample size cutoff of 10,000. This resulted in 10 “principal” traits with data from >10,000 individuals ([i]–[iii] above) and 4 traits with data on fewer individuals ([iv]–[vi] above). We focused initial analyses on the principal traits.
Trait Normalization
Insulinogenic index, ISIs, PI, AIR, C-peptide, and 32,33 split PI were naturally log-transformed. Intravenous insulin sensitivity measures (M/I, SI, and SSPG) were z score–transformed to enable meta-analysis as a single intravenous trait.
Single Nucleotide Polymorphism Definition and Proxies
We included 37 of the 38 type 2 diabetes–associated loci documented in the DIAGRAM consortium meta-analysis (2). This subset of known risk variants was selected given their relatively large effects on type 2 diabetes risk (earliest discovered variants), identification in individuals of European descent, and good representation on a genome-wide association study or custom genotype panels within the contributing studies. Variants at the fat mass– and obesity-associated gene (FTO) were excluded given the well-documented primary association with BMI, which mediates the effect of FTO on type 2 diabetes risk (21,22). None of the other 37 loci has evidence for primary BMI associations. At these 37 loci, we included data for the lead single nucleotide polymorphism (SNP) and a total of 126 alternative proxy SNPs. In studies where data for the lead SNP were not available, we chose the best proxy SNP for each locus on a study-specific basis, using r2 measures from CEU HapMap (23) (Supplementary Table 1). Quality control and exclusion criteria were as previously described (14) (Supplementary Note, Supplementary Table 1). Not all samples had called genotypes on the sex chromosomes, and as a result the maximum sample size for chromosome X locus DUSP9 was 7,642 individuals (i.e., <10,000). We thus excluded this locus from the main analyses.
Statistical Analysis
Linear regression was performed to test for association, under an additive genetic model, between SNPs and quantitative glycemic traits adjusting for age, sex, and BMI within each cohort. Cohort-specific effect estimates and SEs derived from the regression models were then combined in an inverse variance–weighted fixed-effects meta-analysis using GWAMA (24) or METAL (25). Associated P values are reported without correction for multiple testing. Two-sided P values <0.05 were considered to be significant given high prior probabilities for the association of established type 2 diabetes risk loci (reported previously at a genome-wide significance level of P < 5 × 10⁻⁸) with glycemic traits (2,4,26,27). To investigate the impact of risk variants on physiologic traits, for selected trait pairs, we plotted the standardized β-coefficient estimates of the effects to account for differences in trait transformations and the power of individual meta-analyses.
Cluster Analysis of Physiologic Traits and Type 2 Diabetes Loci
To explore the physiological basis of type 2 diabetes associations, we performed a primary cluster analysis using principal traits only and a subsidiary analysis that included all 14 traits. We also performed a cluster analysis of the 36 loci (excluding DUSP9), which grouped their effects on principal traits. We used meta-analysis z scores to perform complete linkage hierarchical clustering and aligned all effects to the disease risk–increasing allele. In this type of cluster analysis, the distance between two clusters is computed as the maximum distance between a pair of traits/SNPs that map in separate clusters (28). Locus clusters were defined by L2, a Euclidean distance dissimilarity measure. The uncertainty of hierarchical clustering was evaluated via multiscale bootstrap resampling (29). Ten thousand bootstrap replicates were generated to compute a probability for the strength of support for each dendrogram node and to evaluate topology sensitivity to sample size for each phenotype. We subsequently performed a centroid-based clustering analysis to identify the most supported number of clusters, where the full set of SNPs could be structured. In this clustering method, orthogonal transformation results in a reduced set of observations for each locus, translating 10 phenotypes to two linearly uncorrelated principal components. Dendrograms were created where markers were forced into k groups (from two to eight), and the Calinski index (30) was computed as a measure of clustering support. We then performed principal component analysis on centroid-based clustering results to visualize graphically the assignment of SNPs to inferred clusters.
Results
Association Meta-Analysis
After excluding DUSP9, we first examined the pattern of trait associations across the 36 remaining loci. First, we highlighted those specific trait-SNP associations with the strongest statistical support (Table 2 and Supplementary Tables 1 and 5). The strongest association was seen between type 2 diabetes risk alleles at the HHEX/IDE locus and reduced insulinogenic index (P = 4 × 10⁻²¹) (Supplementary Fig. 1A). We also confirmed genome-wide levels of significance for associations between 1) 32,33 split PI and ARAP1, and 2) insulinogenic index and MTNR1B, which were in line with previous findings in partially overlapping data sets (7,14,31–35), in addition to the established overlapping associations with basal FG, FI, and PI. Furthermore, we uncovered strong associations (which here we define as P < 5 × 10⁻⁵) among the following: 1) insulinogenic index and CDKAL1 (Supplementary Fig. 1B); 2) 32,33 split PI and HNF1A (Supplementary Fig. 1C); and 3) AIR and MTNR1B, KCNQ1, and CDKN2A/B (Supplementary Fig. 1D–F). For all variants showing at least nominal association (P < 0.05) with AIR, the diabetes risk allele reduced AIR. In the joint analysis of samples with intravenously derived indices of insulin sensitivity, nominally significant associations were observed between the disease risk allele and reduced insulin sensitivity for the IRS1 (P = 7 × 10⁻⁴) and ADCY5 (P = 6 × 10⁻³) loci (Table 2 and Supplementary Fig. 2A and B).
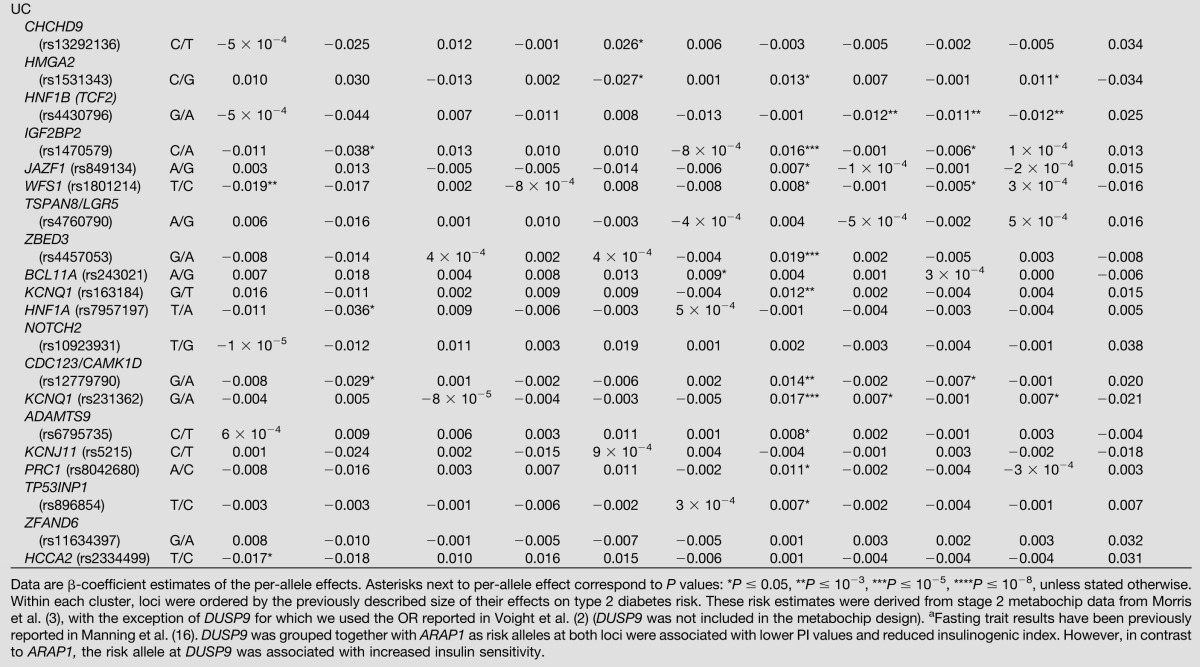
Table 2.
Effects of 37 SNPs previously associated with type 2 diabetes on physiologic glycemic measures
Cluster Analyses
Complete linkage cluster analysis focusing on the structure of trait relationships (Supplementary Fig. 3, principal traits, and Supplementary Fig. 4, all traits) confirmed that traits grouped in a meaningful manner were consistent with expected physiological relationships. We observed, for example, grouping of the four ISI measures and of HOMA-B and insulinogenic index. The Calinski index, which determines the best partitioning and the optimal number of these trait clusters, was maximal at eight, indicating no large subclusters (Supplementary Fig. 3B).
We next reclustered data, using principal traits only, to define relationships among the 36 type 2 diabetes loci (Fig. 1A). The unimodal distribution of the Calinski index was maximal at five, with the same number of groups emerging from an alternative clustering analysis based on centroids (Supplementary Fig. 5). Group assignment for the optimal Nclusters determined using the Calinski index was coherent with results from linkage clustering. On this basis, we defined four locus clusters with distinctive phenotypic features (Fig. 1B), which we termed as follows: IR; hyperglycemic (HG); PI processing; and BC. The twenty remaining loci not included in these phenotypic clusters we describe as forming an unclassified (UC) group. In bootstrap resampling (Fig. 1A), the baseline branching nodes were highly supported (strength P ≥ 0.84, with best support for a node defined as Pmax = 1.00, and absence of support as Pmin = 0) with the only exception of the PI group where there was slightly less evidence of separation from the BC-UC clade (strength P = 0.64).
Figure 1.

Cluster analysis of effects of 36 type 2 diabetes loci on principal physiologic traits. Clustering of traits with meta-analysis results from at least 10,000 individuals (principal traits). The existence of five clusters was revealed using two clustering approaches. A: Complete linkage dendrogram of type 2 diabetes SNPs with P values (%) indicating the robustness of each branching event (shown in red). We named the clusters as HG loci linked to reduced BC function after glucose stimulation, IR loci with a primary effect on IR at basal measurements, PI locus linked to decreased fasting PI, BC loci associated with defective BC function, and UC loci with no apparent impact on glycemic measures. Strong support exists for the baseline branching notes (strength P ≥ 0.84), whereas branching of IR from the BC-UC clade shows lesser evidence for support (strength P = 0.64). B: Calinski index computed on the centroid-based clustering of type 2 diabetes SNPs provides further evidence for the existence of five locus groups.
Four Clusters of Type 2 Diabetes Risk Loci With Distinctive Phenotypic Features
Here we describe the features of each of the four clusters. To visualize some of these groupings, Fig. 2 and Supplementary Fig. 6 present selected scatter plots of physiological trait pairs. Associated P values reported in the text are selected for illustrative purposes with full data detailed in Table 2 and Supplementary Tables 1 and 5.
Figure 2.

Scatter plots of standardized allelic effect size estimates for selected trait pairs. In each scatter plot, loci were assigned to the groups defined from the cluster analysis of principal traits (groups highlighted by different colors). A: Insulinogenic index vs. FI: this plot highlights the effects of loci linked to IR (PPARG, KLF14, IRS1, and GCKR) with respect to FI and insulinogenic index. B: Insulinogenic index vs. FG: the plot reveals the largest impact of HG loci (MTNR1B and GCK) on FG driven by reduced BC function. Large negative effects on insulinogenic index are also seen for CDKAL1 and HHEX/IDE, but with very modest effects on FG. C: HOMA-B vs. HOMA-IR: the plot shows the separation of the BC, HG, and IR clusters. Cluster group colors are as follows: HG, orange; IR, green; PI, pink; BC, red; UC, blue. Loci named in the box are coded numerically within the respective scatter plot.
The IR cluster contains four loci (IRS1, GCKR, PPARG, and KLF14) and is characterized by the association between type 2 diabetes risk alleles and reduced insulin sensitivity, as evidenced by higher HOMA-IR (IRS1 [P = 7 × 10⁻¹⁰], GCKR [P = 4 × 10⁻¹⁶], PPARG [P = 4 × 10⁻⁶], and KLF14 [P = 7 × 10⁻⁷]) and by reduced ISIs, with the strongest associations seen for decreased Matsuda ISI (IRS1 [P = 2 × 10⁻⁷], GCKR [P = 0.008], and PPARG [P = 0.004]). The IR loci also tended to show elevation of FG, FI, PI (IRS1 [P = 0.006], GCKR [P = 0.050]), and C-peptide levels (IRS1 [P = 0.01] and GCKR [P = 0.008]). We observed some evidence that carriers of risk alleles at these loci had higher values for HOMA-B (IRS1 [P = 3 × 10⁻⁷]) and insulinogenic index (IRS1 [P = 4 × 10⁻⁴]) (Fig. 2A and Supplementary Fig. 6A), which we interpret as likely to reflect, at least in truncated ascertainment among nondiabetic individuals (see DISCUSSION). Given access to data from the largest set of individuals yet characterized for intravenous indices of insulin sensitivity (Nmax = 4,180), we specifically evaluated the effects of IR loci on these measures. We observed an association between the disease risk variant at IRS1 and reduced intravenous measures of insulin sensitivity (P = 7 × 10⁻⁴) (Table 2), but no nominally significant associations were seen at GCKR, PPARG, or KLF14. Dropping either FI or HOMA-IR measures from the cluster analyses (these traits are highly correlated) had only subtle effects on cluster definitions and relationships: for example, in analyses that retain FI but exclude HOMA-IR, three loci, KCNQ1 [rs231362], JAZF1, and HMGA2 moved from the UC group to the IR cluster. Adjustment for BMI improved estimates of both basal and dynamic measures of insulin sensitivity (data not shown).
The HG cluster comprises the risk loci mapping near MTNR1B and GCK. Type 2 diabetes risk alleles at these loci are associated with markedly reduced insulin secretion, combined with fasting hyperglycemia, even in nondiabetic individuals (Fig. 2B). The insulin secretory defect is manifest in reduced levels of HOMA-B (MTNR1B [P = 4 × 10⁻²⁶] and GCK [P = 1 × 10⁻¹¹]), insulinogenic index (MTNR1B [P = 1 × 10⁻¹⁴], GCK [P = 0.03]) (Fig. 2B), and AIR (MTNR1B [P = 4 × 10⁻⁶], and GCK [P = 0.051]). There was some evidence for inverse associations with insulin sensitivity, with type 2 diabetes risk alleles associated with higher levels of HOMA-IR (MTNR1B [P = 0.002] and GCK [P = 4 × 10⁻⁴]) (Fig. 2C), but no consistent associations were found with ISIs or intravenous measures of insulin sensitivity.
The PI cluster actually consists of a single locus, ARAP1 (also named CENTD2). The key feature of this locus is that the type 2 diabetes risk allele is associated with lower levels of intact PI (P = 2 × 10−50) and 32,33 split PI (P = 1 × 10⁻⁸) (Supplementary Fig. 6B and C), combined with reduced levels of insulin secretion (insulinogenic index [P = 2 × 10⁻⁵] and HOMA-B [P = 3 × 10⁻⁶]) (Supplementary Fig. 6B and D) (7). Insulin sensitivity was also slightly reduced, as shown by lower ISIs, with Matsuda and Gutt ISIs being nominally significant (P = 0.033 and 0.050, respectively). Although excluded from the cluster analysis because of smaller sample size, risk alleles at DUSP9 were also associated with lower PI values (P = 0.035) (Table 2) and reduced insulinogenic index (P = 3 × 10⁻⁴), indicating that this locus may share some mechanistic overlap with ARAP1. However, in contrast to ARAP1, the risk allele at DUSP9 was associated with increased insulin sensitivity (e.g., Matsuda ISI, P = 9 × 10⁻⁴).
The nine loci in the BC cluster (TCF7L2, SLC30A8, HHEX/IDE, CDKAL1, CDKN2A/2B, THADA, DGKB, PROX1, and ADCY5) are characterized by reduced insulin secretion in the presence of increased PI and, in comparison with the HG cluster, only modest increases in fasting glycemia. For all nine loci, we observed associations with lower levels of HOMA-B (Fig. 2C), higher levels of FG, and lower levels of FI (Table 2). The strongest associations were seen at TCF7L2, but all loci also showed similar patterns of reduced insulinogenic index (Fig. 2B) and AIR (Supplementary Fig. 6E), as well as increased levels of PI (Supplementary Fig. 6C). There was little systematic evidence for effects on HOMA or intravenous measures of insulin sensitivity (Supplementary Fig. 6F), though the type 2 diabetes risk allele at ADCY5 displayed reduced sensitivity on intravenous measures (P = 6 × 10⁻³) (Supplementary Fig. 6F).
The UC group includes 20 loci for which, despite large sample sizes, detailed phenotyping, and established effects on risk for type 2 diabetes, no systematic evidence of association with basal or dynamic glycemic phenotypes was detected. The only nominal associations observed were at HNF1B (TCF2) (lower FI [P = 8 × 10⁻⁴]) (Table 2) and HNF1A (lower 32,33 split PI [P = 8 × 10⁻⁶] and insulinogenic index [P = 0.005]) (Table 2).
We observed no material difference in the overall picture of trait associations when we compared results from this study with those previously described by Ingelsson et al. (14) in partially overlapping samples at the eight loci examined in both.
Discussion
We present here the most comprehensive report to date concerning the role of type 2 diabetes risk loci on physiologic trait variability in nondiabetic individuals. In addition, this study includes the largest number of individuals phenotyped using gold standard intravenous-derived measures of insulin sensitivity. Through cluster analysis, we have shown that, in terms of diabetes risk allele effect size on intermediate glycemic traits, type 2 diabetes risk loci fall into five broad categories.
The IR cluster loci, including those mapping near PPARG, KLF14, IRS1, and GCKR, are characterized by consistent effects across multiple indices of insulin sensitivity, in both the basal and stimulated state. Three of the four IR loci (PPARG excluded) ranked in the lower half of type 2 diabetes risk loci in terms of effect size: this may indicate that some of the loci in the UC group act through weak effects on insulin sensitivity (as has indeed been suggested for HMGA2) (2). The observation that disease risk alleles at IR loci are associated with some degree of improved BC function (such as that measured by HOMA-B) is likely to reflect a combination of complementary factors. An increase in insulin secretion as a result of higher IR is a known physiological phenomenon, which occurs until individuals decompensate and shift toward the development of diabetes. Therefore, alleles that primarily raise IR may be secondarily associated with improved insulin secretion through a compensatory mechanism. In addition, the apparent association with insulin sensitivity may in part reflect the fact that analysis was restricted to nondiabetic subjects: this can lead to a truncation effect, whereby individuals with genotypes that favor both high IR and poor insulin secretion are preferentially depleted from the analysis because of their diabetes predisposition (6).
The PI cluster is limited to the type 2 diabetes risk variant at ARAP1, with the cardinal feature being a marked reduction in fasting PI levels in carriers of the disease risk allele. The combination of diabetes risk reduced basal and stimulated insulin secretion and reduced PI levels runs counter to the usual epidemiological associations (7). Our data therefore support previous assertions that the ARAP1 risk variant increases the risk of type 2 diabetes through defects in the early steps of insulin production (7).
The HG cluster includes loci characterized by a prominent reduction in basal and stimulated BC function (35–37), resulting in a marked increase in FG levels. This glycemic effect is consistent with the fact that the type 2 diabetes risk alleles at these loci are associated with modest reductions in basal insulin sensitivity (as measured by HOMA-IR). These associations with insulin action phenotypes did not, however, extend to the stimulated measures and may simply reflect limitations in the HOMA model. This cluster includes both GCK and MTNR1B, and, although they share similar features in terms of their effects on FG, HOMA-B, and insulin/glucagon ratios (11), external data suggest that these genes act through different mechanisms. In individuals with maturity onset diabetes of the young type 2 (38), severe loss-of-function mutations in GCK lead to impaired glucose sensing and a higher homeostatic set point for glucose. At MTNR1B, several studies have shown that lower insulin secretion is accompanied by markedly reduced insulin sensitivity (11) and increased insulin response to glucagon-like peptide 1 (39). The apparent lack of effects on PI measures for MTNR1B, as for GCK, points to an effect on the secretory function of BCs, rather than on PI processing (14).
The BC cluster includes a number of loci associated with defective insulin secretion but without the marked glycemic effects seen in the HG cluster. These include several of the loci with the strongest allelic effects on diabetes risk, such as those at TCF7L2, SLC30A8, CDKAL1, and CDKN2A/2B, suggesting that the distinction from the loci in HG cluster is not simply a consequence of the degree of allelic impact. Although the BC loci map to a single cluster, there is a degree of heterogeneity with respect to other traits. For example, disease risk alleles at TCF7L2 and SLC30A8 are associated with increased PI levels, reduced insulinogenic index, and lower FI levels, underscoring defects in insulin processing and secretion (7). In contrast, the risk alleles at HHEX/IDE, DGKB, CDKAL1, PROX1, and CDKN2A/2B display reduced insulinogenic index and AIR, with no effect on fasting PI levels, suggesting defects during the first phase of insulin response and early insulin secretion. These phenotypic associations within the BC cluster highlight the potential for further subdivision of loci according to pathophysiological patterns.
The UC group combines all remaining loci, which, although they are genome-wide significant for type 2 diabetes, display no discernible impact on glycemic measures across the large sample sets assembled here. Most of these loci rank in the lower half of signals in terms of type 2 diabetes effect size, and modest functional impact may offer a partial explanation for this observation. However, it is notable that the UC group includes many of the loci where the common variant effects are highly likely to be mediated by transcripts implicated in monogenic and syndromic forms of diabetes (including HNF1A, HNF1B [40], KCNJ11 [41], and WFS1 [42]). Thus, even in the setting where rare coding mutations result in severe abrogation of islet function, and common variants acting through those same genes influence type 2 diabetes risk to stringent levels of significance, those same common variants can also be compatible with normal glucose homeostasis (2).
This study combined information from a large number of individuals phenotyped using intravenous measures of insulin sensitivity, including >2,600 subjects examined using the gold standard euglycemic-hyperinsulinemic clamp. Overall, the data do not support the view that the combination of intravenous measures used in this study offers a sufficient boost in precision to compensate for the reduction in sample size when compared with the numbers available for the basal or OGTT-derived measures. Except at IRS1 and ADCY5, neither the intravenous measures nor the OGTT-derived ISIs generated powerful signals of association with deficient insulin action, even at loci where the existing evidence for an effect on insulin sensitivity is compelling (e.g., PPARG, KLF14 [2,43]).
The study presented here is the largest investigation of its kind published to date; we set out to maximize the sample size for each trait included. One consequence of this strategy is that the characteristics of the particular samples informative for each trait may differ, raising the possibility of artifacts when comparing genotypic associations across traits. However, the extent to which our findings are both internally consistent, and in broad agreement with published data describing more detailed phenotypic studies of individual variants, provides considerable reassurance. An alternative strategy, which restricted analyses to a small core of individuals with data available for all traits, would have resulted in a substantial loss of power.
We recognize some other limitations of this study, and of others of its kind. First, the complexity of the metabolic phenotypes examined, the longitudinal dimension of diabetes development and progression, and the relative imprecision of the experimental tools at our disposal limit the inferences that are possible. This is most obviously seen in the large numbers of loci, which though having genome-wide significance for type 2 diabetes, show no evidence of a relationship with intermediate metabolic traits. We also note, for example, that the measures of early insulin secretion used (insulinogenic index and AIR) may, in part, reflect insulin clearance, a trait that was not evaluated directly. Second, in the interests of avoiding the secondary effects of diabetes and its treatment, analyses were restricted to nondiabetic individuals: this is likely to have introduced some truncation effects such as the apparent enhancement of BC function for disease risk alleles disrupting insulin sensitivity. These have the potential to lead to incorrect inference, if not recognized as such (6,44). Third, the variants we have examined are not, in most cases, known to be causal for the association signals detected, leaving open the possibility that, at some loci, the causal alleles, once identified, may have more pronounced effects on intermediate traits than the variants studied here. Finally, additional recently published disease associations (3) of variants with lesser genetic effects were not considered. Future efforts to extend our study to incorporate these variants will likely require substantially larger sample sizes.
In summary, in this examination of the intermediate metabolic phenotypic associations of proven type 2 diabetes risk alleles, we have demonstrated that the loci fall into a limited number of broad mechanistic categories. These highlight the diverse mechanisms contributing to individual risk of disease. These data will guide future experimental studies that will use more specific, tailored tests to further dissect these key pathogenetic processes.
Article Information
Acknowledgments. The authors thank the many Finnish volunteers who generously participated in the Finland-United States Investigation of NIDDM Genetics, D2D, Health 2000, Finrisk 1987, Finrisk 2002, and Savitaipale studies from which we chose our FUSION GWA and replication cohorts (no overlap with Health 2000 replication cohort). The authors also thank Terry Gliedt and Peggy White for informatics and analysis support. The Center for Inherited Disease Research performed the GWA genotyping. The authors thank all subjects who participated in the Metabolisches Syndrom Berlin Potsdam Study; Marianne Deweider and Fredéric Allegaert for the DNA bank management; Philippe Gallina, Philippe Delfosse, and Sylvie Poulain for the recruitment of most obese adults; Department of Nutrition of Paris Hotel Dieu Hospital for the contribution to the recruitment effort; and Stéphane Lobbens for genotyping. The authors thank Dr. Sekar Kathiresan at the Massachusetts General Hospital and Broad Institute of Harvard and MIT for his collaboration in assembling the National Health and Nutrition Examination Survey (NHANES) DNA samples, and Jody E. McLean at the Division of Health and Nutrition Examination Surveys, National Center for Health Statistics, Centers for Disease Control and Prevention, for her assistance with the analysis of NHANES genetic data. The authors thank Roche Pharmaceuticals for its support and collaboration in assembling the Partners/Roche Cohort. The Genotyping for the Prospective Investigation of the Vasculature in Uppsala Seniors and the Uppsala Longitudinal Study of Adult Men were performed by the SNP&SEQ Technology Platform in Uppsala, Sweden (www.genotyping.se). The authors thank Tomas Axelsson, Ann-Christine Wiman, and Caisa Pöntinen for their excellent assistance with genotyping. The SNP Technology Platform is supported by Uppsala University, Uppsala University Hospital, and the Swedish Research Council for Infrastructures. The authors thank Knut Krohn (Microarray Core Facility of the Interdisciplinary Centre for Clinical Research, University of Leipzig) for the genotyping/analytical support and Joachim Thiery (Institute of Laboratory Medicine, Clinical Chemistry and Molecular Diagnostics, University of Leipzig) for clinical chemistry services. The authors thank Nigel W. Rayner (Wellcome Trust Centre for Human Genetics, University of Oxford) for excellent bioinformatics support.
Funding. The major funding for this meta-analysis was provided through the Seventh Framework Programme of the European Community (FP7/2007-2013), the ENGAGE project, and grant agreement HEALTH-F4-2007-201413. As part of the Ely Study, I.B. was supported by Wellcome Trust grant WT098051, the Cambridge Biomedical Research Centre of the U.K. National Institute for Health Research, and the Medical Research Council Centre for Obesity and Related Metabolic Diseases. The EUGENE2 Study was supported by grant LSHM-CT-2004-512013 from the European Community FP6 EUGENE2. The Framingham Heart Study was conducted in part using data and resources from the Framingham Heart Study of the National Heart, Lung, and Blood Institute of the National Institutes of Health (NIH) and Boston University School of Medicine. The analyses reflect intellectual input and resource development from the Framingham Heart Study investigators participating in the SNP Health Association Resource project. This work was partially supported by the National Heart, Lung, and Blood Institute's Framingham Heart Study (contract no. N01-HC-25195) and its contract with Affymetrix Inc. for genotyping services (contract no. N02-HL-6-4278). A portion of this research utilized the Linux Cluster for Genetic Analysis (LinGA-II), which is funded by the Robert Dawson Evans Endowment of the Department of Medicine at Boston University School of Medicine and Boston Medical Center. The Framingham Heart Study was also supported by National Institute of Diabetes and Digestive and Kidney Diseases (NIDDK) grant R01 DK-078616 to J.B.M., J.D., and J.C.F.; NIDDK grant K24 DK-080140 to J.B.M.; and a Doris Duke Charitable Foundation Clinical Scientist Development Award to J.C.F. Support for the Finland-United States Investigation of NIDDM Genetics was provided by NIH grants DK-069922 (to R.M.W.), U54 DA021519 (to R.M.W.), DK-062370 (to M.B.), and DK-072193 (to K.L.M.). Additional support comes from the National Human Genome Research Institute intramural project number 1 Z01 HG000024 (to F.S.C.). The Metabolisches Syndrom Berlin Potsdam (MESYBEPO) Study was supported by grants from Agence Nationale de la Recherche and Conseil Regional Nord-Pas de Calais/Fonds européen de développement économique et régional. Support for the Metabolic Syndrome in Men Study was provided by grant 124243 from the Academy of Finland. In the MESYBEPO Study, J.S. was supported by Clinical Research Group grant KFO218/1, Heisenberg Professorship SP716/2-1 of the Deutsche Forschungsgemeinschaft (DFG), and a research group on molecular nutrition of the German Bundesministerium für Bildung und Forschung (BMBF). The Partners/Roche Cohort was supported by the Mallinckrodt General Clinical Research Program, National Center for Research Resources, and NIH grant RR01066. In the Prospective Investigation of the Vasculature in Uppsala Seniors and the Uppsala Longitudinal Study of Adult Men, the SNP Technology Platform is supported by Uppsala University, Uppsala University Hospital, and the Swedish Research Council for Infrastructures. E.I. was supported by grants from the Swedish Research Council, the Swedish Heart-Lung Foundation, the Swedish Foundation for Strategic Research, and the Royal Swedish Academy of Science. The QTL families and UNG92 Study is supported by the Lundbeck Foundation Centre of Applied Medical Genomics for Personalized Disease Prediction, Prevention, and Care, The Danish Diabetes Association, and The Danish Research Council. The Relationship between Insulin Sensitivity and Cardiovascular Disease Study is supported by European Union grant QLG1-CT-2001-01252 and AstraZeneca. The Sorbs Study was supported by grants from the German Research Council (SFB-1052 “Obesity mechanisms”) and the German Diabetes Association and the Diabetes Hilfs und Forschungsfonds Deutschland. P.K. is funded by the Boehringer Ingelheim Foundation. The Integrated Research and Treatment Center Adiposity Diseases is supported by BMBF grant FKZ: 01EO1001. I.P. and V.L. were partially funded through the Seventh Framework Programme of the European Community (grant FP7/2007-2013) and the ENGAGE project grant agreement HEALTH-F4-2007-201413. R.M. is funded by the European Commission under the Marie Curie Intra-European Fellowship and a European Foundation for the Study of Diabetes New Horizons grant. M.I.M. is supported by Wellcome Trust grant 098381. Sample collection for the Stanford IST Cohort was carried out in part in the Clinical and Translational Research Unit, Stanford University, with funds provided by the National Center for Research Resources, NIH grant 2 M01 RR000070, and the U.S. Public Health Service. J.W.K. is supported by American Heart Association Fellow to Faculty Transition award 10FTF3360005.
Duality of Interest. J.B.M. currently serves on a consultancy board for Interleukin Genetics. R.M.W. has received consulting honoraria and receives research funding from Merck & Co., and receives research material support from Takeda Pharmaceuticals North America. J.C.F. has received consulting honoraria from Daiichi-Sankyo and AstraZeneca. I.B. and spouse own stock in GlaxoSmithKline and Incyte. No other potential conflicts of interest relevant to this article were reported.
Author Contributions. A.Ba., A.Be., A.S.D., J.C.F., M.-F.H., E.I., J.K., V.L., C.La., M.I.M., R.M., I.P., and R.M.W. wrote the manuscript. A.Ba., A.Be., A.S.D., J.D., V.L., C.La., M.I.M., R.M., I.P., and D.R. carried out meta-analysis, clustering, and higher level analysis of the data. (EUGENE2) H.-U.H., M.L., U.S.; (Ely) N.J.W.; (Framingham Heart Study) J.B.M.; (FUSION) M.B., R.N.B., F.S.C., K.L.M., J.T., R.M.W.; (MeSyBePo) J.S., A.F.H.P.; (METSIM) J.K., M.L.; (NHANES III)/(Partners/Roche Cohort) J.B.M.; (PIVUS) E.I., L.L.; (QTL/UNG92) T.H., O.P.; (RISC) M.W.; (Sorbs) M.S.; (Stanford IST) T.Q.; (ULSAM) E.I.; and S.R.B., S.C., P.E.H.S. designed, managed, and coordinated the project. (EUGENE2) H.-U.H., M.L., U.S.; (Ely) N.J.W.; (Framingham Heart Study) J.B.M., J.C.F.; (FUSION) R.N.B., J.T.; (MESYBEPO) J.S., A.F.-R.; (METSIM) A.S., J.K., M.L.; (NHANES III)/(Partners/Roche) J.B.M.; (PIVUS) E.I., L.L.; (QTL/UNG92) T.W.B., T.H.; (RISC) M.W.; (Sorbs) A.T.; (Stanford IST) T.Q., F.A.A.; (ULSAM) E.I.; and P.F., J.G., S.C. conducted phenotyping. (EUGENE2) H.-U.H., M.L., U.S.; (Ely) I.B., S.B., F.P.; (Framingham Heart Study) J.D., J.B.M.; (FUSION) L.L.B., M.R.E., A.J.S., N.N., M.A.M., P.S.C.; (M-A) M.I.M.; (METSIM) L.L.B., M.R.E., A.J.S., N.N., M.A.M., P.S.C.; (NHANES III)/(Partners/Roche) J.B.M.; (PIVUS) E.I.; (QTL/UNG92) N.G.; (RISC) M.W.; (Sorbs) P.K., Y.B.; (Stanford IST) T.L.A., J.W.K., K.H., X.Y.; and (ULSAM) E.I.; and P.F. carried out genotyping. (Ely) C.La., A.Ba.; (Framingham Heart Study) J.D., D.R., M.-F.H., J.C.F.; (FUSION) A.U.J., H.M.S.; (M-A) A.S.D.; (MESYBEPO) J.S., A.F.-R.; (METSIM) A.U.J., H.M.S.; (NHANES III)/(Partners/Roche) J.B.M.; (PIVUS) E.I., C.S.; (QTL/UNG92) N.G., T.W.B.; (Sorbs) A.S.D., I.P., R.M., V.L.; (Stanford IST) T.L.A., J.W.K, F.A.A., K.H., X.Y.; and (ULSAM) E.I.; and C.S., C.Le., and D.M. carried out initial data analysis. All authors have read and approved the manuscript. A.S.D. and I.P. are the guarantors of this work and, as such, had full access to all the data in the study and take responsibility for the integrity of the data and the accuracy of the data analysis.
Footnotes
This article contains Supplementary Data online at http://diabetes.diabetesjournals.org/lookup/suppl/doi:10.2337/db13-0949/-/DC1.
See accompanying article, p. 1836.
References
- 1.Stumvoll M, Goldstein BJ, van Haeften TW. Type 2 diabetes: principles of pathogenesis and therapy. Lancet 2005;365:1333–1346 [DOI] [PubMed] [Google Scholar]
- 2.Voight BF, Scott LJ, Steinthorsdottir V, et al. MAGIC Investigators. GIANT Consortium Twelve type 2 diabetes susceptibility loci identified through large-scale association analysis. Nat Genet 2010;42:579–589 [DOI] [PMC free article] [PubMed] [Google Scholar]
- 3.Morris AP, Voight BF, Teslovich TM, et al. Wellcome Trust Case Control Consortium. Meta-Analyses of Glucose and Insulin-related traits Consortium (MAGIC) Investigators. Genetic Investigation of ANthropometric Traits (GIANT) Consortium. Asian Genetic Epidemiology Network–Type 2 Diabetes (AGEN-T2D) Consortium. South Asian Type 2 Diabetes (SAT2D) Consortium. DIAbetes Genetics Replication And Meta-analysis (DIAGRAM) Consortium Large-scale association analysis provides insights into the genetic architecture and pathophysiology of type 2 diabetes. Nat Genet 2012;44:981–990 [DOI] [PMC free article] [PubMed] [Google Scholar]
- 4.Dupuis J, Langenberg C, Prokopenko I, et al. DIAGRAM Consortium. GIANT Consortium. Global BPgen Consortium. Anders Hamsten on behalf of Procardis Consortium. MAGIC Investigators New genetic loci implicated in fasting glucose homeostasis and their impact on type 2 diabetes risk. Nat Genet 2010;42:105–116 [DOI] [PMC free article] [PubMed] [Google Scholar]
- 5.Billings LK, Florez JC. The genetics of type 2 diabetes: what have we learned from GWAS? Ann N Y Acad Sci 2010;1212:59–77 [DOI] [PMC free article] [PubMed] [Google Scholar]
- 6.Florez JC. Newly identified loci highlight beta cell dysfunction as a key cause of type 2 diabetes: where are the insulin resistance genes? Diabetologia 2008;51:1100–1110 [DOI] [PubMed] [Google Scholar]
- 7.Strawbridge RJ, Dupuis J, Prokopenko I, et al. DIAGRAM Consortium. GIANT Consortium. MuTHER Consortium. CARDIoGRAM Consortium. C4D Consortium Genome-wide association identifies nine common variants associated with fasting proinsulin levels and provides new insights into the pathophysiology of type 2 diabetes. Diabetes 2011;60:2624–2634 [DOI] [PMC free article] [PubMed] [Google Scholar]
- 8.Ashcroft FM, Rorsman P. Diabetes mellitus and the β cell: the last ten years. Cell 2012;148:1160–1171 [DOI] [PMC free article] [PubMed] [Google Scholar]
- 9.Banasik K, Hollensted M, Andersson E, et al. The effect of FOXA2 rs1209523 on glucose-related phenotypes and risk of type 2 diabetes in Danish individuals. BMC Med Genet 2012;13:10. [DOI] [PMC free article] [PubMed] [Google Scholar]
- 10.Grarup N, Overvad M, Sparsø T, et al. The diabetogenic VPS13C/C2CD4A/C2CD4B rs7172432 variant impairs glucose-stimulated insulin response in 5,722 non-diabetic Danish individuals. Diabetologia 2011;54:789–794 [DOI] [PubMed] [Google Scholar]
- 11.Jonsson A, Ladenvall C, Ahluwalia TS, et al. Effects of common genetic variants associated with type 2 diabetes and glycemic traits on α- and β-cell function and insulin action in man. Diabetes 2013;62:2978–2983 [DOI] [PMC free article] [PubMed] [Google Scholar]
- 12.Nielsen T, Sparsø T, Grarup N, et al. Diabetes Genetics Replication and Meta-analysis (DIAGRAM) Consortium Type 2 diabetes risk allele near CENTD2 is associated with decreased glucose-stimulated insulin release. Diabetologia 2011;54:1052–1056 [DOI] [PubMed] [Google Scholar]
- 13.Wagner R, Dudziak K, Herzberg-Schäfer SA, et al. Glucose-raising genetic variants in MADD and ADCY5 impair conversion of proinsulin to insulin. PLoS One 2011;6:e23639. [DOI] [PMC free article] [PubMed] [Google Scholar]
- 14.Ingelsson E, Langenberg C, Hivert MF, et al. MAGIC Investigators Detailed physiologic characterization reveals diverse mechanisms for novel genetic Loci regulating glucose and insulin metabolism in humans. Diabetes 2010;59:1266–1275 [DOI] [PMC free article] [PubMed] [Google Scholar]
- 15.Ferrannini E, Mari A. How to measure insulin sensitivity. J Hypertens 1998;16:895–906 [DOI] [PubMed] [Google Scholar]
- 16.Manning AK, Hivert MF, Scott RA, et al. DIAbetes Genetics Replication And Meta-analysis (DIAGRAM) Consortium. Multiple Tissue Human Expression Resource (MUTHER) Consortium A genome-wide approach accounting for body mass index identifies genetic variants influencing fasting glycemic traits and insulin resistance. Nat Genet 2012;44:659–669 [DOI] [PMC free article] [PubMed] [Google Scholar]
- 17.Belfiore F, Iannello S, Volpicelli G. Insulin sensitivity indices calculated from basal and OGTT-induced insulin, glucose, and FFA levels. Mol Genet Metab 1998;63:134–141 [DOI] [PubMed] [Google Scholar]
- 18.Stumvoll M, Mitrakou A, Pimenta W, et al. Use of the oral glucose tolerance test to assess insulin release and insulin sensitivity. Diabetes Care 2000;23:295–301 [DOI] [PubMed] [Google Scholar]
- 19.Matsuda M, DeFronzo RA. Insulin sensitivity indices obtained from oral glucose tolerance testing: comparison with the euglycemic insulin clamp. Diabetes Care 1999;22:1462–1470 [DOI] [PubMed] [Google Scholar]
- 20.Gutt M, Davis CL, Spitzer SB, et al. Validation of the insulin sensitivity index (ISI(0,120)): comparison with other measures. Diabetes Res Clin Pract 2000;47:177–184 [DOI] [PubMed] [Google Scholar]
- 21.Fall T, Hägg S, Mägi R, et al. European Network for Genetic and Genomic Epidemiology (ENGAGE) consortium The role of adiposity in cardiometabolic traits: a mendelian randomization analysis. PLoS Med 2013;10:e1001474. [DOI] [PMC free article] [PubMed] [Google Scholar]
- 22.Frayling TM, Timpson NJ, Weedon MN, et al. A common variant in the FTO gene is associated with body mass index and predisposes to childhood and adult obesity. Science 2007;316:889–894 [DOI] [PMC free article] [PubMed] [Google Scholar]
- 23.International HapMap Consortium A haplotype map of the human genome. Nature 2005;437:1299–1320 [DOI] [PMC free article] [PubMed] [Google Scholar]
- 24.Mägi R, Morris AP. GWAMA: software for genome-wide association meta-analysis. BMC Bioinformatics 2010;11:288. [DOI] [PMC free article] [PubMed] [Google Scholar]
- 25.Willer CJ, Li Y, Abecasis GR. METAL: fast and efficient meta-analysis of genomewide association scans. Bioinformatics 2010;26:2190–2191 [DOI] [PMC free article] [PubMed] [Google Scholar]
- 26.Prokopenko I, Langenberg C, Florez JC, et al. Variants in MTNR1B influence fasting glucose levels. Nat Genet 2009;41:77–81 [DOI] [PMC free article] [PubMed] [Google Scholar]
- 27.Zeggini E, Scott LJ, Saxena R, et al. Wellcome Trust Case Control Consortium Meta-analysis of genome-wide association data and large-scale replication identifies additional susceptibility loci for type 2 diabetes. Nat Genet 2008;40:638–645 [DOI] [PMC free article] [PubMed] [Google Scholar]
- 28.Everitt BS, Landau S, Leese M. Cluster Analysis.4th ed London, Arnold, 2001 [Google Scholar]
- 29.Shimodaira H. Approximately unbiased tests of regions using multistep-multiscale bootstrap resampling. Ann Stat 2004;32:2616–2641 [Google Scholar]
- 30.Caliński T, Harabasz J. A dendrite method for cluster analysis. Commun Stat 1974;3:1–27 [Google Scholar]
- 31.González-Sánchez JL, Martínez-Larrad MT, Zabena C, Pérez-Barba M, Serrano-Ríos M. Association of variants of the TCF7L2 gene with increases in the risk of type 2 diabetes and the proinsulin:insulin ratio in the Spanish population. Diabetologia 2008;51:1993–1997 [DOI] [PubMed] [Google Scholar]
- 32.Kirchhoff K, Machicao F, Haupt A, et al. Polymorphisms in the TCF7L2, CDKAL1 and SLC30A8 genes are associated with impaired proinsulin conversion. Diabetologia 2008;51:597–601 [DOI] [PubMed] [Google Scholar]
- 33.Loos RJ, Franks PW, Francis RW, et al. TCF7L2 polymorphisms modulate proinsulin levels and beta-cell function in a British Europid population. Diabetes 2007;56:1943–1947 [DOI] [PMC free article] [PubMed] [Google Scholar]
- 34.Stolerman ES, Manning AK, McAteer JB, et al. TCF7L2 variants are associated with increased proinsulin/insulin ratios but not obesity traits in the Framingham Heart Study. Diabetologia 2009;52:614–620 [DOI] [PMC free article] [PubMed] [Google Scholar]
- 35.Lyssenko V, Nagorny CL, Erdos MR, et al. Common variant in MTNR1B associated with increased risk of type 2 diabetes and impaired early insulin secretion. Nat Genet 2009;41:82–88 [DOI] [PMC free article] [PubMed] [Google Scholar]
- 36.Langenberg C, Pascoe L, Mari A, et al. RISC Consortium Common genetic variation in the melatonin receptor 1B gene (MTNR1B) is associated with decreased early-phase insulin response. Diabetologia 2009;52:1537–1542 [DOI] [PMC free article] [PubMed] [Google Scholar]
- 37.Matschinsky FM. Regulation of pancreatic beta-cell glucokinase: from basics to therapeutics. Diabetes 2002;51(Suppl. 3):S394–S404 [DOI] [PubMed] [Google Scholar]
- 38.Fajans SS, Bell GI, Polonsky KS. Molecular mechanisms and clinical pathophysiology of maturity-onset diabetes of the young. N Engl J Med 2001;345:971–980 [DOI] [PubMed] [Google Scholar]
- 39.Simonis-Bik AM, Nijpels G, van Haeften TW, et al. Gene variants in the novel type 2 diabetes loci CDC123/CAMK1D, THADA, ADAMTS9, BCL11A, and MTNR1B affect different aspects of pancreatic beta-cell function. Diabetes 2010;59:293–301 [DOI] [PMC free article] [PubMed] [Google Scholar]
- 40.Bell GI, Polonsky KS. Diabetes mellitus and genetically programmed defects in beta-cell function. Nature 2001;414:788–791 [DOI] [PubMed] [Google Scholar]
- 41.Gloyn AL, Pearson ER, Antcliff JF, et al. Activating mutations in the gene encoding the ATP-sensitive potassium-channel subunit Kir6.2 and permanent neonatal diabetes. N Engl J Med 2004;350:1838–1849 [DOI] [PubMed] [Google Scholar]
- 42.Awata T, Inoue K, Kurihara S, et al. Missense variations of the gene responsible for Wolfram syndrome (WFS1/wolframin) in Japanese: possible contribution of the Arg456His mutation to type 1 diabetes as a nonautoimmune genetic basis. Biochem Biophys Res Commun 2000;268:612–616 [DOI] [PubMed] [Google Scholar]
- 43.Small KS, Hedman AK, Grundberg E, et al. GIANT Consortium. MAGIC Investigators. DIAGRAM Consortium. MuTHER Consortium Identification of an imprinted master trans regulator at the KLF14 locus related to multiple metabolic phenotypes. Nat Genet 2011;43:561–564 [DOI] [PMC free article] [PubMed] [Google Scholar]
- 44.Helgason A, Pálsson S, Thorleifsson G, et al. Refining the impact of TCF7L2 gene variants on type 2 diabetes and adaptive evolution. Nat Genet 2007;39:218–225 [DOI] [PubMed] [Google Scholar]