Abstract
The angle-independent myocardial elastography, which shows good performance in our proposed theoretical framework using a three-dimensional, ultrasonic image formation model based on well-developed, 3D finite-element, canine, left-ventricular models in both normal and left-circumflex ischemic cases, is employed as well as validated in vivo to assess the contractility of normal and pathological myocardia. Angle-independent myocardial elastography consists of: 1) iterative estimation of in-plane and out-of-plane cumulative displacements during systole using 1D cross-correlation and recorrelation techniques in a 2D search; 2) calculation of in-plane finite strains from the in-plane cumulative motion; and 3) computation of in-plane principal strains from the finite strains by solving the eigenvalue problem with a classification strategy. The in vivo raw data of healthy and pathological human left ventricles were acquired at 136 fps in a short-axis view. Similar to theory, the elastographic estimates in normal clinical cases showed radial wall thickening and circumferential shortening during systole through principal strain imaging, while those in a pathological case showed the opposite phenomenon. The feasibility of angle-independent myocardial elastography with an automated contour tracking method was shown through imaging of the myocardial deformation, and principal strains were proven essential in the reliable characterization and differentiation of abnormal from normal myocardia, without any angular dependence.
Keywords: Angle-independent, cross-correlation, eigenvalue, elastography, finite-element, infarct, ischemia, left ventricle, myocardial, principal, strain
2.1 Introduction
Myocardial Elastography (ME), a radio-frequency (RF) based speckle tracking technique, has been shown capable of assessing normal myocardial deformation [1] and detecting abnormal myocardial function [2], due to ischemia or infarction, through imaging and estimation of myocardial deformation during natural contraction of the myocardium at each heartbeat. We have previously proposed a theoretical framework, which showed a very good performance of ME in accurately depicting in-plane deformation using both two-dimensional (2D) and 3-dimensional (3D) ultrasonic image formation models as well as an established 3D, finite-element (FE) left-ventricular model, in both normal and left-circumflex (LCx) ischemic conditions [3]. Not only was ME shown to accurately estimate the myocardial displacements and (Cartesian and polar) strains using that theoretical model, but it could also differentiate abnormal from normal cardiac muscle, without a beam-to-muscle angle dependence through principal strain imaging [4, 5].
In this paper, we evaluate the robustness of principal strain imaging on the depiction of myocardial deformation at multiple short-axis slices in the 3D theoretical framework, and focus on the full depiction of in-plane myocardial deformation, including displacements, Cartesian finite strains and principal strains. Finally, the angle-independent ME is validated in both normal and pathological subjects in vivo.
2.2 Methods
2.2.1 Theoretical Analysis
2.2.1.1 3D Finite-Element Models
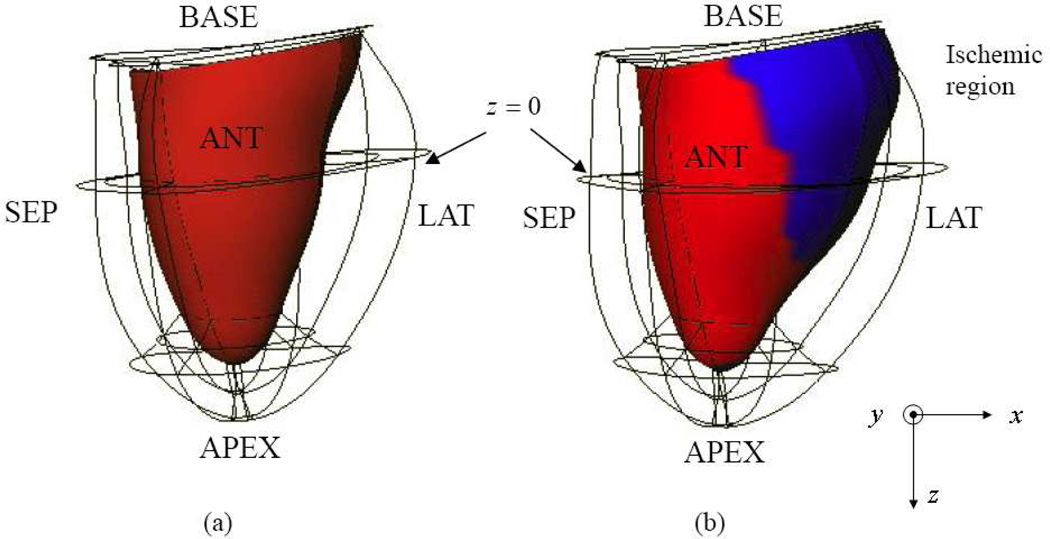
Three-dimensional FE models of the normal (Control) and left circumflex (LCx) ischemic canine left ventricles (LV) shown in Fig. 1 have been employed to demonstrate the feasibility of our previously proposed myocardial elastography method [3, 6]. More details regarding the FE models were described in [3]. Contrary to what typically occurred in vivo, the left ventricle was modeled moving towards the base during systole, since the models were developed based on open-chest dog experiments.
Fig. 1.
Anterior views at end-systole (ES): (a) normal and (b) left-circumflex ischemic (LCx) models shown in Cartesian coordinates (x, y, z), where x, y and z represent lateral, axial and elevational directions, respectively. Endo- and epicardium are represented by red shading and the wire frame, respectively. The ischemic region (blue shading) is located in the posterior-lateral wall.
2.2.1.2 3D Ultrasonic Image Formation Model
A 3D RF image was generated by convolving a 3D scatterer distribution with a 3D point-spread function [7]. The defined 2D linear array consisted of 128 and 6 elements in the lateral and elevational directions, respectively. The elevational beamwidth was 2 mm, which was considered to give optimal established trade-offs in myocardial elastography [3, 6]. In both FE cases, RF signals in five short-axis slices, from basal to apical levels, were generated using a linear array with a center frequency of 2 MHz and a 60% fractional bandwidth. The scatterers were assumed to be uniformly distributed at 96 scatterers per cubic wavelength in order to simulate full speckle scattering. The cavity and background were assumed to have null scattering. Each simulated RF image had a field of view of 80×80×6 mm3.
2.2.2 Ultrasound Myocardial Elastography
2.2.2.1 Speckle Tracking
The two in-plane, orthogonal displacement components (lateral and axial) were estimated using one-dimensional (1D) cross-correlation and recorrelation of RF signals in a 2D search [3, 6]. The cross-correlation technique employed a 1D matching kernel of 3 mm and 80% overlap in the simulation. A matching kernel of 7.7mm and 80% overlap were used for the clinical data presented. The 1D matching kernel determines the signal-to-noise ratio (SNR) of the estimates [8]. The window shift, or overlap was assumed to indicate the expected elastographic resolution as reported in the literature [9]. A larger matching kernel leads to an SNR increase, while a smaller window shift improves the resolution. The window shift utilized in both simulation and experiments in this paper was chosen to provide good resolution. Therefore, with an appropriate selection of the window size and window shift, high SNR and resolution of the estimates can be achieved simultaneously.
An 8:1 linear interpolation scheme on the original RF signal segments was employed to improve lateral tracking resolution [10]. Cosine interpolation was then applied around the peak of the cross-correlation function for a more refined peak search [10]. In the 3D case, the elevational displacement was estimated in the elevational-axial plane using the same strategy. The correction (or, recorrelation) in axial displacement estimation [3, 6], was performed to reduce the lateral/elevational decorrelation resulting from axial motion. The incremental displacements were integrated to obtain the cumulative displacement that occurred from ED to ES [3, 6].
2.2.2.2 Cartesian Finite Strains
In-plane Lagrangian finite strains can be calculated from the in-plane displacements [3, 6]. In myocardial elastography, a least-squares strain estimator (LSQSE) [11] in both lateral and axial directions was used to improve the elastographic signal-to-noise ratio (SNRe).
2.2.2.3 Principal Strains
The 2D strain tensor computation is highly dependent on the orientation of the imaging beam relative to the ventricular wall (Fig. 1) [4, 5]. This complicated the interpretation of the direction of in-plane myocardial deformation and potentially resulted in clinical misdiagnoses [4, 5]. Even though angle-independent measures such as polar (i.e., radial and circumferential) strains were demonstrated capable of detecting the abnormal myocardium, principal strains were employed owing to its angle-independency by their definition and lower centroid-dependence than polar strains [4, 5]. Considering a 2D short-axis slice of the myocardium, solving the eigenvalue/eigenvector problem for the 2D finite strain tensor could yield two principal strains (eigenvalues) corresponding to two principal axes (eigenvectors), which closely approximated strains in the radial and circumferential directions [12]. Note that the two principal strains were classified according to their angles between principal (i.e., eigenvectors) and polar (i.e., radial and circumferential) directions [5]. Therefore, the 1st and 2nd classified principal strains closely approximated radial and circumferential strains, respectively.
2.2.2.4 Automated Contour Tracking
The myocardial segmentation on the elastographic images of human subjects throughout the entire cardiac cycle was performed and extended from the 1D axial direction to 2D using the automated method proposed by Luo and Konofagou [13]. The endo- and epi-cardial contours on the initial echocardiography (i.e., at ED) were manually traced with 20 points each as the reference, while those for the rest of the frames were extracted according to the estimated 2D displacement components. The automated contour tracking benefited from 2D elastographic estimates.
Estimation errors for displacements and strains could be calculated using the mean absolute percentage error (MAPE) between FE values and elastographic estimates. Note that MAPE’s in this paper were obtained within a region of interest but excluding the artifacts at the endo- and epicardial borders in order to avoid bias errors around the boundaries.
2.2.3 High Frame Rate Ultrasound Data Acquisition
A clinical echocardiography ultrasound scanner (GE Vivid FiVe, GE Vingmed Ultrasound, Horten, Norway) with a phased array probe (FPA 2.5MHz 1C) was used to acquire cardiac ultrasound in-phase and quadrature (I/Q) data in 2D SA views at the papillary muscle level from healthy and pathological subjects at a frame rate of 136 fps. The I/Q data were modulated to retrieve the RF signals. The frame-rate of 136 fps was achieved based on a novel electrocardiogram (ECG)-gated composite imaging, which assembled multiple small sector data into a full-view echocardiogram and was implemented by our group [14]. Slightly different from the fully automated method [14], in this study, five or six sectors with a reduced field of view (FOV) were manually selected and combined off-line based on the spatial (i.e., depth and angle) and ECG information to reconstruct an entire SA echocardiograms using the GE system.
2.3 Results
2.3.1 Finite-Element (FE) Results
2.3.1.1 Control Model
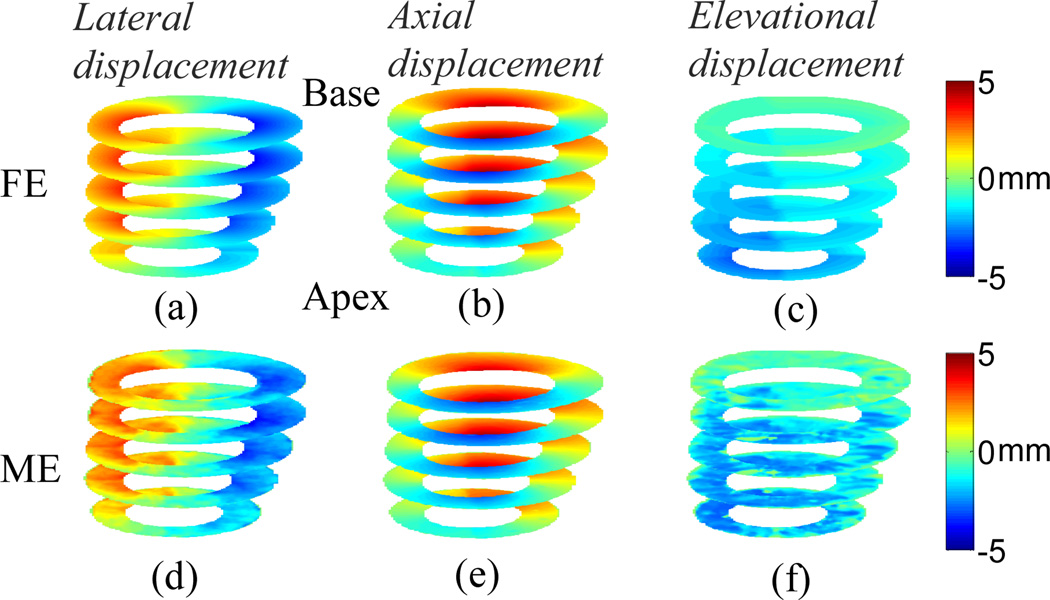
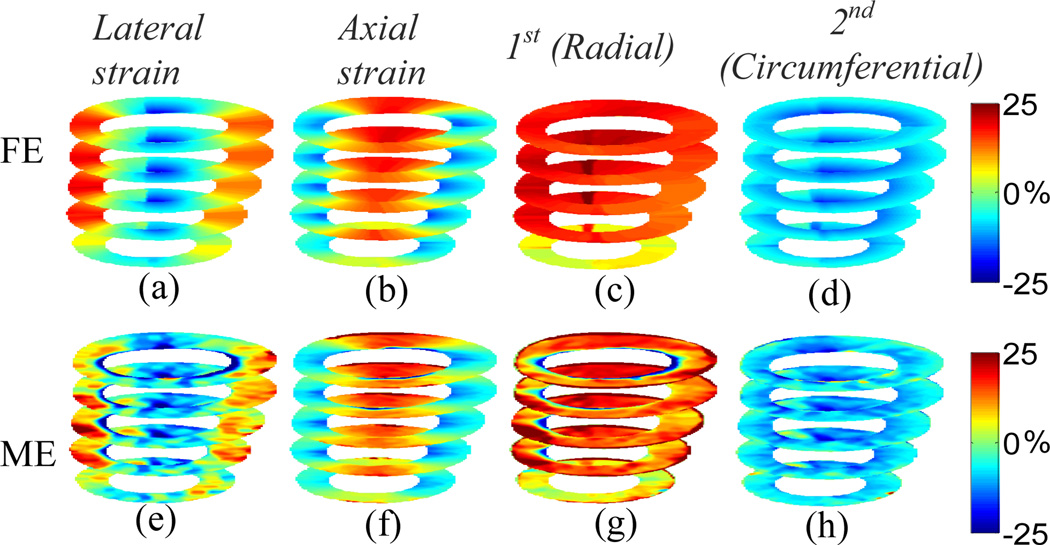
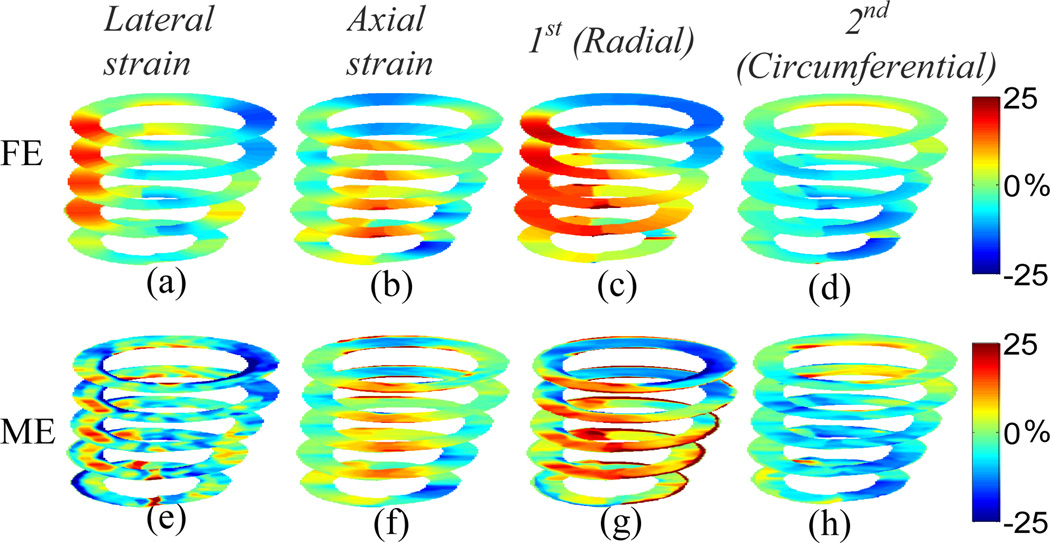
The 3D displacements for the Control model at multiple slices with the elevational beamwidth of 2 mm are shown in Fig. 2. The MAPE’s for lateral, axial and elevational displacements at the equatorial slice are 8.25%, 3.65% and 9.06%, respectively. The in-plane Cartesian finite strains and classified principal strains are shown in Fig. 3. The MAPE’s for lateral, axial, 1st (radial) and 2nd classified principal (circumferential) strains at the equatorial slice are 17.01%, 8.01%, 7.61% and 9.40%, respectively. The elevational displacement increases, while the in-plane motion and strains are smaller, near the apical level. The larger the elevational motion is, the larger the in-plane motion and strain estimation errors become. The classified principal strains show radial thickening (Figs. 3(c) and (g)) and circumferential shortening (Figs. 3(d) and (h)) in a normal myocardium (i.e., Control model).
Fig. 2.
Anterior view of cumulative systolic motion for the Control model at multiple slices; (a)-(c) are FE lateral, axial and elevational displacements, respectively; (d)-(f) are estimated lateral, axial and elevational displacements, respectively.
Fig. 3.
Anterior view of cumulative systolic strains for the Control model at multiple slices; (a)-(d) are FE lateral, axial, 1st (radial) and 2nd classified principal (circumferential) strains, respectively; (e)-(h) are estimated lateral, axial, 1st (radial) and 2nd classified principal (circumferential) strains, respectively.
2.3.1.2 LCx Ischemic Model
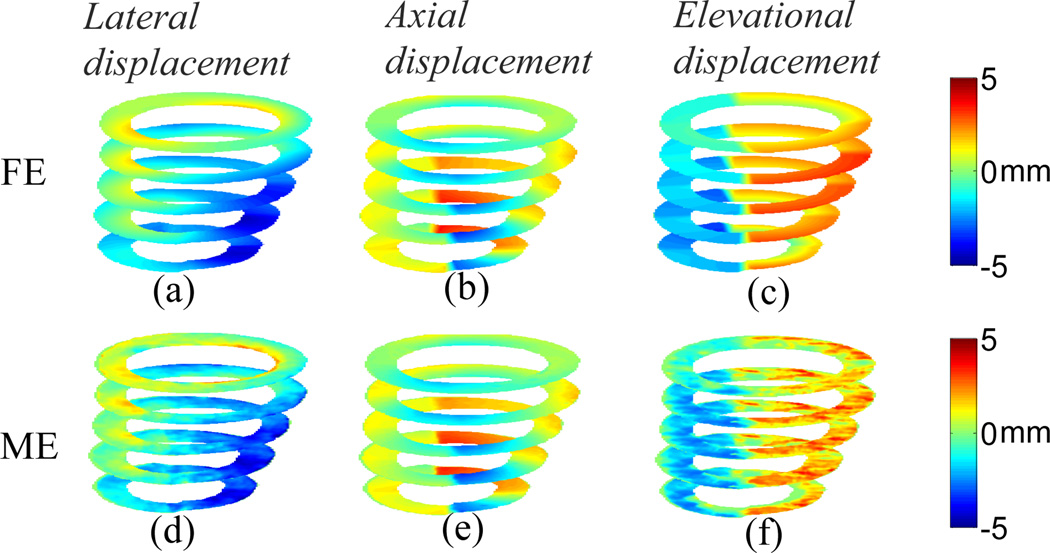
The 3D displacements and the in-plane strains for the LCx model at multiple slices with the elevational beamwidth of 2 mm are shown in Figs. 4 and 5, respectively. The MAPE’s for lateral, axial and elevational displacements at the equatorial slice are 11.59%, 6.08% and 14.97%, respectively. The MAPE’s for lateral, axial, 1st and 2nd classified principal strains at the equatorial slice are 18.10%, 8.23%, 10.61% and 12.16%, respectively. Unlike the normal case, the classified principal strains show radial thinning (Figs. 5(c) and (g)) and circumferential stretching (Figs. 5(d) and (h)) in the ischemic region (i.e., posterior-lateral wall). The classified principal strains (Figs. 5(c)-(d) and (g)-(h)) confirm decreased size of the ischemic region toward the apical level (Fig. 1). Note that all images shown in Figs. 2–5 are mapped on the geometry at the end-systolic phase, and their orientation is the same as in Fig. 1. The MAPE’s in the 3D simulation scheme for both normal and ischemic cases are summarized in Table 1.
Fig. 4.
Anterior view of cumulative systolic motion for the LCx model at multiple slices; (a)-(c) are FE lateral, axial and elevational displacements, respectively; (d)-(f) are estimated lateral, axial and elevational displacements, respectively.
Fig. 5.
Anterior view of cumulative systolic strains for the LCx model at multiple slices; (a)-(d) are FE lateral, axial, 1st (radial) and 2nd classified principal (circumferential) strains, respectively; (e)-(h) are estimated lateral, axial, 1st (radial) and 2nd classified principal (circumferential) strains, respectively.
Table 1.
The mean absolute percentage errors (MAPE’s) for lateral (ux), axial (uy) and elevational (uz) displacements, lateral (Exx) and axial (Eyy) strains, and 1st (Ep1) and 2nd (Ep2) principal strains in both Control and ischemic cases.
| FE Model | Control | Ischemia |
|---|---|---|
| MAPE (%) | ||
| ux | 8.25 | 11.59 |
| uy | 3.65 | 6.08 |
| uz | 9.06 | 14.97 |
| Exx | 17.01 | 18.10 |
| Eyy | 8.01 | 8.23 |
| Ep1 | 7.61 | 10.61 |
| Ep2 | 9.40 | 12.16 |
2.3.2 Clinical Validation
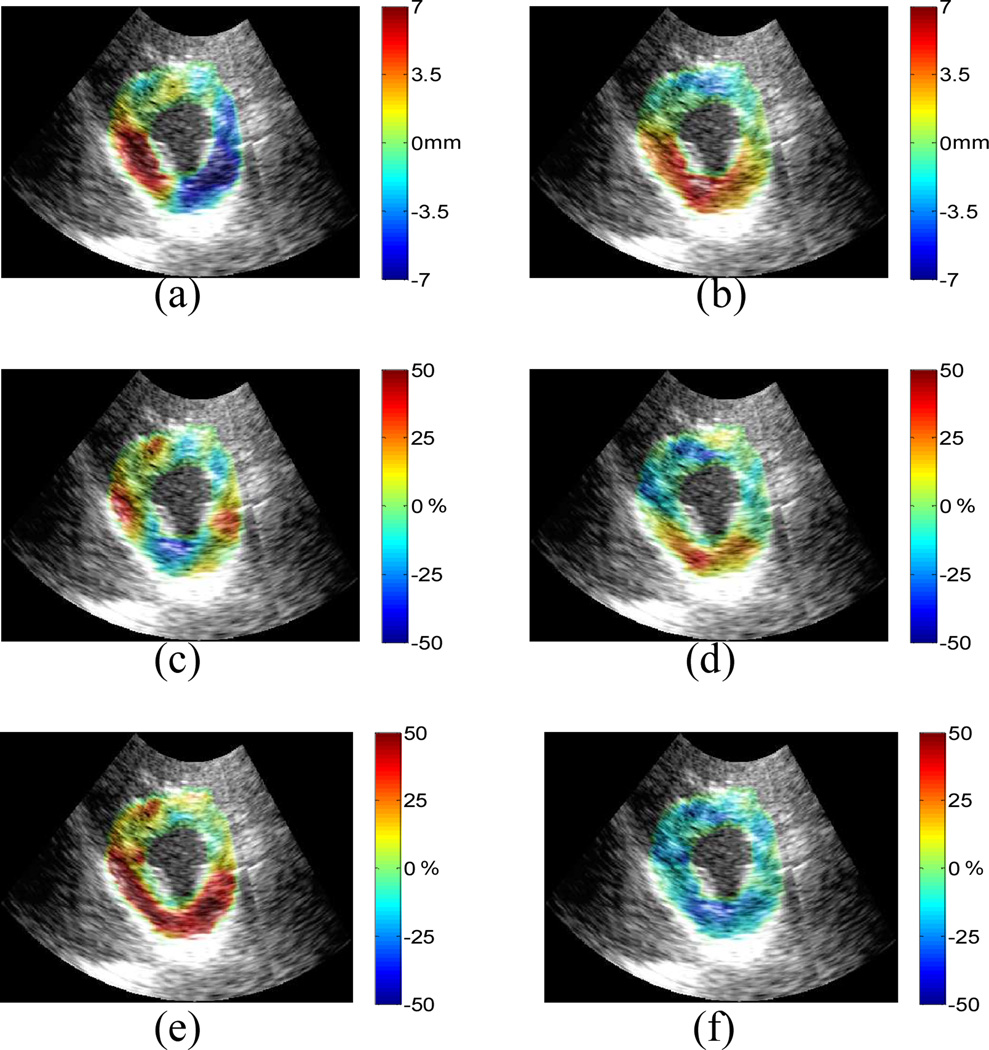
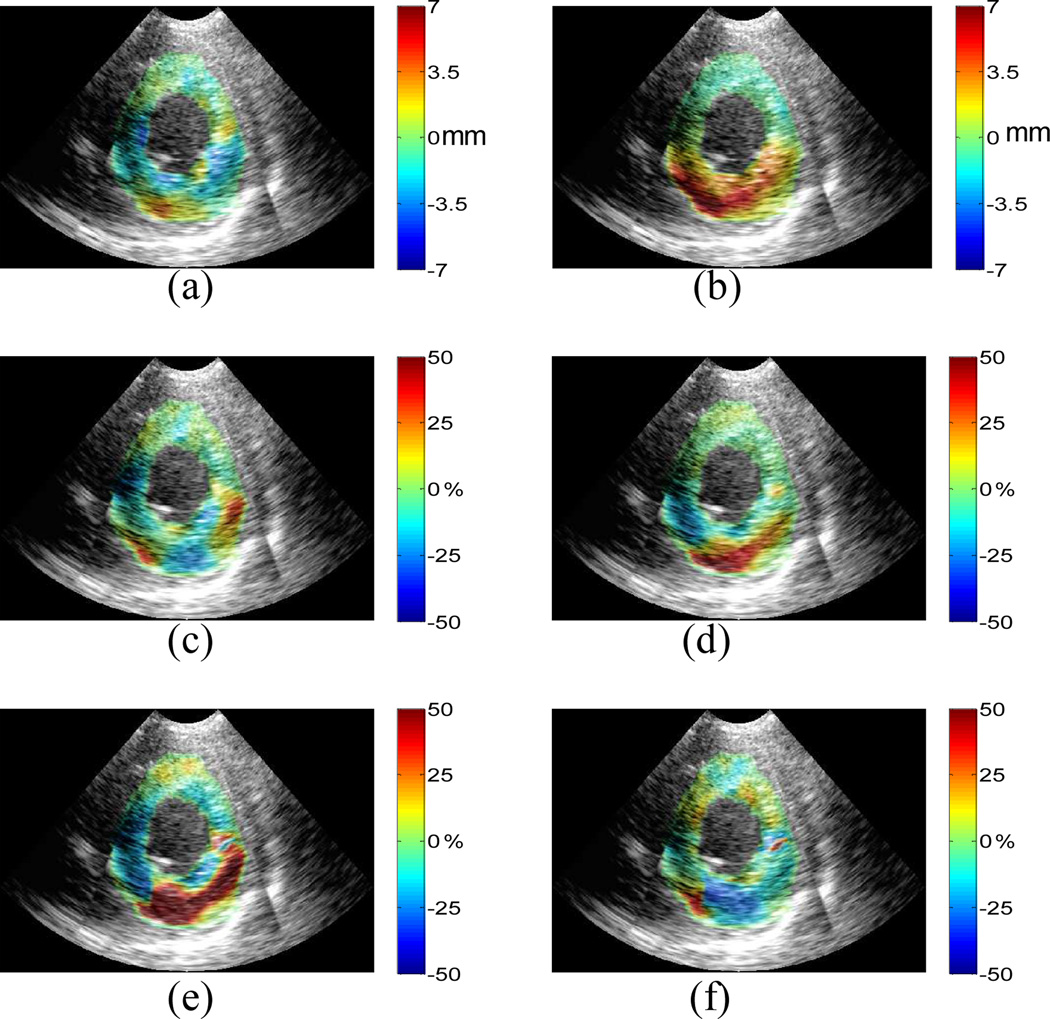
The anterior, lateral, posterior and septal walls are in the upper right, lower right, lower left and upper left regions, respectively, on the in vivo 2D short-axis images shown in Figs. 6–7.
Fig. 6.
Normal human left ventricle: cumulative (a) lateral displacement; (b) axial displacement; (c) lateral strain; (d) axial strain; (e) 1st and (f) 2nd classified principal strains between ED and ES. Displacements are displayed on a scale of ±7mm and strains of ±50%.
Fig. 7.
LAD post-infarcted human left ventricle: cumulative (a) lateral displacement; (b) axial displacement; (c) lateral strain; (d) axial strain; (e) 1st and (f) 2nd classified principal strains between ED and ES. Displacements are displayed on a scale of ±7mm and strains of ±50%.
A preliminary validation of the FE results for both lateral and axial displacements is first shown in one healthy human (female, 28 y.o.) left ventricle (Figs. 6(a)-(b), respectively). The axial displacement shows best agreement with the FE equivalent. The lateral displacement depicts the largest motion in the region of the myocardium attached to the papillary muscle. Fig. 6(c) shows lateral tension in the lateral and septal regions, and Fig. 6(d) shows axial tension in the posterior wall; i.e., indicating good agreement with the findings in the theoretical framework (Fig. 3). Fig. 6(e) clearly shows radial thickening in the 1st classified principal strain, except in the anterior wall, while Fig. 6(f) shows myocardial circumferential shortening in the 2nd classified principal strain. In addition, the principal strains (Figs. 6(e)-(f)) include the papillary muscle, which the Control FE model does not take into account. Thus, radial thinning, instead of radial thickening, is shown inside the endocardial border in the first principal strain component image. Note that all in vivo images are shown in the end-systolic configuration (same as in the FE model).
Fig. 7 shows in-plane displacements and strains for a human (male, 69 y.o.) left ventricle with a history of myocardial infarction which was caused by partial occlusion of the distal left anterior descending (LAD) coronary artery, reperfusion treatment, and motion abnormalities in both the septal and anterior walls. Not only is the magnitude of the strains of the LAD subject (Fig. 7) smaller than those of the healthy subject (Fig. 6) throughout the ventricle, except for the posterior wall region, but the strain pattern of the abnormal subject is highly asymmetric compared with the healthy subject (Fig. 6). The 1st classified principal (radial) strain (Fig. 7(e)) of the LAD subject shows myocardial thickening in the posterior and lateral walls, and the anterior-septal segments. The 2nd classified principal (circumferential) strain (Fig. 7(f)) shows myocardial shortening in the lateral and posterior walls but stretching in the other regions; clearly identifying thus the correct location of the infarcted region. The preliminary in vivo results are validated compared with the theoretical framework and show that ME is capable of differentiating abnormal from normal myocardium even in a post-infarcted, reperfused left ventricle.
2.4 Discussion and Conclusion
The fundamental limits of angle-independent myocardial elastography for the estimation of lateral, axial and classified principal (i.e., angle-independent) strain estimation were assessed in our proposed theoretical framework, and the validation of theoretical findings was shown in healthy and pathological human subjects in vivo. The cumulative 2D displacements, Cartesian finite strains and classified principal strains were estimated and imaged for characterization of myocardial deformation. In conclusion, the feasibility of the angle-independent myocardial elastography technique was proven essential in the angle-independence of the strains depicted. This paper only showed preliminary validation of the FE results, and a main discrepancy lay in the fact that the FE model was developed using an open-chest dog, while the in vivo results shown here were from closed-chest human subjects. A careful animal study will be carried out to determine the extent of the utility of this technique at distinct angles of scanning and multiple sonographic views. Furthermore, an evaluation of the clinical ultrasound system parameters will be performed for more accurate theoretical framework design.
Acknowledgements
This study was supported by the National Institutes of Health (R01EB006042) and the American Heart Association (SDG 0435444T). The authors wish to thank Kevin D. Costa, Jeffrey W. Holmes and Christopher M. Ingrassia for their input on finite-element modeling and thank Simon D. Fung-Kee-Fung for developing the data acquisition protocol. We also would like to thank Kana Fujikura of the Department of Biomedical Engineering, and Farooq A. Chaudhry, Ajay Shah and Donna Macmillan-Marotti at St. Luke’s Roosevelt Hospital Center for their input on the clinical study.
Footnotes
Publisher's Disclaimer: This is a PDF file of an unedited manuscript that has been accepted for publication. As a service to our customers we are providing this early version of the manuscript. The manuscript will undergo copyediting, typesetting, and review of the resulting proof before it is published in its final citable form. Please note that during the production process errors may be discovered which could affect the content, and all legal disclaimers that apply to the journal pertain.
Literature
- 1.Konofagou EE, D'Hooge J, Ophir J. Myocardial elastography - A feasibility study in vivo. Ultrasound Med. Biol. 2002;28:475–482. doi: 10.1016/s0301-5629(02)00488-x. [DOI] [PubMed] [Google Scholar]
- 2.Konofagou EE, Harrigan T, Solomon S. Assessment of regional myocardial strain using cardiac elastography: distinguished infarcted from non-infarcted myocardium. Proc. IEEE Ultrason. Symp. 2001:1589–1592. [Google Scholar]
- 3.Lee WN, Ingrassia CM, Fung-Kee-Fung SD, Costa KD, Holmes JW, Konofagou EE. Theoretical quality assessment of myocardial elastography with in vivo validation. IEEE Trans. Ultrason. Ferroelectr. Freq. Control. 2007;54:2233–2245. doi: 10.1109/tuffc.2007.528. [DOI] [PubMed] [Google Scholar]
- 4.Fung-Kee-Fung SD, Lee W-N, Ingrassia CM, Costa KD, Konofagou EE. Angle-independent strain mapping in myocardial elastography. Proc. IEEE Ultrason. Symp. 2005:516–519. [Google Scholar]
- 5.Zervantonakis IK, Fung-Kee-Fung SD, Lee WN, Konofagou EE. A novel, view-independent method for strain mapping in myocardial elastography: eliminating angle and centroid dependence. Phys. Med. Biol. 2007;52:4063–4080. doi: 10.1088/0031-9155/52/14/004. [DOI] [PubMed] [Google Scholar]
- 6.Lee W-N, Konofagou EE. Analysis of 3D motion effects in myocardial elastography. Proc. IEEE Ultrason. Symp. 2006:1217–1220. [Google Scholar]
- 7.Meunier J, Bertrand M. Echographic image mean gray-level changes with tissue dynamics - a system-based model study. IEEE Trans. biomed. Eng. 1995;42:403–410. doi: 10.1109/10.376133. [DOI] [PubMed] [Google Scholar]
- 8.Varghese T, Ophir J. A theoretical framework for performance characterization of elastography: The strain filter. IEEE Trans. Ultrason. Ferroelectr. Freq. Control. 1997;44:164–172. doi: 10.1109/58.585212. [DOI] [PubMed] [Google Scholar]
- 9.Alam SK, Ophir J, Varghese T. Elastographic axial resolution criteria: An experimental study. 2000;47:304–309. doi: 10.1109/58.818775. [DOI] [PubMed] [Google Scholar]
- 10.Konofagou EE, Ophir J. A new elastographic method for estimation and imaging of lateral displacements, lateral strains, corrected axial strains and Poisson's ratios in tissues. Ultrasound Med. Biol. 1998;24:1183–1199. doi: 10.1016/s0301-5629(98)00109-4. [DOI] [PubMed] [Google Scholar]
- 11.Kallel F, Ophir J. A least-squares strain estimator for elastography. Ultrason. Imaging. 1997;19:195–208. doi: 10.1177/016173469701900303. [DOI] [PubMed] [Google Scholar]
- 12.Waldman LK, Fung YC, Covell JW. Transmural Myocardial Deformation in the Canine Left-Ventricle - Normal Invivo 3-Dimensional Finite Strains. Circ.Res. 1985;57:152–163. doi: 10.1161/01.res.57.1.152. [DOI] [PubMed] [Google Scholar]
- 13.Luo J, Konofagou EE. Automated contour tracking for myocardial elastography in vivo. IEEE Trans. Ultrason. Ferroelectr. Freq. Control. 2007 doi: 10.1109/TUFFC.2008.633. [DOI] [PubMed] [Google Scholar]
- 14.Wang S, Lee W-N, Luo J, Konofagou EE. An ECG gated clinical ultrasound system for high frame-rate cardiovascular ultrasound and elastography imaging. IEEE International Ultrasonics Symposium, New York. 2007 [Google Scholar]


