Abstract
We have synthesized a biomaterial consisting of Gd(III) ions chelated to lipid-coated, size-selected microbubbles for utility in both magnetic resonance and ultrasound imaging. The macrocyclic ligand DOTA-NHS was bound to PE headgroups on the lipid shell of pre-synthesized microbubbles. Gd(III) was then chelated to DOTA on the microbubble shell. The reaction temperature was optimized to increase the rate of Gd(III) chelation while maintaining microbubble stability. ICP-OES analysis of the microbubbles determined a surface density of 7.5 × 10⁵ ± 3.0 × 10⁵ Gd(III)/μm2 after chelation at 50 °C. The Gd(III)-bound microbubbles were found to be echogenic in vivo during high-frequency ultrasound imaging of the mouse kidney. The Gd(III)-bound microbubbles also were characterized by magnetic resonance imaging (MRI) at 9.4 T by a spin-echo technique and, surprisingly, both the longitudinal and transverse proton relaxation rates were found to be roughly equal to that of no-Gd(III) control microbubbles and saline. However, the relaxation rates increased significantly, and in a dose-dependent manner, after sonication was used to fragment the Gd(III)-bound microbubbles into non-gas-containing lipid bilayer remnants. The longitudinal (r1) and transverse (r2) molar relaxivities were 4.0 ± 0.4 and 120 ± 18 mM−1s−1, respectively, based on Gd(III) content. The Gd(III)-bound microbubbles may find application in the measurement of cavitation events during MRI-guided focused ultrasound therapy and to track the biodistribution of shell remnants.
Keywords: Blood-brain barrier opening, Lanthanide, DOTA, Phospholipid, Perfluorobutane, Cavitation
1. Introduction
MRI-guided focused ultrasound therapy is a rapidly developing medical technique that utilizes high-intensity focused ultrasound (FUS) to ablate tissue and magnetic resonance imaging (MRI) to monitor the applied thermal dosage [1–3]. MRI-guided FUS therapy is approved by the US Food and Drug Administration for the treatment of uterine fibroids, and it is currently being developed to treat liver, bone, prostrate and brain-related diseases [3–5]. At high acoustic intensities, gas-filled microbubbles (MBs) may form and undergo inertial cavitation, producing jets and shock-waves that enhance the heating of tissue. However, the formation of these inception microbubbles is unpredictable, and their cavitation can result in tissue damage outside of the desired target region. Pre-formed microbubbles, which are currently FDA-approved as intravascular contrast agents for echocardiography, can be used as cavitation nuclei to lower the acoustic intensity threshold required for tissue ablation with FUS, thereby lowering the thermal buildup in surrounding tissue [6–9]. Intravenously administered microbubbles also may be used to enhance vascular permeability for targeted drug and gene delivery [10,11]. For example, microbubbles have been used to lower the acoustic intensity threshold needed for FUS-induced blood–brain barrier (BBB) opening [12,13]. For these applications, it would be advantageous to use an MRI-detectable microbubble formulation, which could be used to measure microbubble concentration, image cavitation events and determine the biodistribution of microbubble shell debris (a potential surrogate for an attached drug) following FUS. Such microbubbles may also be useful as general dual modality US/MRI contrast agents.
Previously, microbubbles were demonstrated to enhance the T2*-weighted MRI contrast in vivo by virtue of the change in magnetic susceptibility at the gas–liquid interface [14,15]. This negative enhancement was reportedly a linear function of gas concentration and was further increased in subsequent studies by loading T2-weighted MRI contrast agents (iron oxide particles) onto the shell of polymeric microbubbles [16–18]. Recently, Lui et al. [19] reported that ultrasonic fragmentation of magnetite-loaded polymeric microbubbles resulted in greater proton relaxation than for the intact microbubbles. This effect was attributed to the greater interaction of peripheral water to released iron oxide particles. These superparamagnetic microbubbles offer significant potential as theranostic agents for MRI-guided FUS.
An alternative means to produce dual modality US/MRI contrast agents is to load microbubbles with paramagnetic contrast agents, such as gadolinium ions. Gd(III) enhances the positive contrast of blood by shortening both the longitudinal and transverse proton relaxation times, T1 and T2 [20–22]. Previously, Gd(III)-DTPA was loaded into the shell of 1.5-μm diameter polymeric microbubbles [23]. The enhancement of the T1-weighted MRI signal was reportedly a linear function of Gd(III)-DTPA-loaded microbubble concentration. However, polymeric microbubbles tend to be much stiffer than lipid-coated microbubbles, providing less echogenicity for ultrasound imaging and requiring greater acoustic intensity to induce microbubble fragmentation and sonoporation for therapy [24,25].
Lipid-coated microbubbles with Gd(III)-bound shells have not been reported in literature previously. However, Gd(III)-bound liposomes have been designed and characterized as T1-weighted MRI contrast agents for applications in cellular and small animal imaging [26–30]. Liposomes and lipid-coated microbubbles are similar with respect to their lipid composition and formulation [31]. The main difference between the two is that microbubbles consist of a condensed monolayer with a gas core and are typically a few microns in size, while liposomes consist of a lipid bilayer with an aqueous core and are usually several hundred nanometers in size. Gd(III) can be loaded into the liposomal aqueous core and/or conjugated to the lipid polar headgroups in the bilayer [26–28]. While both strategies were reported to increase the T1-weighted MRI relaxation rate, surface conjugation resulted in greater relaxation enhancement than encapsulation, owing to greater access of bulk water protons to the Gd(III) ions [27]. Due to the presence of the gas core and thin monolayer shell, lipid-coated microbubbles can only be functionalized with Gd(III) ions using a surface conjugation methodology. Since the lipid coating of microbubble shells self-assembles into liposomal bilayers in the absence of the gas core, a comparison of the MRI relaxation rates of Gd(III)-bound microbubbles before and after fragmentation would be necessary.
Below, we report the fabrication and characterization of lipid-coated microbubbles that were surface-conjugated with the paramagnetic MRI contrast agent, Gd(III). Gadolinium was selected over iron oxide since it works primarily to enhance positive contrast through increasing longitudinal proton relaxation [20]. The chelation ligand DOTA was chosen over DTPA since it forms a more thermodynamically stable complex with Gd(III) [32]. A stronger chelator is preferred since free Gd(III) ions in vivo have been associated with nephrogenic systemic fibrosis [33]. Additionally, the 4–5 μm microbubble size range was selected because of its increased acoustic signal and circulation persistence [34,35] and more effective BBB opening capability compared to polydisperse and smaller size-ranged microbubbles [36,37]. The microbubbles were tested for ultrasound contrast in vivo and MRI contrast in vitro. Finally, we report both longitudinal (R1 = 1/T1) and transverse (R2 = 1/T2) relaxation rates of the Gd(III)-bound microbubbles before and after they were fragmented into lipid bilayers by sonication.
2. Materials and methods
2.1. Materials
All solutions were prepared using filtered, 18 MΩ-cm deionized water (Direct-Q, Millipore, Billerica, MA). Glassware was cleaned with 70 vol% ethyl alcohol solution (Sigma-Aldrich; St. Louis, MO) and rinsed with deionized water. The gas used to form microbubbles was perfluorobutane (PFB) at 99 wt% purity obtained from FluoroMed (Round Rock, TX). 1,2-distearyol-sn-glycero-3-phosphoethanolamine (DSPE) was purchased from Avanti Polar Lipids (Alabaster, AL). 1,2-distearyol-sn-glycero-3-phosphoethanolamine-N-[methoxy(polyethylene glycol)2000] (DSPE-PEG(2000)) was obtained from NOF America Corporation (White Plains, NY). 5/6-carboxyfluorescein succinimidyl ester (FITC-NHS) was purchased from Pierce (Rockford, IL). 1,4,7,10-Tetraazacyclododecane-1,4,7,10-tetraacetic acid mono(N-hydroxysuccinimide ester) (DOTA-NHS) was purchased from Macrocyclics (Dallas, TX) and dissolved in N,N-dimethylformamide (DMF; Sigma-Aldrich) prior to use. Gadolinium (III) chloride (GdCl3) was purchased from Sigma Aldrich and dissolved in 0.2 M, pH 5.6 acetate buffer (VWR, Radnor, PA).
2.2. Microbubble generation and size isolation
Microbubbles were formulated using a lipid suspension of 90 mol% DSPE and 10 mol% DSPE-PEG(2000) at 2 mg/mL in 100 mL PBS (pH 7.2;; 0.15 M NaCL, 0.2 M phosphate). The solution was degassed by applying house vacuum with constant stirring. The solution was then preheated to 80 °C, which is 6 °C above the main phase transition temperature (Tm) of DSPE [38]. The lipid mixture was sonicated with a 20-kHz probe (model 250A, Branson Ultrasonics; Danbury, CT) at low power (3 W) in order to further disperse the lipid aggregates into small, unilamellar liposomes. PFB gas was introduced by flowing it over the surface of the lipid suspension. Higher power sonication (33 W) was applied to the suspension for about 10 s at the gas–liquid interface to generate microbubbles.
The microbubble suspension was collected into 30 mL syringes (Tyco Health-care, Mansfield, MA), which were used as the flotation columns. Washing and size-selection by centrifugation was performed with a bucket-rotor centrifuge (model 5804, Eppendorf, Westbury, NY) [39]. Centrifugation at 300 RCF (relative centrifugal force) for 5 min was performed to collect all microbubbles from the suspension into a cake resting against the syringe plunger. The remaining suspension (infranatant), which contained residual lipids and vesicles, was recycled to produce the next batch of microbubbles. All resulting cakes were combined and re-suspended in PBS to improve total yield.
Microbubble size distribution was determined by laser light obscuration and scattering (Accusizer 280A, NICOMP Particle Sizing Systems, Santa Barbara, CA). During measurements, 2 μL samples of each microbubble suspension were diluted into a flask containing 30 mL of distilled water under mild mixing. All samples were measured in triplicate and analyzed for both number- and volume-weighted size distributions. The 4–5 μm size class was isolated as described elsewhere [34,39] and reconstituted in pH 8.5 PBS.
2.3. Synthesis of Gd(III)-bound microbubbles
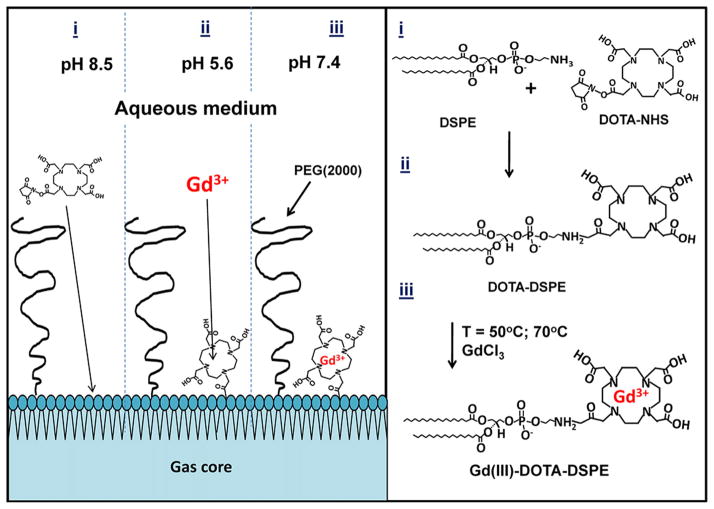
Microbubbles with Gd(III)-bound shells were fabricated using a post-labeling technique [40,41]. The macrocyclic ligand DOTA-NHS was conjugated to the amine group of the DSPE in the shell of size-selected microbubbles, followed by chelation of Gd(III). The NHS ester contains an electrophilic active group that couples rapidly with the primary amine on DSPE to create a stable amide bond. Fig. 1 shows a schematic of the overall conjugation process.
Fig. 1.
Synthesis of the Gd(III)-DOTA-DSPE microbubble shells using the post-labeling technique: (i) 100 M excess DOTA-NHS, pH 8.5; (ii) 20 M excess GdCl3, pH 5.6, T = 50 or 70 °C; (iii) storage at pH 7.4.
2.3.1. Surface functionalization with FITC-NHS or DOTA-NHS
Each 4–5 μm microbubble sample was diluted to 2 × 109 MB/mL using pH 8.5 PBS. Following Chen and Borden [40,41], the total amount of available functional lipid groups (DSPE) on the microbubble surface was calculated assuming that the microbubbles were spherical with an average molecular area of 0.4 nm2. To test the post-labeling headgroup conjugation method, FITC-NHS was added to a 100:1 M ratio of NHS to amine, and the mixture was continually stirred at room temperature for 2 h using a benchtop rotary mixer. To chelate Gd(III), DOTA-NHS was added to a 100:1 M ratio of NHS to amine, and the suspension was mixed as above. Unreacted FITC-NHS or DOTA-NHS was removed by several cycles of flotation using 0.2 M, pH 5.6 acetate buffer. The microbubble cake was then analyzed for size with the Accusizer.
2.3.2. Complexation of Gd(III) to DOTA on microbubble shells
Based on the initial concentration and size distribution calculated from the Accusizer, each sample of DOTA-bound microbubbles was diluted to at least 2 × 109 MB/mL using pH 5.6 acetate buffer. Assuming 100% binding of DOTA to available functional DSPE lipid groups, the amount of GdCl3 needed for a 20:1 M ratio of Gd(III) to DOTA was determined and mixed with the microbubble suspension. The sample mixture was sealed in a 3 mL serum vial then immersed under continuous stirring in a water bath whose temperature was controlled at 50 °C or 70 °C for 2 h. After reaction, the sample mixture was cooled to room temperature by running the vial under cold tap water for 10 min. Excess Gd(III) ions were removed by several cycles of washing/centrifuging (1 min, 100 RCF) using pH 5.6 acetate buffer followed by several cycles of washing/centrifuging using pH 7.4 PBS. The final microbubble cake was reconstituted to a volume of 1 mL and a concentration of at least 1 × 109 MB/mL.
The size distribution and concentration of microbubbles after chelation reaction were determined by the Accusizer. The concentration of Gd(III)-bound to the microbubble shell was determined by inductively coupled plasma optical emission spectroscopy (ICP-OES, ACTIVA, HORIBA, Edison, NJ). Destruction/fragmentation of microbubbles in suspension was accomplished by simultaneous bath sonication and heating to 80 °C for 5 min.
2.4. Ultrasound characterization of Gd(III)-bound microbubbles
All animal experiments were conducted according to the National Institutes of Health guidelines and approved by the University of Colorado Institutional Animal Care and Use Committee. Ultrasound imaging was performed using a high-frequency ultrasound scanner (Vevo 2100, Visualsonics, Toronto, Ontario, Canada) with a MS-250 transducer. Images were acquired using the contrast mode setting at 18 MHz transmit frequency and 4% power. The transducer was positioned at the mouse midsection along the long axis of the kidney. B-mode ultrasound images were acquired using a field of view of 13 × 16 mm2. Mice were anesthetized with 3% isoflurane and tail veins were catheterized for injections, as previously described [34]. A 100-μL bolus (1 × 108 MB/mL) followed by a 15-μL saline flush was injected while imaging at the maximum frame rate for respiratory gating (~14 frames/second). B-mode images captured before and after microbubble injection were used to detect signal enhancement using a background reference subtraction method.
2.5. MRI characterization of Gd(III)-bound microbubbles
The effect of Gd(III)-bound microbubbles on the T1 and T2 relaxation times was determined using MRI relaxometry. Intact and fragmented Gd(III)-bound microbubbles were mixed with saline in four different volume ratios (0, 25, 50 and 100%) creating 200 μL solutions, which were placed in MR-compatible tubes with an inner diameter of 5 mm. Intact and fragmented 4–5 μm DOTA-bound microbubbles without Gd(III) binding were used as controls. A 9.4 T vertical MRI system (Bruker Biospin, Billerica, MA) was used to acquire turbo spin echo (RARE-VTR) images with variable repetition times (from 300 to 12,500 ms) and multi-slice multi-echo (MSME) images with variable echo times (from 20 to 320 ms) for T1 and T2 mapping, respectively. The spin-echo sequence is reportedly not affected by inhomogeneities in the magnetic foeld compared to the gradient echo sequence used in susceptibility-weighted imaging of microbubbles [14,42]. Eight 1.5 mm-thick, axial slices with a field of view (FOV) of 15 × 15 mm2 (matrix size: 96 × 96) covered the entire solution in each tube. Each slice depicted a slab of all four solutions at a specific height. T1 and T2 relaxation maps of each slice were derived using the Image Processing Toolbox of MATLAB R2008b (MathWorks Inc., Natick, MA). The first and last slice were not taken into account in the relaxation measurements, since the MR signal coming from these slices was contaminated by the void below and over the solution. The pixel-by-pixel estimations were used to generate T1 and T2 maps. Four pre-defined, identical, circular regions of interest (ROI) of 2.35 mm diameter were selected on each slice, in order to measure the relaxation rate of each solution throughout the tube. Each ROI covered a large surface area within the limits of the tube. Six measurements were made for each tube (from slice 1 to 6) and the mean value yielded the T1 or T2 relaxation times for each solution.
3. Results
3.1. Preparation of Gd(III)-bound microbubbles
The size isolation protocol yielded 4–5 μm diameter microbubbles at a concentration a least 2 × 109 MB/mL. Fig. 2 shows visual confirmation of FITC-NHS coupling to the DSPE shell using epi-fluorescence microscopy. This result confirmed that small molecules (<1 kDa) can diffuse through the PEG brush layer to react with the polar lipid headgroups. This is an extension of previous post-labeling work, which showed reactions occurring on PEG-tethered active groups [40,41,43], but not with the underlying lipid.
Fig. 2.
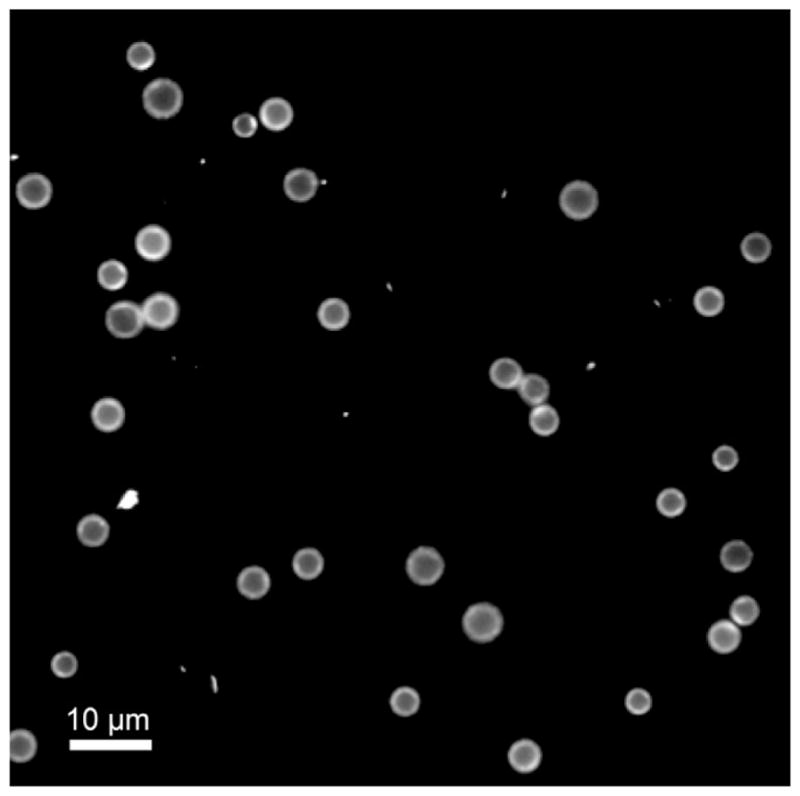
Fluorescence microscopy image of 4–5 μm DSPE-coated microbubbles modified with FITC-NHS using the post-labeling technique. Scale bar represents 10 μm.
Fig. 3 shows the change in size distribution of microbubbles before and after conjugation of DOTA (at room temperature) to the primary amines on the DSPE shell via NHS coupling. After DOTA conjugation, microbubble concentration and number-weighted median diameter deviated by less than 1%. Thus, the DOTA reaction did not appear to increase the lipid headgroup area sufficiently to affect lipid packing and thereby change microbubble size or stability.
Fig. 3.
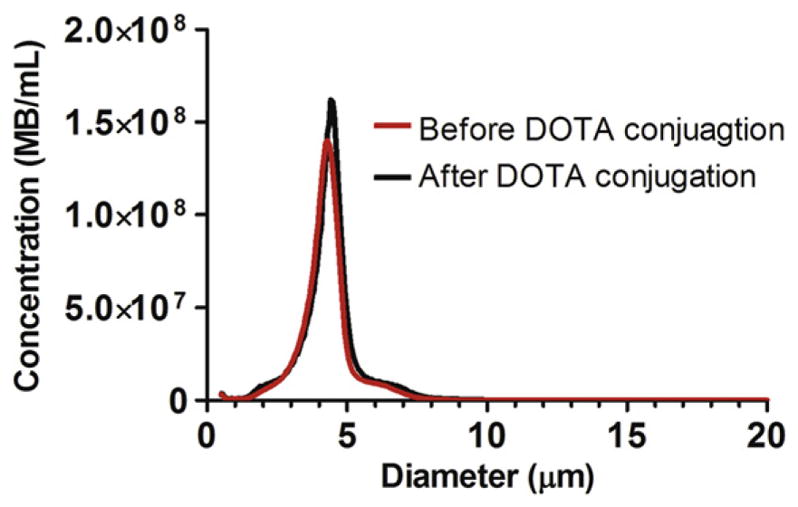
Number-weighted size distributions of DSPE microbubbles before and after conjugation with DOTA-NHS.
We did not detect Gd(III) binding to DOTA-microbubbles after incubation at room temperature for several hours (data not shown). The Gd(III)-DOTA complex has been reported to take several days to complete at room temperature [32]. This is because the rate-determining step involves the slow, base-assisted rearrangement and deprotonation of an intermediate before formation of the final complex [33]. Previous researchers have completed the Gd(III)-DOTA chelation reaction in 5 min by heating reactants to 90 °C, or in 20 min by heating to 80 °C [32]. However, these temperatures are above the main phase transition temperature (Tm) of the lipid component DSPE (74 °C) and may have resulted in significant microbubble destabilization. We therefore tested Gd(III) chelation onto microbubbles incubated at 50 °C and 70 °C for 2 h. Fig. 4 shows the change in size distribution of microbubbles before and after chelation of Gd(III) under these conditions. After chelation at 50 °C, microbubble concentration decreased by ~50% while the number-weighted median diameter deviated by less than 1%. After chelation at 70 °C, however, microbubble concentration decreased by ~65% while the number-weighted median diameter also decreased by ~30%. From ICP-OES analysis, the Gd(III) chelation on the microbubble shell occurring at 70 °C and 50 °C was 7.0 × 10⁵ ± 1.6 × 10⁵ (mean ± standard deviation) and 7.5 × 10⁵ ± 3.0 × 10⁵ ions/μm2, respectively (n = 4). Therefore, all subsequent chelation reactions were carried out at 50 °C since the size distribution of microbubbles was maintained at this temperature without affecting the degree of Gd(III) binding. Under these conditions, the average Gd(III) loading was 4.8 × 10⁷ ± 1.9 × 10⁷ ions/microbubble. ICP-OES analysis also determined that negligible amounts of Gd(III) bound to lipid-coated microbubbles without DOTA (data not shown).
Fig. 4.
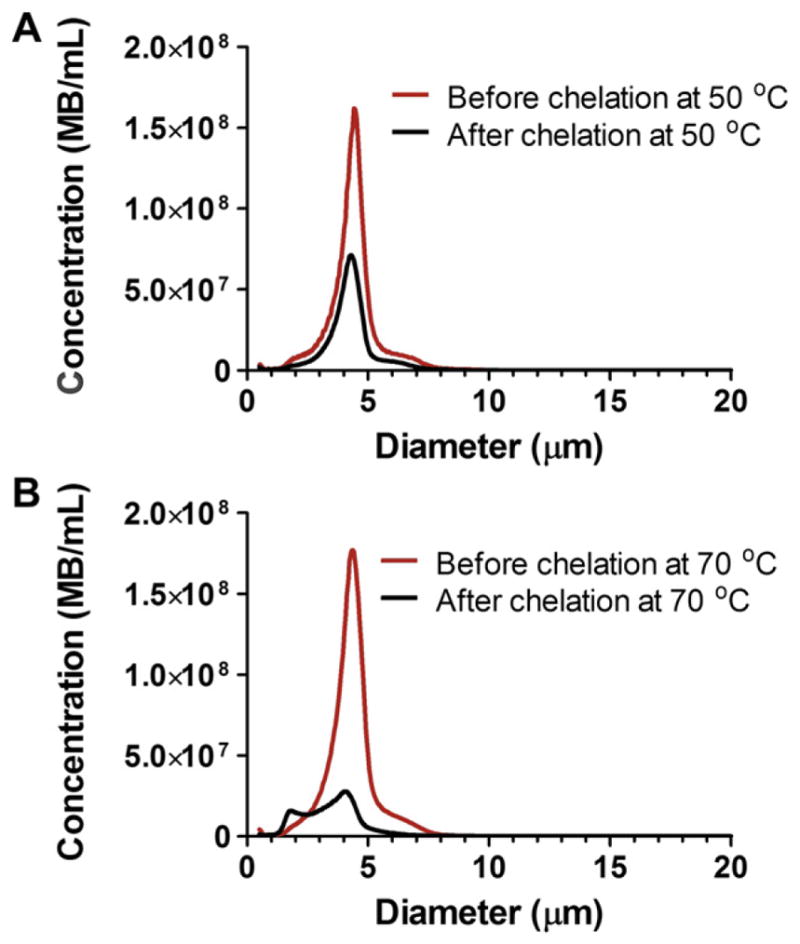
Number-weighted size distributions of microbubbles before and after Gd(III) chelation at A) 50 °C and B) 70 °C.
Thus, the post-labeling methodology provided a robust means of generating size-selected, Gd-DOTA-lipid microbubbles. Previous work showed that small molecules are capable of diffusing through a PEG overbrush on the microbubble surface to bind to functional groups tethered by shorter PEG chains [40,41]. Here, we showed that the small molecule DOTA-NHS is capable of diffusing through the PEG brush to bind to a functional amine on the lipid headgroup. The average molecular area was ~1–2 nm2 per Gd-DOTA complex. This value was higher than that of the minimum molecular area for a lipid (~0.4 nm2), indicating that roughly 20–40% of the DSPE was conjugated to Gd-DOTA. This fraction is similar to previous reports for Gd-DOTA-DSPE liposomes [28] and Gd-DTPA bis(stearylamide) liposomes [27].
3.2. Ultrasound characterization of Gd(III)-microbubbles
Lipid-coated microbubbles labeled with Gd(III) were tested for echogenicity in the mouse kidney using a preclinical ultrasound scanner. Fig. 5 shows the B-mode images before and after microbubble injection. A bolus injection of 1 × 10⁷ Gd(III)-bound microbubbles significantly increased the fundamental mode backscatter, as was evident by an increase in video intensity and speckling throughout the kidney region. Higher microbubble doses (e.g., 5 × 10⁸) led to strong contrast enhancement in the upper portion of the kidney and shadowing in the lower portion (data not shown). These results show that the Gd(III)-bound microbubbles are highly echogenic and suitable for contrast-enhanced US imaging.
Fig. 5.

Ultrasound images of the mouse kidney before and after bolus injection of 1 × 10⁷ Gd(III)-bound microbubbles: (Left) pre-injection, (Middle) post-injection, (Right) contrast enhancement overlay determined using signal subtraction.
3.3. MRI characterization of Gd(III)-microbubbles
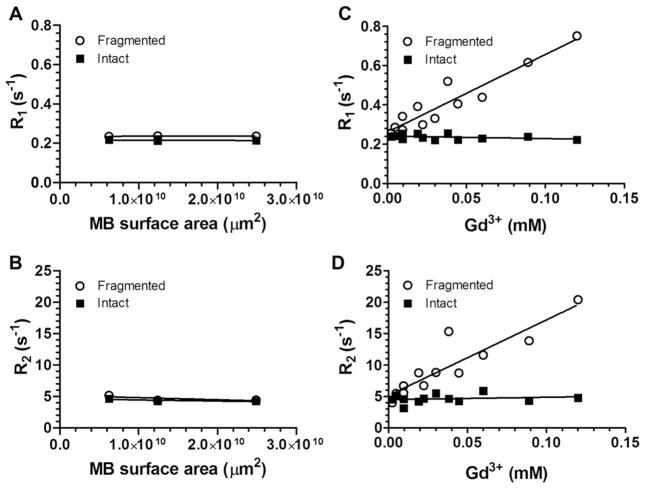
Fig. 6A and B show the T1-weighted and T2-weighted MRI maps of fragmented and intact Gd(III)-bound and control (DOTA without Gd(III)) microbubbles. Fragmented microbubbles were produced by the removal of the gas core of intact microbubbles through bath sonication and heating. The color-coding (from red to blue) indicates a greater relaxation effect and therefore an MRI signal intensity increase. Fig. 7A–D show plots of the longitudinal and transversal relaxation rates (R1 and R2) of intact and fragmented Gd(III)-bound microbubbles as a function of microbubble concentration, normalized to total Gd(III) concentration using ICP-OES results, for 4 independent trials. Results also are shown for intact and fragmented control microbubbles as a function of surface area.
Fig. 6.
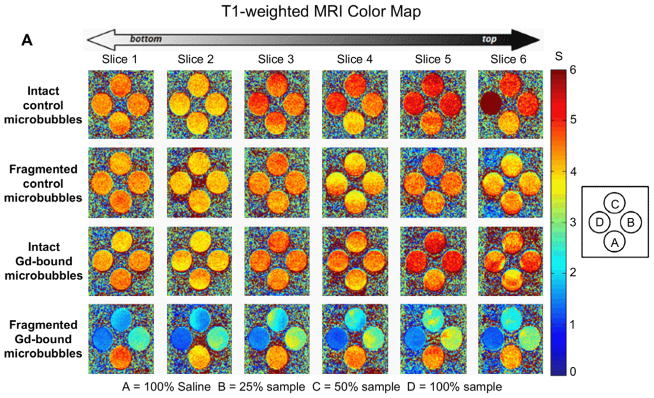
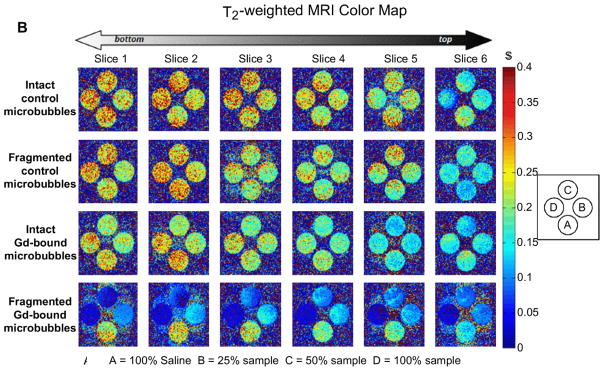
Color maps of MRI relaxation time for intact and fragmented microbubble samples. Longitudinal relaxation time (A) and transverse relaxation time (B) increases from blue to red, as shown. Samples are arranged shown: row 1) intact DOTA-bound control microbubbles; 2) fragmented DOTA-bound control microbubbles; row 3) intact Gd(III)-bound microbubbles; row 4) fragmented Gd(III)-bound microbubbles. Students’ t-tests showed that, for a given microbubble sample, T1 and T2 were not statistically different between vertical slices. (For interpretation of the references to colour in this figure legend, the reader is referred to the web version of this article.)
Fig. 7.
Relaxation rates of intact and fragmented microbubble samples. A) R1 versus Gd(III) concentration; B) R2 versus Gd(III) concentration; C) R1 versus MB surface area; D) R2 versus MB surface area.
3.3.1. Relaxation rates of control microbubbles and their fragments
As observed from both the T1- and T2-weighted color-coded MRI maps (Fig. 6), the control microbubbles (DOTA without Gd(III)) produced an MRI signal similar to baseline (saline), which did not deviate significantly with an increase in microbubble concentration. This is further evident in the plot of the relaxation rate versus increasing microbubble surface area for both R1 and R2 (Fig. 7A,B). The lack of a significant relaxation effect was found for both intact and destroyed control microbubbles.
3.3.2. Relaxation rates of Gd(III)-bound microbubbles and their fragments
Fig. 6 also shows that the intact Gd(III)-bound samples produced similar MR signal intensities as saline and control microbubbles, and the signal intensity was not dependent on an increase in sample concentration. Similarly, Fig. 7C and D show that the relaxation rate did not increase with increasing intact Gd(III)-bound microbubble concentration (the fitted slope was slightly negative); the MRI signal was similar to that of control samples. This was surprising, as we expected the MRI signal to increase with increasing Gd(III) as has been observed in liposomal suspensions [26–30].
Interestingly, the fragmented Gd(III)-bound microbubbles resulted in a noticeable increase in color-coded MRI signal intensity compared to saline, control and intact Gd(III)-bound microbubbles (Figs. 6 and 7). Additionally, the effect was concentration-dependent, with an increase in fragmented Gd(III)-bound sample concentration leading to an increase in MRI signal intensity. These results suggest that the MR signal came primarily from the Gd(III) groups and not the other components of the lipid microbubble shell, and the relaxation rate appeared to be most strongly related to the state of the microbubble (i.e., intact vs. fragmented).
3.4. Molar relaxivities of Gd(III)-bound microbubbles
Molar relaxivities (mM−1s−1) were calculated from the slopes of the linear trendlines in Fig. 7C and D and are shown in Table 1. Fragmentation of the intact Gd(III)-bound microbubble samples led to a 40-fold increase in longitudinal molar relaxivities r1 and a 32-fold increase in transverse molar relaxaivities r2. Thus, both r1 and r2 for the fragmented Gd(III)-bound microbubbles were greater than the corresponding values for the intact Gd(III)-bound microbubbles. A potential mechanism for this surprising phenomenon is discussed below.
Table 1.
Molar Relaxivity of Intact and Fragmented Gd(III)-bound Microbubbles.
| r1/Gd(III) (mM−1s−1) | r2/Gd(III) (mM−1s−1) | r1/MB (mM−1s−1) | r2/MB (mM−1s−1) | |
|---|---|---|---|---|
| Intact MBs | −0.1 ± 0.1 | 3.8 ± 5.8 | −3.6 ± 106 | 1.4 ± 108 |
| Destroyed MBs | 4.0 ± 0.4 | 120.2 ± 17.7 | 1.4 ± 108 | 4.3 ± 109 |
4. Discussion
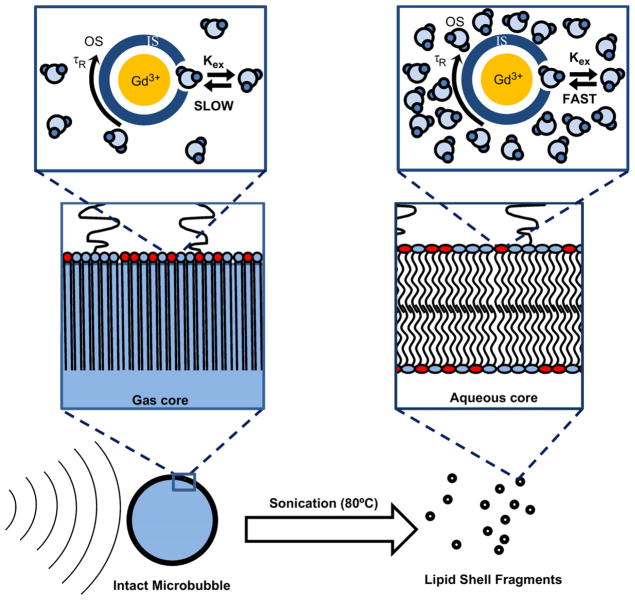
Surprisingly, we found that the relaxivity of Gd(III)-lipid monolayer-coated microbubbles increased significantly after destruction by sonication to form bilayer fragments. One explanation is that the presence of the microbubble gas core weakened the MRI signal intensity owing to susceptibility effects. However, the small difference in relaxation rates between intact and fragmented control microbubbles, and the lack of concentration dependence for these samples (Fig. 7), does not support this explanation. We propose an alternative explanation for this phenomenon based on the difference in bulk water access to the Gd(III)-DOTA-DSPE complex for microbubbles versus liposomes (Fig. 8). Gd(III) is a paramagnetic ion that must interact with and exchange nearby water protons via its inner core (first hydration layer) in order to have a measurable effect on relaxivity [44]. Intact microbubbles, which comprise a highly condensed monolayer shell held under compression by Laplace pressure-driven dissolution [45,46], may have restricted access of aqueous protons to the Gd(III) ion. Fragmentation of the microbubble converted the lipid to a more relaxed liposomal bilayer configuration, which may have allowed for greater access of water molecules to the Gd(III) complex, thus allowing a greater relaxation enhancement. The average area per lipid molecule for a fully compressed monolayer may be as low as 0.32 nm2 [47], which is 25% less than that for a typical gel-phase bilayer of 0.48 nm2 [48–51]. We therefore propose that the tighter lipid packing in the monolayer configuration silences the relaxation effect by inhibiting water proton exchange between the Gd(III) complex and the bulk, whereas looser packing in the bilayer configuration provides sufficient exchange to significantly affect relaxation. This mechanism is supported by recent results for magnetite-bearing polymeric microbubbles, in which a rise in longitudinal and transversal relaxivities was found following microbubble destruction and release of the iron oxide particles [19].
Fig. 8.
Cartoon showing proposed mechanism for MRI relaxivity increase with the cavitation-induced conversion of lipid from the compressed monolayer form on the intact microbubble to the relaxed bilayer form of the fragments. The lipid molecular area and hydrocarbon membrane thickness are estimated to be 0.32 nm2 and 2.2 nm for the condensed monolayer [47,48] and 0.48 nm2 and 2.4 nm for the relaxed, gel-state bilayer [48–51]. The parameters shown in the schematic are the outer hydration shell of the Gd(III) ion, OS; the inner hydration shell, IS; the molecular tumbling time, τR; and the proton exchange rate from the OS to the IS, kex. It is proposed that the ability of the Gd(III) ion to relax bulk water protons, i.e., the value of kex, increases as the lipid area increases during the monolayer-to-bilayer transition.
Regardless of the underlying mechanism, this behavior of Gd(III)-bound microbubbles may have useful implications for MRI-guided FUS therapy. Using the Gd(III)-bound microbubbles fabricated here, one may envision that microbubble cavitation within the ultrasound focus can be spatially and temporally controlled in situ via monitoring of the MRI signal increase as the Gd(III)-DOTA-DSPE is converted from monolayer to bilayer. Cavitation detection during focused ultrasound surgery may serve as a method to guide and monitor therapeutic effects and prevent unwanted bioeffects [52–54]. For example, Huang et al. [55] recently proposed to use phase-change agents, such as perfluorocarbon-liquid emulsion droplets that vaporize upon heating, to detect the margins of ablation during high-intensity focused ultrasound. Here, we propose an alternative strategy, in which Gd(III)-lipid microbubbles may serve as both a source and MRI beacon for acoustic cavitation. Following the proposed mechanism given above, the MRI signal would increase from baseline tissue contrast to positive contrast, in a dose-dependent manner, as microbubbles are fragmented. The change in signal intensity would provide a measure of the microbubble cavitation dose within the region of interest. Thus, the Gd(III)-microbubbles developed here may serve as a theranostic agent to monitor treatment and minimize the side effects associated with FUS.
5. Conclusions
Chelation of the paramagnetic lanthanide Gd(III) to the DOTA ligand on the surface of lipid-shelled microbubbles was achieved at a reaction temperature of 50 °C without degrading the 4–5 μm microbubble size distribution. The microbubbles were echogenic and provided contrast during high-frequency ultrasound imaging in vivo. Surprisingly, MRI relaxometry showed that intact Gd(III)-bound microbubbles did not significantly enhance longitudinal or transverse proton relaxation. However, the bilayer fragments of Gd(III)-bound microbubbles formed by cavitation resulted in a significant increase in r1 and r2. A mechanism based on bulk water access to the Gd(III) complex was proposed to explain the increase in MRI signal intensity observed upon conversion of the condensed monolayer form to the relaxed bilayer form. Gd(III)-bound microbubbles could find use as cavitation probes for MRI-guided FUS therapy applications.
Acknowledgments
The authors would like to thank Huangjing Zhao, Edward Swanson and Alissa Park at Columbia University for their help with the ICP-OES sample characterization, as well as Kelly Ambler of the University of Colorado and Nuno Sacadura of Visualsonics for help with the ultrasound imaging. This work was funded by NIH R01EB009041 and the University of Colorado.
References
- 1.Hynynen K, Darkazanli A, Unger E, Schenck JF. MRI-guided noninvasive ultrasound surgery. Med Phys. 1993;20:107–15. doi: 10.1118/1.597093. [DOI] [PubMed] [Google Scholar]
- 2.Cline HE, Schenck JF, Hynynen K, Watkins RD, Souza SP, Jolesz FA. MR-guided focused ultrasound surgery. J Comput Assist Tomogr. 1992;16:956–65. doi: 10.1097/00004728-199211000-00024. [DOI] [PubMed] [Google Scholar]
- 3.Jolesz FA, McDannold N. Current status and future potential of MRI-guided focused ultrasound surgery. J Magn Reson Imaging. 2008;27:391–9. doi: 10.1002/jmri.21261. [DOI] [PubMed] [Google Scholar]
- 4.Hudson SB, Stewart EA. Magnetic resonance-guided focused ultrasound surgery. Clin Obstet Gynecol. 2008;51:159–66. doi: 10.1097/GRF.0b013e318161e91f. [DOI] [PubMed] [Google Scholar]
- 5.Jolesz FA. MRI-guided focused ultrasound surgery. Annu Rev Med. 2009;60:417–30. doi: 10.1146/annurev.med.60.041707.170303. [DOI] [PMC free article] [PubMed] [Google Scholar]
- 6.Tran BC, Seo J, Hall TL, Fowlkes JB, Cain CA. Microbubble-enhanced cavitation for noninvasive ultrasound surgery. IEEE Trans Ultrason Ferroelectr Freq Control. 2003;50:1296–304. doi: 10.1109/tuffc.2003.1244746. [DOI] [PubMed] [Google Scholar]
- 7.Kaneko Y, Maruyama T, Takegami K, Watanabe T, Mitsui H, Hanajiri K, et al. Use of a microbubble agent to increase the effects of high intensity focused ultrasound on liver tissue. Eur Radiol. 2005;15:1415–20. doi: 10.1007/s00330-005-2663-7. [DOI] [PubMed] [Google Scholar]
- 8.Tung YS, Liu HL, Wu CC, Ju KC, Chen WS, Lin WL. Contrast-agent-enhanced ultrasound thermal ablation. Ultrasound Med Biol. 2006;32:1103–10. doi: 10.1016/j.ultrasmedbio.2006.04.005. [DOI] [PubMed] [Google Scholar]
- 9.Yu TH, Hu DR, Xu CS. Microbubbles improve the ablation efficiency of extra-corporeal high intensity focused ultrasound against kidney tissues. World J Urol. 2008;26:631–6. doi: 10.1007/s00345-008-0290-z. [DOI] [PubMed] [Google Scholar]
- 10.Unger EC, Porter T, Culp W, Labell R, Matsunaga T, Zutshi R. Therapeutic applications of lipid-coated microbubbles. Adv Drug Deliv Rev. 2004;56:1291–314. doi: 10.1016/j.addr.2003.12.006. [DOI] [PubMed] [Google Scholar]
- 11.Ferrara KW, Pollard RE, Borden MA. Ultrasound microbubble contrast agents: fundamentals and application to drug and gene delivery. Annu Rev Biomed Eng. 2007;9:415–47. doi: 10.1146/annurev.bioeng.8.061505.095852. [DOI] [PubMed] [Google Scholar]
- 12.Choi JJ, Pernot M, Small SA, Konofagou EE. Noninvasive, transcranial and localized opening of the blood-brain barrier using focused ultrasound in mice. Ultrasound Med Biol. 2007;33:95–104. doi: 10.1016/j.ultrasmedbio.2006.07.018. [DOI] [PubMed] [Google Scholar]
- 13.Hynynen K, McDannold N, Vykhodtseva N, Jolesz FA. Noninvasive MR imaging-guided focal opening of the blood-brain barrier in rabbits. Radiology. 2001;220:640–6. doi: 10.1148/radiol.2202001804. [DOI] [PubMed] [Google Scholar]
- 14.Cheung JS, Chow AM, Guo H, Wu EX. Microbubbles as a novel contrast agent for brain MRI. Neuroimage. 2009;46:658–64. doi: 10.1016/j.neuroimage.2009.02.037. [DOI] [PubMed] [Google Scholar]
- 15.Wong KK, Huang I, Kim YR, Tang HY, Yang ES, Kwong KK, et al. In vivo study of microbubbles as an MR susceptibility contrast agent. Magnet Reson Med. 2004;52:445–52. doi: 10.1002/mrm.20181. [DOI] [PubMed] [Google Scholar]
- 16.Chow AM, Chan KWY, Cheung JS, Wu EX. Enhancement of gas-filled micro-bubble R-2* by iron oxide nanoparticles for MRI. Magnet Reson Med. 63:224–229. doi: 10.1002/mrm.22184. [DOI] [PubMed] [Google Scholar]
- 17.Yang F, Li YX, Chen ZP, Zhang Y, Wu JR, Gu N. Superparamagnetic iron oxide nanoparticle-embedded encapsulated microbubbles as dual contrast agents of magnetic resonance and ultrasound imaging. Biomaterials. 2009;30:3882–90. doi: 10.1016/j.biomaterials.2009.03.051. [DOI] [PubMed] [Google Scholar]
- 18.Yang F, Li L, Li YX, Chen ZP, Wu JR, Gu N. Superparamagnetic nanoparticle-inclusion microbubbles for ultrasound contrast agents. Phys Med Biol. 2008;53:6129–41. doi: 10.1088/0031-9155/53/21/016. [DOI] [PubMed] [Google Scholar]
- 19.Liu Z, Lammers T, Ehling J, Fokong S, Bornemann J, Kiessling F, et al. Iron oxide nanoparticle-containing microbubble composites as contrast agents for MR and ultrasound dual-modality imaging. Biomaterials. 2011;32:6155–63. doi: 10.1016/j.biomaterials.2011.05.019. [DOI] [PubMed] [Google Scholar]
- 20.Caravan P, Ellison JJ, McMurry TJ, Lauffer RB. Gadolinium(III) chelates as MRI contrast agents: structure, dynamics, and applications. Chem Rev. 1999;99:2293–352. doi: 10.1021/cr980440x. [DOI] [PubMed] [Google Scholar]
- 21.Hermann P, Kotek J, Kubicek V, Lukes I. Gadolinium(III) complexes as MRI contrast agents: ligand design and properties of the complexes. Dalton Trans. 2008:3027–47. doi: 10.1039/b719704g. [DOI] [PubMed] [Google Scholar]
- 22.Aime S, Botta M, Terreno E. Gd(III)-based contrast agents for MRI. Adv Inorg Chem. 2005;57:173–237. [Google Scholar]
- 23.Ao M, Wang ZG, Ran HT, Guo DJ, Yu JH, Li A, et al. Gd-DTPA-loaded PLGA microbubbles as both ultrasound contrast agent and MRI contrast agent-A feasibility research. J Biomed Mater Res Part B. 2010;93B:551–6. doi: 10.1002/jbm.b.31614. [DOI] [PubMed] [Google Scholar]
- 24.Bloch SH, Wan M, Dayton PA, Ferrara KW. Optical observation of lipid- and polymer-shelled ultrasound microbubble contrast agents. Appl Phys Lett. 2004;84:631–3. [Google Scholar]
- 25.Hoff L, Sontum PC, Hovem JM. Oscillations of polymeric microbubbles: effect of the encapsulating shell. J Acoust Soc Am. 2000;107:2272–80. doi: 10.1121/1.428557. [DOI] [PubMed] [Google Scholar]
- 26.Ghaghada K, Hawley C, Kawaji K, Annapragada A, Mukundan S. T1 relaxivity of core-encapsulated gadolinium liposomal contrast agents - effect of liposome size and internal gadolinium concentration. Acad Radiol. 2008;15:1259–63. doi: 10.1016/j.acra.2008.04.018. [DOI] [PMC free article] [PubMed] [Google Scholar]
- 27.Ghaghada KB, Ravoori M, Sabapathy D, Bankson J, Kundra V, Annapragada A. New dual mode gadolinium nanoparticle contrast agent for magnetic resonance imaging. PLoS One. 2009;4 doi: 10.1371/journal.pone.0007628. [DOI] [PMC free article] [PubMed] [Google Scholar]
- 28.Hak S, Sanders H, Agrawal P, Langereis S, Grull H, Keizer HM, et al. A high relaxivity Gd(III)DOTA-DSPE-based liposomal contrast agent for magnetic resonance imaging. Eur J Pharm Biopharm. 2009;72:397–404. doi: 10.1016/j.ejpb.2008.09.017. [DOI] [PubMed] [Google Scholar]
- 29.Kamaly N, Kalber T, Kenny G, Bell J, Jorgensen M, Miller A. A novel bimodal lipidic contrast agent for cellular labelling and tumour MRI. Organ Biomol Chem. 2010;8:201–11. doi: 10.1039/b910561a. [DOI] [PubMed] [Google Scholar]
- 30.Terreno E, Castelli DD, Cabella C, Dastru W, Sanino A, Stancanello J, et al. Paramagnetic liposomes as innovative contrast agents for magnetic resonance (MR) molecular imaging applications. Chem Biodiversity. 2008;5:1901–12. doi: 10.1002/cbdv.200890178. [DOI] [PubMed] [Google Scholar]
- 31.Ferrara KW, Borden MA, Zhang H. Lipid-shelled vehicles: engineering for ultrasound molecular imaging and drug delivery. Acc Chem Res. 2009;42:881–92. doi: 10.1021/ar8002442. [DOI] [PMC free article] [PubMed] [Google Scholar]
- 32.De Leon-Rodriguez LM, Kovacs Z. The synthesis and chelation chemistry of DOTA-peptide conjugates. Bioconjug Chem. 2008;19:391–402. doi: 10.1021/bc700328s. [DOI] [PubMed] [Google Scholar]
- 33.Sherry AD, Caravan P, Lenkinski RE. Primer on gadolinium chemistry. J Magn Reson Imaging. 2009;30:1240–8. doi: 10.1002/jmri.21966. [DOI] [PMC free article] [PubMed] [Google Scholar]
- 34.Sirsi S, Feshitan J, Kwan J, Homma S, Borden M. Effect of microbubble size on fundamental mode high frequency imaging in mice. Ultrasound Med Biol. 2010;36:935–48. doi: 10.1016/j.ultrasmedbio.2010.03.015. [DOI] [PMC free article] [PubMed] [Google Scholar]
- 35.Streeter JE, Gessner R, Miles I, Dayton PA. Improving sensitivity in ultrasound molecular imaging by tailoring contrast agent size distribution: in vivo studies. Mol Imaging. 2010;9:87–95. [PMC free article] [PubMed] [Google Scholar]
- 36.Choi JJ, Feshitan JA, Baseri B, Wang SG, Tung YS, Borden MA, et al. Microbubble-size dependence of focused ultrasound-induced blood-brain barrier opening in mice in vivo. IEEE Trans Biomed Eng. 57:145–154. doi: 10.1109/TBME.2009.2034533. [DOI] [PMC free article] [PubMed] [Google Scholar]
- 37.Tung YS, Marquet F, Teichert T, Ferrera V, Konofagou EE. Feasibility of noninvasive cavitation-guided blood-brain barrier opening using focused ultrasound and microbubbles in nonhuman primates. Appl Phys Lett. 2011;98 doi: 10.1063/1.3580763. [DOI] [PMC free article] [PubMed] [Google Scholar]
- 38.Cevc G, Marsh D. Hydration of noncharged lipid bilayer-membranes -theory and experiments with phosphatidylethanolamines. Biophys J. 1985;47:21–31. doi: 10.1016/S0006-3495(85)83872-8. [DOI] [PMC free article] [PubMed] [Google Scholar]
- 39.Feshitan JA, Chen CC, Kwan JJ, Borden MA. Microbubble size isolation by differential centrifugation. J Colloid Interface Sci. 2009;329:316–24. doi: 10.1016/j.jcis.2008.09.066. [DOI] [PubMed] [Google Scholar]
- 40.Chen CC, Borden MA. Ligand conjugation to bimodal poly(ethylene glycol) brush layers on microbubbles. Langmuir. 2010;26:13183–94. doi: 10.1021/la101796p. [DOI] [PMC free article] [PubMed] [Google Scholar]
- 41.Chen CC, Borden MA. The role of poly(ethylene glycol) brush architecture in complement activation on targeted microbubble surfaces. Biomaterials. 2011;32:6579–87. doi: 10.1016/j.biomaterials.2011.05.027. [DOI] [PMC free article] [PubMed] [Google Scholar]
- 42.Berns DH, Ross JS, Kormos D, Modic MT. The spinal vacuum phenomenon -evaluation by gradient echo MR imaging. J Comput Assist Tomogr. 1991;15:233–6. doi: 10.1097/00004728-199103000-00008. [DOI] [PubMed] [Google Scholar]
- 43.Klibanov AL. Ligand-carrying gas-filled microbubbles: ultrasound contrast agents for targeted molecular imaging. Bioconjug Chem. 2005;16:9–17. doi: 10.1021/bc049898y. [DOI] [PubMed] [Google Scholar]
- 44.Toth E, Helm L, Merbach AE. Relaxivity of MRI contrast agents. Top Curr Chem. 2002;221:61–101. [Google Scholar]
- 45.Duncan PB, Needham D. Test of the Epstein-Plesset model for gas microparticle dissolution in aqueous media: effect of surface tension and gas under-saturation in solution. Langmuir. 2004;20:2567–78. doi: 10.1021/la034930i. [DOI] [PubMed] [Google Scholar]
- 46.Kim DH, Costello MJ, Duncan PB, Needham D. Mechanical properties and microstructure of polycrystalline phospholipid monolayer shells: novel solid microparticles. Langmuir. 2003;19:8455–66. [Google Scholar]
- 47.Saad SMI, Policova Z, Acosta EJ, Hair ML, Neumann AW. Mixed DPPC/DPPG monolayers at very high film compression. Langmuir. 2009;25:10907–12. doi: 10.1021/la901250z. [DOI] [PubMed] [Google Scholar]
- 48.Israelachvili J. Intermolecular and surface forces. 2. Academic Press; 1992. [Google Scholar]
- 49.Lewis BA, Engelman DM. Lipid bilayer thickness varies linearly with acyl chain-length in fluid phosphatidylcholine vesicles. J Mol Biol. 1983;166:211–7. doi: 10.1016/s0022-2836(83)80007-2. [DOI] [PubMed] [Google Scholar]
- 50.Petrache HI, Dodd SW, Brown MF. Area per lipid and acyl length distributions in fluid phosphatidylcholines determined by H-2 NMR spectroscopy. Biophys J. 2000;79:3172–92. doi: 10.1016/S0006-3495(00)76551-9. [DOI] [PMC free article] [PubMed] [Google Scholar]
- 51.Nagle JF, Tristram-Nagle S. Structure of lipid bilayers. Biochim Biophys Acta. 2000;1469:159–95. doi: 10.1016/s0304-4157(00)00016-2. [DOI] [PMC free article] [PubMed] [Google Scholar]
- 52.Farny CH, Holt RG, Roy RA. Temporal and spatial detection of HIFU-induced intertial and hot-vapor cavitation with a diagnostic ultrasound system. Ultrasound Med Biol. 2009;35:603–15. doi: 10.1016/j.ultrasmedbio.2008.09.025. [DOI] [PubMed] [Google Scholar]
- 53.O’Reilly MA, Hynynen KA. PVDF receiver for ultrasound monitoring of transcranial focused ultrasound therapy. IEEE Trans Biomed Eng. 2010;57:2286–94. doi: 10.1109/TBME.2010.2050483. [DOI] [PMC free article] [PubMed] [Google Scholar]
- 54.Hsieh CY, Smith PP, Mayia F, Ye GL. An adaptive spectral estimation technique to detect cavitation in HIFU with high spatial resolution. Ultrasound Med Biol. 2011;37:1134–50. doi: 10.1016/j.ultrasmedbio.2011.04.011. [DOI] [PubMed] [Google Scholar]
- 55.Huang JW, Xu JS, Xu RX. Heat-sensitive microbubbles for intraoperative assessment of cancer ablation margins. Biomaterials. 2010;31:1278–86. doi: 10.1016/j.biomaterials.2009.11.008. [DOI] [PubMed] [Google Scholar]


