

Abstract
Perturbed microRNA (miR) expression is a feature of, and may play a fundamental role in, certain disease states such as different forms of cancer. Retinitis pigmentosa (RP) a group of inherited retinal degenerations is characterised by a progressive loss of photoreceptor cells and consequent visual handicap. We have previously reported an altered pan-retinal expression of miR-96, -183, -1 and -133 in a P347S-Rhodopsin transgenic mouse model of RP. As many different mutations in Rhodopsin and other genes such as RDS/Peripherin can lead to RP, it was of interest to explore whether the characterized retinal miR expression signature was observed in three other mouse models of RP linked to rhodopsin and rds/peripherin. Therefore, pan-retinal expression of miR-96, -182, -183, -1, -133 and -142 was analysed using quantitative real-time RT-PCR. A common signature of altered miR expression was found; expression of miR-96, -182 and -183 decreased by 14.1-53.2%, while expression of miR-1, -133 and -142 was up-regulated by 186.1-538.5%. Significantly, the detected pan-retinal miR signature was mirrored by similar miR expression profiles in FACS-isolated rod photoreceptors from these mice. In an attempt to understand the function of these miRs, corresponding target genes were predicted using computational means. Many ‘enriched’ targets (with binding sites for at least two of the above miRs) were found to be regulatory molecules and members of intracellular signaling circuits. However, further studies are required to highlight which of the large number of in silico predicted targets are actually controlled by these miRs.
Keywords: microRNA, eye, retina, retinitis pigmentosa, neurodegeneration, mouse model, target prediction, FACS
Introduction
Mature microRNA (miR) transcripts are small (∼22 nucleotides) non-coding RNAs that control eukaryotic gene expression at the post-transcriptional level by interacting with target mRNAs, which either results in mRNA cleavage or translational repression (Bartel 2004). Tissue-specific expression of miRs is well documented; however, a clear understanding of the functions of the majority of miRs remains elusive. The critical roles played by miRs in developmental and, in particular disease processes, has attracted immense attention (Kloosterman and Plasterk 2006; Chang et al. 2008). While a number of miRs that are highly expressed in the mouse retina have been identified (Ryan et al. 2006; Karali et al. 2007), the fundamental roles of miR regulation in this tissue are not yet understood (Arora et al. 2007; Loscher et al. 2007; Xu et al. 2007). A group of inherited retinal degenerations with different genetic origins but similar clinical manifestations involving progressive photoreceptor loss and visual impairment is known by the umbrella term retinitis pigmentosa (RP; RetNet http://www.sph.uth.tmc.edu/Retnet/). Our recent data (Loscher et al. 2007) from studies using P347S-Rhodopsin transgenic mice (R347; Li et al. 1996), a model of RP, provided evidence of altered pan-retinal expression of miR-96, -183, -1 and -133 suggesting a potential involvement of miRs in retinal disease. As RP is characterized by both intergenic and intragenic mutational heterogeneity, the aim of this study was to determine whether the identified retinal miR expression signature was present in other rhodopsin (rho) and rds/peripherin (rds)-linked mouse models of RP. For instance, a rho knockout (rho-/-) mouse line exhibits a severe retinal degeneration (Humphries et al. 1997). Additionally, mutations in the RDS/Peripherin gene, which encodes the photoreceptor specific protein rds/peripherin, are also causative of RP (RetNet http://www.sph.uth.tmc.edu/Retnet/). Notably, transgenic mice carrying a deletion in codon 307 of the rds gene (Δ307; McNally et al. 2002), modeling a similar human mutation responsible for a dominant form of RP (RetNet http://www.sph.uth.tmc.edu/Retnet/), and mice with a naturally occurring null mutation in this gene (rds-/-; Sanyal et al. 1980) display progressive retinopathy. A further objective was to clarify whether the observed miR expression signature was a result of genuine alterations in miR expression in retinal cells. Particularly, a common signature of miR dysregulation in the analyzed diseased retinas, reflected by similar miR expression profiles in rod photoreceptors of Δ307 and R347 mice, has emerged from the study.
Materials and Methods
P347S-Rhodopsin (R347; Li et al. 1996), Δ307-rds (Δ307; McNally et al. 2002), rho knockout (rho-/-; Humphries et al. 1997), rds null mutant (rds-/-; Sanyal et al. 1980), Rhodopsin-GFP (RGFP; Chan et al. 2004), wild type balbC and 129 mice were bred under specific pathogen free (SPF) housing conditions. Mice at one month of age were sacrificed and three retinal samples/mouse line were prepared by pooling six retinas/group. For fluorescence-activated cell sorting (FACS) analysis, RGFP+/-, RGFP+/- Δ307+/- and RGFP+/- R347+/- mice at one month of age were sacrificed and three samples/mouse line were prepared by pooling two retinas/group. Retinas were dissociated using trypsin and cells analyzed and separated by FACS as previously described (Palfi et al. 2006). Total RNA from pan-retinal samples and FACS-isolated retinal cells was extracted and quantitative real-time RT-PCR (qRT-PCR) performed as described (Palfi et al. 2006; Loscher et al. 2007). Equal amounts of RNA (10ng/reaction) were used in each RT reaction. SnoRNA-202 and -234, with strong correlation in their expressions across all samples (r2=0.8958 and p<0.0001), were used as internal controls. For histology, eyes from two animals/strain were fixed in 4% paraformaldehyde, cryoprotected, sectioned (12 μm), and nuclei counterstained with DAPI. Outer nuclear layer (ONL) thickness was measured using microscopic images from sections in three planes 250 μm apart in the medial part of the eye using Photoshop (Adobe Systems Europe Ltd., Glasgow, UK). Analysis of statistical significance was performed using ANOVA, Student's t-test and Pearson's correlation. In silico target predictions using miRanda (John et al. 2004) and PicTar-Dog (Krek et al. 2005) were retrieved from miRGator (Nam et al. 2008). The intersections of the predicted miR targets, retinal transcriptome and human eye disease genes were obtained as described (Loscher et al. 2007); an additional retinal gene list was included in the analysis (Arora et al. 2007).
Results
The retinal miR expression of the previously reported miRs; miR-96, -183, -1 and -133 (Loscher et al. 2007) and two additional miRs; miR-182 and -142, were explored in the current study. MiR-182 belongs to a sensory organ specific miR cluster along with miR-96 and -183 (Xu et al. 2007), while miR-142 exhibited marked changes in previous array experiments (Loscher et al. 2007). We aimed to test whether the reported miR expression signature detected in R347 animals involving a Rhodopsin mutation (Loscher et al. 2007), characterize other photoreceptor-linked mouse models of RP such as rho-/-, Δ307 and rds-/-. Therefore, the retinal expressions of these six miRs were analyzed by qRT-PCR in the above mice.
An early time-point of one month of age was chosen for the study, to minimize the possibility that miR expression changes resulted from altered cell compositions in degenerating mouse retinas. At this time-point, there is at maximum a 31.8% reduction in the ONL thickness of the retina in the various mutant mouse lines used for the study as determined by retinal histology (Fig. 1). As the rds-/- mice are on a balbC background and the remaining mouse lines evaluated are on a 129 background, wild type balbC and 129 mice were used as controls. ONL thickness of wild type balbC and 129 mice did not differ significantly from each other (Fig. 1).
Figure 1. Comparative histology of retinas from rho- and rds-linked RP mouse models.
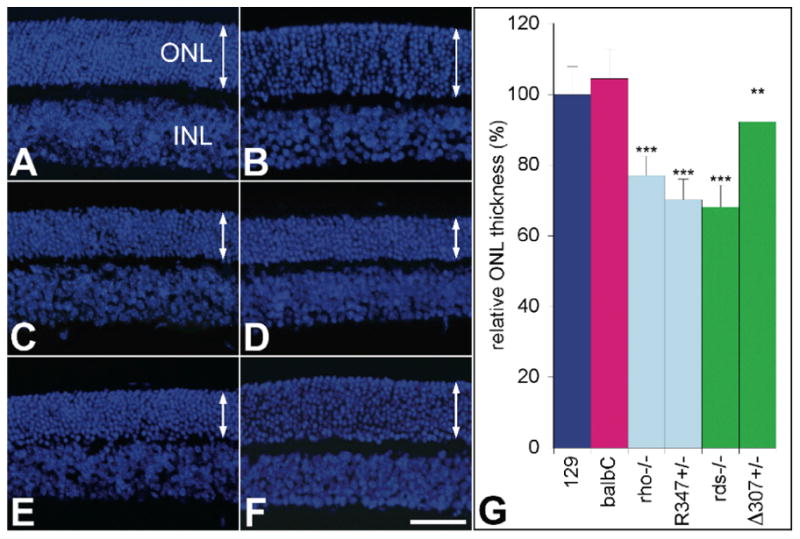
Representative microscopic images illustrate retinas of (A) 129, (B) balbC, (C) rho-/-, (D) R347+/-, (E) rds-/- and (F) Δ307+/- mice. Cell nuclei were counterstained by DAPI and outer nuclear layer (ONL) thickness was measured in microscopic images and corresponding average values plotted (G). Arrows indicate the thickness of the ONLs. INL: inner nuclear layer; scale bar represents 25 μm; **: p<0.01; ***: p<0.001.
Particularly, a common trend in pan-retinal miR expression profiles was observed among the analyzed mouse models (Fig. 2). The expression of miR-96, -182 and -183 decreased by 14.1-53.2% (Fig. 2 A) while expression of miR-1, -133 and -142 was up-regulated by 186.1-538.5% in the mutant retinas (Fig. 2 B). Note, that basal expression of these miRs was lower in wild type balbC than in 129 mice (Fig. 2 B).
Figure 2. Pan-retinal miR expression signature in rho- and rds-linked RP mouse models.
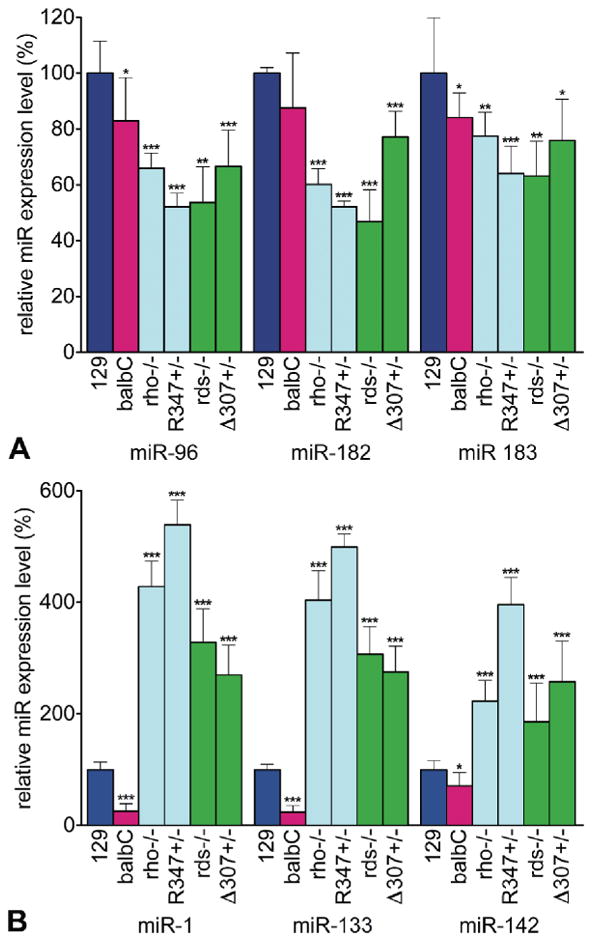
Expression levels of miR-96, -182, -183 (A) and miR-1, -133 and -142 (B) were analyzed by qRT-PCR and normalized to wild type 129 values. Note, that as rds-/- mice are on a balbC background, for p-value calculations data from rds-/- mice were compared to those from wild type balbC mice. *: p<0.05; **: p<0.01; ***: p<0.001.
To clarify whether the above changes in miR expression were due to altered miR expression in retinal cells or changes in retinal cell composition, RGFP mice with selective expression of GFP in rod photoreceptors were used. Firstly, to ensure that RGFP does not interfere with retinal expression of miR-96, -182, -183, -1, -133 and -142, the expression of these miRs was compared in retinal RNA samples of RGFP+/- and wild type 129 mice (Suppl. Fig. 1). Minor variations in expression of the above six miRs were found; however the expression of miR-142 was raised by 48.6 % in RGFP+/- mice compared to wild type 129 mice.
Δ307 and R347 mouse models were selected for further analysis and crossed onto the RGFP background. Retinas from resulting RGFP+/- Δ307+/- and RGFP+/- R347+/- mice along with RGFP+/- and wild type 129 (controls) mice were analyzed by histology and FACS (Fig. 3). A strong expression of GFP in the outer segments of photoreceptor cells and the ONL in retinas of mice with RGFP+/- genotypes compared to retinas in wild type 129 mice was detected by histology (Fig. 3 A, B, E, F, I, J, M and N). In order to elucidate the rod photoreceptor-specific expression pattern of the above six miRs, rods (GFP-positive) and non-rod cells (GFP-negative) from wild type RGFP+/- and RGFP+/- Δ307+/- and RGFP+/- R347+/- mice were separated by FACS. Similar scatter plots for all four mouse lines (Fig. 3 C, G, K and O) and strong GFP fluorescence in retinas with RGFP background (Fig. 3 D, H, L and P) were found. MiR expression levels in rod photoreceptors and non-rod cells in wild type RGFP+/- retinas are illustrated in Fig. 4. The expression levels of miR-96, -182 and -183 were significantly higher in rods by up to 100% (Fig. 4). Conversely, expression levels of miR-1, -133 and -142 were higher in non-rod cells by up 723.7%, 551.5% and 2665.0% respectively (Fig. 4).
Figure 3. Histological and FACS analysis of RGFP-Δ307 and -R347 retinas.
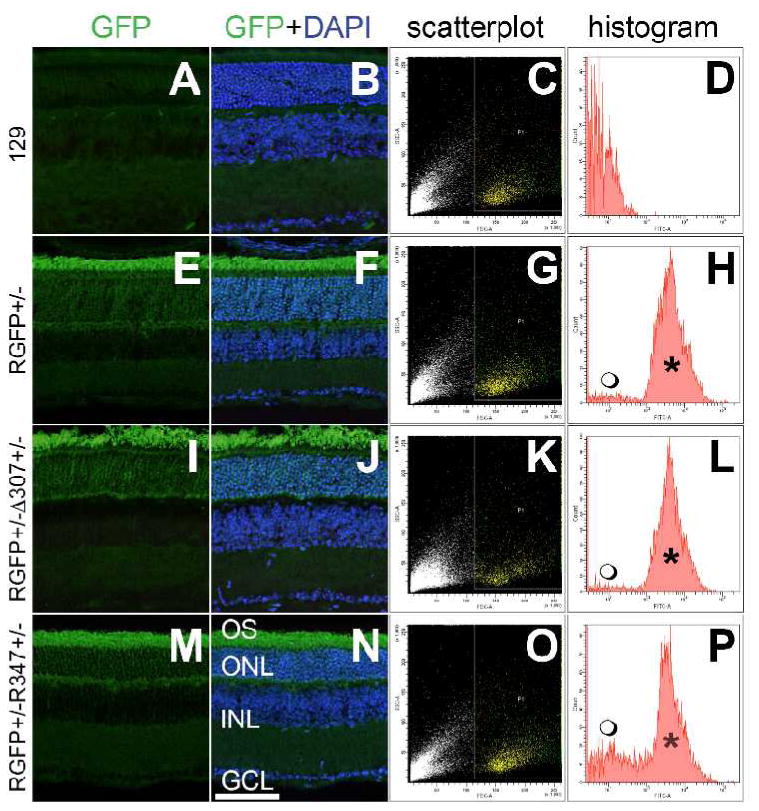
One month-old wild type 129 (A and B), RGFP+/- (E and F), RGFP+/- Δ307+/- (I and J) and RGFP+/- R347+/- retinas were analyzed for GFP fluorescence; cell nuclei were counterstained with DAPI. Retinas from the above mice were dissociated with trypsin and analyzed by FACS. Forward- versus side-scatter plots of retinal cells are depicted on C, G, K and O; yellow dots represent the gated populations. GFP fluorescence histograms of the gated populations are given in D, H, L and P; GFP-positive peaks are marked by *. Also note the GFP-negative populations (
 ), which correspond to non-rod cells in the dissociated retinas on the RGFP background (H, L and P). INL: inner nuclear layer; GCL: ganglion cell layer. Scale bar represents 25 μm.
Figure 4. Comparative miR expression of rod and non-rod cells in RGFP retinas.
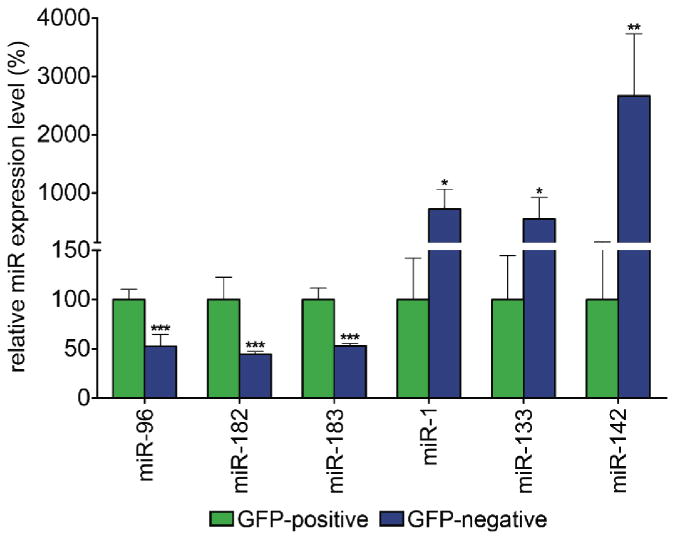
Retinas from wild type RGFP+/- mice were dissociated with trypsin and GFP-positive (rod cells) and GFP-negative (non-rod cells) were separated by FACS. Expression levels of miR-96, -182, -183, -1, -133 and -142 in the GFP-positive (green columns) and GFP-negative (blue columns) cells were analyzed by qRT-PCR and levels are expressed relative to rod values. Note, that the Y axis is discontinuous; *: p<0.05; **: p<0.01; ***: p<0.001.
In sorted cell populations from RGFP+/- Δ307+/- and RGFP+/- R347+/- mice compared to those from wild type RGFP+/- mice the levels of expression of the six miRs were significantly altered (Fig. 5). In RGFP+/- R347+/- mice, miR-96, -182, and -183 expressions were reduced significantly in both rod photoreceptors by up to 38.6%, and non-rod cells by up to 62.5% (Fig. 5 A). In RGFP+/- Δ307+/- mice, expression of these miRs did not change in rod photoreceptors (except for an increase in expression of miR-183 by 18.9%), while decreased by up to 27.8 % in non-rod cells (Fig. 5 A). Expression levels of miR-1, -133 and -142 were vastly increased in rod photoreceptors in RGFP+/- Δ307+/- by 1698.4%, 1406.7% and 527.9% respectively, and in RGFP+/- R347+/- mice by 2144.8%, 2048.9% and 882.8% respectively (Fig. 5 B). In non-rod cells, miR-1 and -133 were significantly reduced in the RGFP+/- R347+/- by up to 73.5%, while no significant alterations were observed in the RGFP+/- Δ307+/- mice (Fig. 5 B).
Figure 5. MiR expression signature in rod and non-rod cells in Δ307 and R347 retinas.
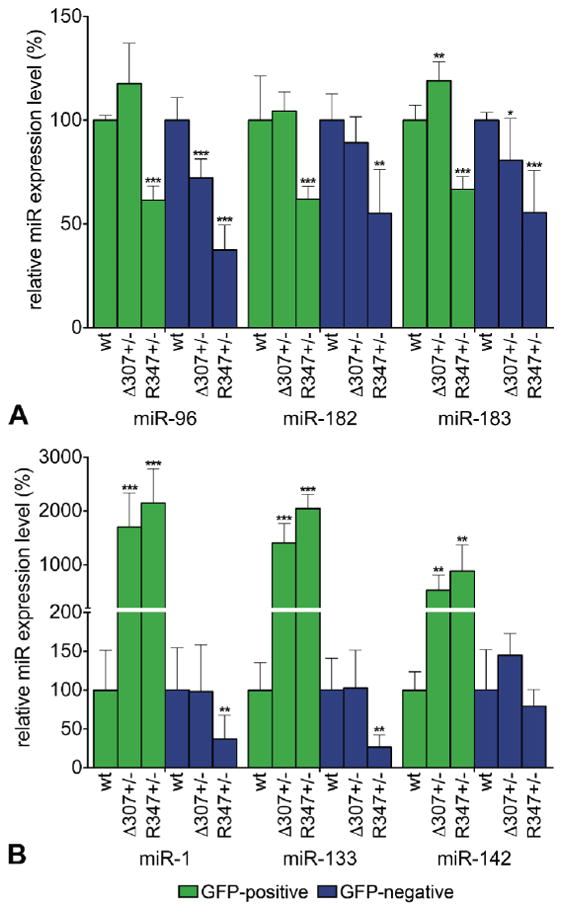
Retinas from RGFP+/- (wild type control), RGFP+/- Δ307+/- and RGFP+/- R347+/- mice were dissociated with trypsin and GFP-positive (rod) and GFP-negative (non-rod) cells were separated by FACS. Expression levels of miR-96, -182, -183 (A) and miR-1, -133 and -142 (B) in the GFP-positive (green columns) and GFP-negative (blue columns) cells were analyzed by qRT-PCR. Expression levels were normalized to the wild type control (RGFP+/-). Note, that the Y axes are set to a different scale in A and B and the Y axis is discontinuous in B. wt: RGFP+/-; Δ307+/-: RGFP+/- Δ307+/-; R347+/-: RGFP+/- R347+/-; *: p<0.05; **: p<0.01; ***: p<0.001.
In silico miR target prediction revealed an average number of 846, 266 and 48 targets/miR using miRanda, PicTar-Dog and their intersection, respectively (Table 1). On average, 48.3% (409 out of 846) of miRanda targets were present in the retinal transcriptome, and 4.2% (17 out of 409) overlapped with retinal disease genes (Table 1). The intersection of retinally expressed genes and both target predictions revealed an average of 36 targets/miR. Figure 6 summarizes the retinally expressed subset of miRanda target predictions for miR-96, -182 and -183 (Fig. 6 A) and miR-1, -133 and -142 (Fig. 6 B). Targets for each miR group, with binding sites for at least two of their miRs (‘enriched targets’; intersections in Fig. 6 A and B), include proteins with various functions, such as transcriptional regulation, signal transduction, RNA/DNA processing, cytoskeletal components, intracellular trafficking, cell cycle and apoptosis (Suppl. Table 1 and 2).
Table 1. Summary of in silico target predictions for miR-96, -182, -183, -1, -133 and -142.
| miR name | Number of predicted targets (miRanda/PicTar-Dog/intersection) | Number of miRanda targets (retinal transcriptome/retinal disease genes) | Intersection of miRanda and PicTar-Dog targets (retinal transcriptome/retinal disease genes) |
|---|---|---|---|
|
| |||
| miR-96 | 869 / 435 / 69 | 428 / 23 | 43 / 2 |
| miR-182 | 860 / 396 / 60 | 427 / 14 | 50 / 0 |
| miR-183 | 900 / 143 / 36 | 441 / 15 | 30 / 0 |
| miR-1 | 777 / 289 / 44 | 357 / 16 | 34 / 2 |
| miR-133 | 860 / 207 / 44 | 419 / 17 | 32 / 1 |
| miR-142 | 807 / 125 / 33 | 381 / 14 | 28 / 0 |
|
| |||
| Average | 846 / 266 / 48 | 409 / 17 | 36 / <1 |
Figure 6. Venn diagrams of miRanda-predicted miR targets.
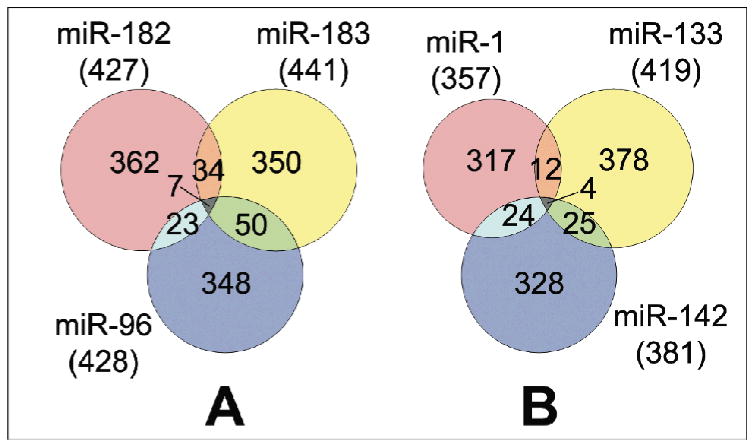
Venn diagrams summarise overlapping retinal targets predicted by miRanda for the miR-96/182/183 cluster (A) and for the miR-1/133 cluster with miR-142 (B).
Discussion
A common signature of altered miR expression in the retinas of two rho- and two rds-linked RP models was revealed in this study, in agreement with our initial R347 results (Loscher et al. 2007). Mice modeling possible genotypes of patients with dominant (R347+/-; Loscher et al. 2007; and Δ307+/-) and recessive (rho-/- and rds-/-) forms of Rhodopsin- and RDS/Peripherin-linked RP exhibited comparable pan-retinal expressions of the six analyzed miRs. Additionally, this miR expression signature was also reflected in rod photoreceptors of Δ307 and R347 mice.
While it is possible that the observed pan-retinal miR signature is partially due to changes in cellular composition of the retina, in principle these changes should not exceed the percentage of the photoreceptor cell loss (up to 31.8%; Fig. 1 G). Therefore it is unlikely that partial loss of photoreceptors accounts for up to 538.5% increase of miR-1, -133 and -142 expression in the retina; rather, bona fide alterations in miR expression may underlie events of tissue remodeling during neurodegeneration. On the other hand, the expression levels of miR-96, -182 and -183 in the pan-retinal analysis decreased by 14.1-53.2%, a value that is similar to the reduction in thickness of the ONL (Fig. 1 G).
In order to resolve this ambiguity, Δ307 and R347 RP models were derived on an RGFP background enabling the separation of rod photoreceptors from the remaining retinal cells by dissociation and subsequent FACS analysis of the retina. Using qRT-PCR on FACS sorted retinal cells from wild type RGFP+/- retinas, we have demonstrated that miR-96, -182 and -183 are expressed at higher levels in rod than in non-rod cells in the wild type retina; this is in agreement with previous data (Ryan et al. 2006; Karali et al. 2007; Xu et al. 2007). On the other hand, it was established that miR-1, -133 and -142 were preferentially expressed in the non-rod cell population, a finding that was not previously known.
Interestingly, the increase detected in pan-retinal expression of miR-1, -133, and -142 (up to 538.5%; Fig. 2) in RP mice is caused by an enhancement in expression of these miRs (up to 2144.8%) in rod photoreceptors (at least in RGFP+/- Δ307+/- and RGFP+/- R347+/- mice), as expression of these miRs does not increase in non-rod cells (Fig. 4). Note, that the lower basal expression of these miRs in rods, and the actual decrease in expression of miR-1 and -133 in non-rods in R437 retinas, may explain the discrepancy between miR up-regulation values in pan-retinal and rod-specific samples. Further analysis of RGFP+/- R347+/- mice demonstrates that the decreased pan-retinal expression of miR-96, -182 and -183 (Fig. 2) is due, at least in part, to a bona fide decrease in expression of these miRs in rods (Fig. 4). In contrast, the lower pan-retinal expression of these miRs in Δ307 mice cannot be attributed to a reduced expression in rods. The observed differential regulation of miR-96, -182 and -183 in rod photoreceptors of Δ307 and R347 mice may represent different stages of degeneration; note the less severe retinopathy in Δ307 compared to R347 mice (Fig. 1). Expression of these miRs in non-rod cells also decreased (Fig. 4); however, as this population includes different cell types, our data does not demonstrate conclusively whether these changes are due to genuine alterations in miR expression within these cells or rearrangements of cell composition (Fig. 4). Notably, by combining the rod-specific expression of RGFP in wild type and RP mice with subsequent FACS of retinal cells, we were able to demonstrate a differential expression of miRs in cell populations of the wild type retina, and in particular an altered expression of miRs in rod photoreceptors of RP retinas, both of which are novel findings.
In wild type balbC mice compared to wild type 129 mice, expression levels of miR-96, -182, -183, and miR-1, -133 and -142 were reduced by up to 17.1% and 75.9%, respectively. Slight differences in expression of these miRs were detected in RGFP+/- retinas when compared to wild type 129 retinas. The significance and role of these findings are not clear, however we have previously reported comparable global miR expression profiles in wild type 129 and c57 mice (Loscher et al. 2007).
The functions of the discussed six miRs in the retina and elsewhere have yet to be fully elucidated. MiR-96, -182 and -183 belong to a sensory organ-specific cluster, have a high relative expression in the retina (Arora et al. 2007; Loscher et al. 2007; Xu et al. 2007) and may be involved in circadian rhythm regulation (Xu et al. 2007). Indeed the close correlation of miR-96, -182 and -183 expression described in this study is most likely a result of co-regulation, due to the arrangement of their genes as a polycystronic cluster. MiR-1 and -133 form another miR cluster and have potential roles in muscle (Care et al. 2007), while miR-142 is expressed for example in T-lymphocytes (Wu et al. 2007). MiR-1 -133 and -142 have a low expression in the retina relative to other tissues (Loscher et al. 2007) and to date have undefined retinal roles in the retina. Both in silico (Krek et al. 2005) and experimental evidence (Lim et al. 2005) indicate that a single miR may target hundreds of mRNAs while several co-expressed miRs may target a single mRNA (Bartel 2004); suggesting that the collective action of multiple miRs, expressed in specific spatio-temporal manners, may define miR regulation. This feature may in principle be exploited to characterize relevant gene targets, by focusing on targets that possess potential binding sites for at least two different miRs that are regulated in a similar fashion. In silico analysis adopting this approach was utilized to generate ‘enriched’ predicted targets for miR clusters. Many of these ‘enriched’ predicted targets, for both the miR-96/182/183 and the miR-1/133 clusters (as miR-142 appear to be regulated in a similar fashion to miR-1 and -133 in this study, target enrichment for the this group was broadened with the addition of miR-142) play regulatory roles, including transcriptional regulators and various components of the intercellular signaling pathways. Another broad group of targets include members of the cytoskeletal network, vesicular functions and intracellular trafficking.
The use of computational enrichment, while valuable to drastically decrease target numbers, carries the risk of eliminating some noteworthy targets, that is those targets which do not contain multiple target sites for the analyzed miRs. In silico target predictions inherently contain a high degree of uncertainty, note for example the slight overlap (5.7% and 18.0%; Table 1) of miR targets between miRanda and PicTar-Dog predictions in this study. Determining genuine miR targets, currently the most fundamental challenge in miR research, will likely require high-throughput screening and validation techniques in wet-lab experiments. Identification of valid retinal mRNA targets and corresponding cellular pathways, would greatly assist in elucidating the role played by the above six miRs in healthy and diseased retinas.
Significantly, the results obtained suggest that a common pan-retinal miR expression signature, paralleled in the rod-specific miR profile associates with retinal degeneration, despite the variation of the causative disease genes (rho versus rds) and their dominant and recessive modes of action. Likewise, other neurodegenerative disorders may exhibit similar miR profiles largely independent of their genetic origins, a feature that could potentially be exploited in therapeutic development.
Supplementary Material
Supplemental Table 1: Shared targets for miR-96, -182 and -183
For each target gene corresponding chromosomal location, function, number of target sites/miR (hit), p-value and score associated with miRanda predictions are provided. Common targets shared by all three miRs are highlighted in light blue.
Supplemental Table 2: Shared targets for miR-1, -133 and -142
For each target gene corresponding chromosomal location, function, number of target sites/miR (hit), p-value and score associated with miRanda predictions are provided. Common targets shared by all three miRs are highlighted in light blue.
Pan-retinal expression levels of miR-96, -182, -183, -1, -133 and -142 were compared using qRT-PCR in RGFP+/- (green columns) and wild type 129 mice (blue columns). Expression levels were normalized to wild type 129 mice. *: p<0.05; ***: p<0.001.
Acknowledgments
Authors thank the staff of the Animal Unit, Trinity College Dublin, Ireland for animal husbandry and Dr. Alfonso Blanco Fernandez (Flow Cytometry Core Facility, University College Dublin, Ireland) for assisting with FACS analysis. This research was supported by funds from Health Research Board of Ireland (RP/2006/131and H01188).
Footnotes
There are no conflicting interests.
Contributor Information
Carol Loscher, Email: loschecj@tcd.ie.
Karsten Hokamp, Email: kahokamp@tcd.ie.
Peter Humphries, Email: pete.humphries@tcd.ie.
G. Jane Farrar, Email: gjfarrar@tcd.ie.
Arpad Palfi, Email: palfia@tcd.ie.
References
- Arora A, McKay GJ, Simpson DA. Prediction and verification of miRNA expression in human and rat retinas. Invest Ophthalmol Vis Sci. 2007;48:3962–7. doi: 10.1167/iovs.06-1221. [DOI] [PubMed] [Google Scholar]
- Bartel DP. MicroRNAs: genomics, biogenesis, mechanism, and function. Cell. 2004;116:281–97. doi: 10.1016/s0092-8674(04)00045-5. [DOI] [PubMed] [Google Scholar]
- Care A, Catalucci D, Felicetti F, Bonci D, Addario A, Gallo P, Bang ML, Segnalini P, Gu Y, Dalton ND, Elia L, Latronico MV, Hoydal M, Autore C, Russo MA, Dorn GW, 2nd, Ellingsen O, Ruiz-Lozano P, Peterson KL, Croce CM, Peschle C, Condorelli G. MicroRNA-133 controls cardiac hypertrophy. Nat Med. 2007;13:613–8. doi: 10.1038/nm1582. [DOI] [PubMed] [Google Scholar]
- Chan F, Bradley A, Wensel TG, Wilson JH. Knock-in human rhodopsin-GFP fusions as mouse models for human disease and targets for gene therapy. Proc Natl Acad Sci U S A. 2004;101:9109–14. doi: 10.1073/pnas.0403149101. [DOI] [PMC free article] [PubMed] [Google Scholar]
- Chang TC, Yu D, Lee YS, Wentzel EA, Arking DE, West KM, Dang CV, Thomas-Tikhonenko A, Mendell JT. Widespread microRNA repression by Myc contributes to tumorigenesis. Nat Genet. 2008;40:43–50. doi: 10.1038/ng.2007.30. [DOI] [PMC free article] [PubMed] [Google Scholar]
- Humphries MM, Rancourt D, Farrar GJ, Kenna P, Hazel M, Bush RA, Sieving PA, Sheils DM, McNally N, Creighton P, Erven A, Boros A, Gulya K, Capecchi MR, Humphries P. Retinopathy induced in mice by targeted disruption of the rhodopsin gene. Nat Genet. 1997;15:216–9. doi: 10.1038/ng0297-216. [DOI] [PubMed] [Google Scholar]
- John B, Enright AJ, Aravin A, Tuschl T, Sander C, Marks DS. Human MicroRNA targets. PLoS Biol. 2004;2:e363. doi: 10.1371/journal.pbio.0020363. [DOI] [PMC free article] [PubMed] [Google Scholar]
- Karali M, Peluso I, Marigo V, Banfi S. Identification and characterization of microRNAs expressed in the mouse eye. Invest Ophthalmol Vis Sci. 2007;48:509–15. doi: 10.1167/iovs.06-0866. [DOI] [PubMed] [Google Scholar]
- Kloosterman WP, Plasterk RH. The diverse functions of microRNAs in animal development and disease. Dev Cell. 2006;11:441–50. doi: 10.1016/j.devcel.2006.09.009. [DOI] [PubMed] [Google Scholar]
- Krek A, Grun D, Poy MN, Wolf R, Rosenberg L, Epstein EJ, MacMenamin P, da Piedade I, Gunsalus KC, Stoffel M, Rajewsky N. Combinatorial microRNA target predictions. Nat Genet. 2005;37:495–500. doi: 10.1038/ng1536. [DOI] [PubMed] [Google Scholar]
- Li T, Snyder WK, Olsson JE, Dryja TP. Transgenic mice carrying the dominant rhodopsin mutation P347S: evidence for defective vectorial transport of rhodopsin to the outer segments. Proc Natl Acad Sci U S A. 1996;93:14176–81. doi: 10.1073/pnas.93.24.14176. [DOI] [PMC free article] [PubMed] [Google Scholar]
- Lim LP, Lau NC, Garrett-Engele P, Grimson A, Schelter JM, Castle J, Bartel DP, Linsley PS, Johnson JM. Microarray analysis shows that some microRNAs downregulate large numbers of target mRNAs. Nature. 2005;433:769–73. doi: 10.1038/nature03315. [DOI] [PubMed] [Google Scholar]
- Loscher CJ, Hokamp K, Kenna PF, Ivens AC, Humphries P, Palfi A, Farrar GJ. Altered retinal microRNA expression profile in a mouse model of retinitis pigmentosa. Genome Biol. 2007;8:R248. doi: 10.1186/gb-2007-8-11-r248. [DOI] [PMC free article] [PubMed] [Google Scholar]
- McNally N, Kenna PF, Rancourt D, Ahmed T, Stitt A, Colledge WH, Lloyd DG, Palfi A, O'Neill B, Humphries MM, Humphries P, Farrar GJ. Murine model of autosomal dominant retinitis pigmentosa generated by targeted deletion at codon 307 of the rds-peripherin gene. Hum Mol Genet. 2002;11:1005–16. doi: 10.1093/hmg/11.9.1005. [DOI] [PubMed] [Google Scholar]
- Nam S, Kim B, Shin S, Lee S. miRGator: an integrated system for functional annotation of microRNAs. Nucleic Acids Res. 2008;36:D159–64. doi: 10.1093/nar/gkm829. [DOI] [PMC free article] [PubMed] [Google Scholar]
- Palfi A, Ader M, Kiang AS, Millington-Ward S, Clark G, O'Reilly M, McMahon HP, Kenna PF, Humphries P, Farrar GJ. RNAi-based suppression and replacement of rds-peripherin in retinal organotypic culture. Hum Mutat. 2006;27:260–8. doi: 10.1002/humu.20287. [DOI] [PubMed] [Google Scholar]
- RetNet. http://www.sph.uth.tmc.edu/Retnet/
- Ryan DG, Oliveira-Fernandes M, Lavker RM. MicroRNAs of the mammalian eye display distinct and overlapping tissue specificity. Mol Vis. 2006;12:1175–84. [PubMed] [Google Scholar]
- Sanyal S, De Ruiter A, Hawkins RK. Development and degeneration of retina in rds mutant mice: light microscopy. J Comp Neurol. 1980;194:193–207. doi: 10.1002/cne.901940110. [DOI] [PubMed] [Google Scholar]
- Wu H, Neilson JR, Kumar P, Manocha M, Shankar P, Sharp PA, Manjunath N. miRNA Profiling of Naive, Effector and Memory CD8 T Cells. PLoS ONE. 2007;2:e1020. doi: 10.1371/journal.pone.0001020. [DOI] [PMC free article] [PubMed] [Google Scholar]
- Xu S, Witmer PD, Lumayag S, Kovacs B, Valle D. MicroRNA (miRNA) Transcriptome of Mouse Retina and Identification of a Sensory Organ-specific miRNA Cluster. J Biol Chem. 2007;282:25053–25066. doi: 10.1074/jbc.M700501200. [DOI] [PubMed] [Google Scholar]
Associated Data
This section collects any data citations, data availability statements, or supplementary materials included in this article.
Supplementary Materials
Supplemental Table 1: Shared targets for miR-96, -182 and -183
For each target gene corresponding chromosomal location, function, number of target sites/miR (hit), p-value and score associated with miRanda predictions are provided. Common targets shared by all three miRs are highlighted in light blue.
Supplemental Table 2: Shared targets for miR-1, -133 and -142
For each target gene corresponding chromosomal location, function, number of target sites/miR (hit), p-value and score associated with miRanda predictions are provided. Common targets shared by all three miRs are highlighted in light blue.
Pan-retinal expression levels of miR-96, -182, -183, -1, -133 and -142 were compared using qRT-PCR in RGFP+/- (green columns) and wild type 129 mice (blue columns). Expression levels were normalized to wild type 129 mice. *: p<0.05; ***: p<0.001.