Abstract
Time series are essential to health data research and data mining. We aim to study the properties of one of the more commonly available but historically unreliable types of data: administrative diagnoses in the form of the International Classification of Diseases, Ninth Revision (ICD9) codes. We use differential entropy of ICD9 code time series as a surrogate measure for disease time course and also explore Gaussian kernel smoothing to characterize the time course of diseases in a more fine-grained way. Compared to a gold standard created by a panel of clinicians, the first model classified diseases into acute and chronic groups with a receiver operating characteristic area under curve of 0.83. In the second model, several characteristic temporal profiles were observed including permanent, chronic, and acute. In addition, condition dynamics such as the refractory period for giving birth following childbirth were observed. These models demonstrate that ICD9 codes, despite well-documented concerns, contain valid and potentially valuable temporal information.
Index Terms: Biomedical informatics, clinical diagnosis, medical information systems, time series analysis
I. Introduction
There are many potential uses for structured diagnosis information—one important example is clinical research. Fortunately, the International Classification of Diseases, Ninth Revision (ICD9) codes, which document the conditions a particular patient was treated for, are ubiquitous and often used in clinical research. Unfortunately, it has been well documented that ICD9 codes can be noisy and unreliable [1]–[3]. Chart abstraction is the process of extracting information relevant to a particular purpose from medical records. When performed manually for clinical research, this process can be prohibitively expensive or otherwise infeasible [4]. Structured information such as ICD9 codes can and are used to automate this process. Other forms of structured diagnosis codes, such as the Systematized Nomenclature of Medicine-Clinical Terms (SNOMED-CT), are gaining in use, but we focus here on ICD9 codes. The methods presented here could apply equally well to time series of another type of diagnosis code.
Despite their well-documented problems, ICD9 codes are often used in research [5]–[9]. One of the major use cases is to characterize patient state at a particular moment in time. To do this, ICD9 codes from a particular date or from a time window are considered. Also, ICD9 codes are often used to characterize the medical history of a patient as a whole. In that case, the relevant information is whether an ICD9 code is present in a patient’s history at all [10]–[15].
II. Objectives
Time series are essential to health data research and data mining. We hypothesize that there is valid temporal information in ICD9 code time series in aggregate. To demonstrate this, we aim to test whether patterns of ICD9 codes reveal what is already known about disease time course. We think that it is important to view these data as time series. Using a form of lagged linear correlation, it has been previously demonstrated that there are certain correlational relationships that can only be demonstrated when time is taken into consideration and the data are considered in aggregate [16]–[18].
Despite the fact that clinicians are aware of the relative time course of most conditions, there are many reasons one may want to evaluate the time course of a condition for a particular population quantitatively. In particular, some future uses of these times series that motivate this study are: 1) a data driven representation of disease time course that can be evaluated for a wide range of conditions in a rapid and automated way; 2) the use of such a quantitative representation in other systems (e.g., clinical decision support); and 3) the use of such a quantitative representation to compare clinical populations. Although there are certainly biases that are unique to ICD9 codes, these biases should not be insurmountable. However, this study aims to determine whether there exist valid temporal signals that make addressing the biases worthwhile.
We first evaluate a simple summary statistic for ICD9 code time series and demonstrate that conditions can be stratified according to time course. Second, we use kernel smoothing to characterize the time course of conditions in a population in a more fine-grained way.
The aim of the first method is to create 1-D continuous measure that summarizes the documentation properties of a condition. Although, 1-D measure will not capture the many subtleties of disease dynamics, it could nonetheless be valuable in contexts where such subtleties are less relevant. In contrast to our second analysis that directly evaluates how documentation patterns change over time, this study uses an indirect measure, the uncertainty of documentation, as a marker for disease time course.
Differential entropy was chosen as a measure of time course because we hypothesized that there would be a larger difference in the variance of documentation than in the central tendency of documentation between chronic and acute conditions. Due to varying levels of completeness of the medical record, chronic conditions can, in certain ways, appear to be acute. This would be reflected in a large variance in the documentation of such conditions. On the other hand, acute conditions by their nature will likely have less variance.
The aim of the second method was to create a nonparametric estimate of disease time course. This was accomplished by estimating the probability of having a condition documented over time.
As electronic health record (EHR) adoption continues to grow, we should consider the potential secondary uses of the large quantities of data that will be collected [19]. These data can be used for learning about disease, building knowledge bases, and providing various types of cognitive support for clinicians [20], [21]. The authors’ long-term objective is to study the EHR as a natural object in order to understand the relationship between EHR data and the underlying truth [22].
III. Methods
A. Setting
The analysis was performed on data collected at New York-Presbyterian Hospital. The demographic of the population served by this medical center consists of 54% female, 46% male; 32% Hispanic; 57% white (including White Hispanic and non-Hispanic White), 28% black, and 15% Asian patients. ICD9 codes used for this study were acquired from inpatient, outpatient, and emergent clinical encounters from over 20 years. This was particularly important, since our main concern was capturing the most complete longitudinal time series possible for each patient.
This study was approved by the institutional review board.
B. Data Preprocessing
Table I (see) shows a set of 21 conditions/diseases that were chosen heuristically to span the range of chronicity from acute to chronic. Certain conditions are known to be acute [e.g., pregnancy and myocardial infarction (MI)], whereas others are known to be relatively chronic (e.g., diabetes and hypothyroidism).
TABLE I.
Condition Results and Categorization
| Condition | Patients | Expert | Differential Entropy |
|---|---|---|---|
| Acidosis | 3647 | Acute | −1333 |
| Acute Pyelonephritis | 3699 | Acute | −1388 |
| Alkalosis | 3097 | Acute | −1165 |
| Anemia | 20490 | Chronic | −1084 |
| Childbirth | 44052 | Acute | −1041 |
| Chronic Kidney Disease | 16082 | Chronic | −431 |
| Chronic Pyelonephritis | 419 | Chronic | −1471 |
| Diabetes | 50314 | Chronic | −211 |
| Disseminated Intravascular Coagulation | 392 | Acute | −1315 |
| Hemophilia | 407 | Chronic | −739 |
| Hepatitis | 12679 | Chronic | −600 |
| Hyperlipidemia | 56524 | Chronic | −549 |
| Hypo-parathyroidism | 329 | Chronic | −411 |
| Hypothyroidism | 17259 | Chronic | −1182 |
| Lupus | 2945 | Chronic | −1106 |
| Meningitis | 2062 | Acute | −1127 |
| Myocardial Infarction | 11338 | Acute | −1227 |
| Renal Failure | 11392 | Acute | −556 |
| Sepsis | 15917 | Acute | −658 |
| Sickle Cell Disease | 4110 | Chronic | −556 |
| Thyrotoxicosis | 5669 | Chronic | −658 |
Each disease was represented as a set of ICD9 codes. For each condition, a set of subtrees of the ICD9 hierarchy was identified to represent that condition. Any documentation of an ICD9 code within that set of subtrees was considered a positive incident for that condition. For example, the subtrees identified for representing meningitis have roots as ICD9 code 320, 321, and 322.
C. Differential Entropy as a Summary Statistic
For each of the included patient’s diagnoses, that is both a member of our candidate diagnoses and has been mentioned at least once, the authors calculated the proportion of times the diagnosis was mentioned given all opportunities for mention. An opportunity for mention was defined as a date where one or more ICD9 codes were recorded. The distribution of these proportions for each disease across all patients was estimated using a kernel density estimation (KDE). An estimate of the differential entropy for each of these KDEs was evaluated (see Appendix for details). Informally, the differential entropy represents the variability, or uncertainty, between patients for the proportion of visits that were documented for this condition.
Three independent physicians categorized conditions into chronic and acute. The majority categorization was used as the gold standard for evaluation of differential entropy as a measure of condition time course. The physician reviewers were required to categorize 21 candidate conditions into chronic or acute exclusively. Certain conditions are heterogeneous and could potentially be in either category, but clinicians were asked to make a judgment based on perceived prevalence.
D. Kernel Smoothing for Populations of Sparse Time Series
As in the first experiment, the same set of 21 conditions (20 medical conditions/diseases and childbirth) were considered in the analysis and each condition was represented as a set of subtrees of the ICD9 code hierarchy.
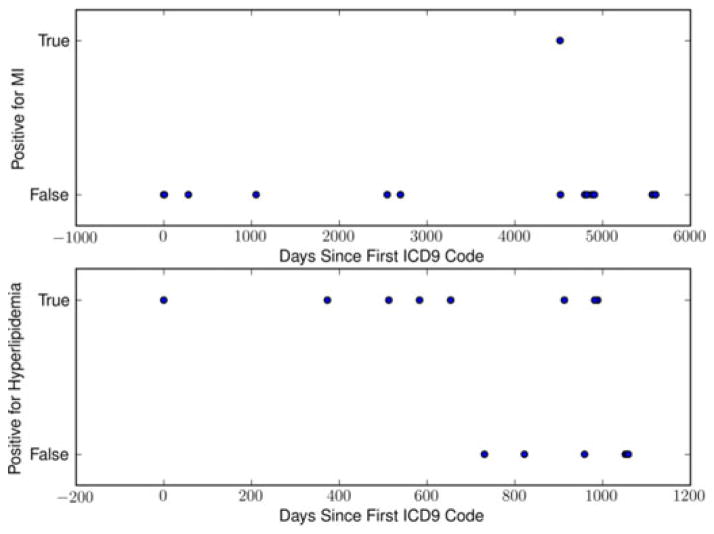
For each patient, a set of time series similar to those in Fig. 1 were created. Each time series concerned a specific condition that the patient was documented for at least once. The time series for all patients with a specific condition were then aligned by the first positive instance of that condition being documented. The time series were then aggregated and density estimates for both the positive instances alone and all opportunities for documentation were calculated [23]. Of note, these are not probability densities, but densities of mentions over time (see Appendix for details).
Fig. 1.
Example of ICD9 time series for MI, a typical acute condition, and Hyperlipidemia, a typical chronic condition.
To account for attrition, the density estimate of positive mentions in the population was divided by the density estimate of total mentions. The result is a point estimate at a given time for the probability of documentation for a specific condition after the first incidence of documentation.
IV. Results
A. Differential Entropy as a Summary Statistic
A set of 1 876 413 patients from a single academic medical center were considered, of which 176 098 were analyzed. The inclusion criteria were that a patient must have greater than three dates of documentation and have at least one mention for a condition in our set.
To review the results and understand the relationship between differential entropy and ICD9 code documentation patterns the authors will examine two conditions in detail: hyperlipidemia and MI.
For these two conditions, widely known to be chronic and acute, respectively, the documentation patterns should differ considerably. For hyperlipidemia, one should expect relatively consistent documentation once the diagnosis has been made; and for MI one would expect isolated incidences and no consistent pattern. Although, it is of course possible for acute conditions to recur.
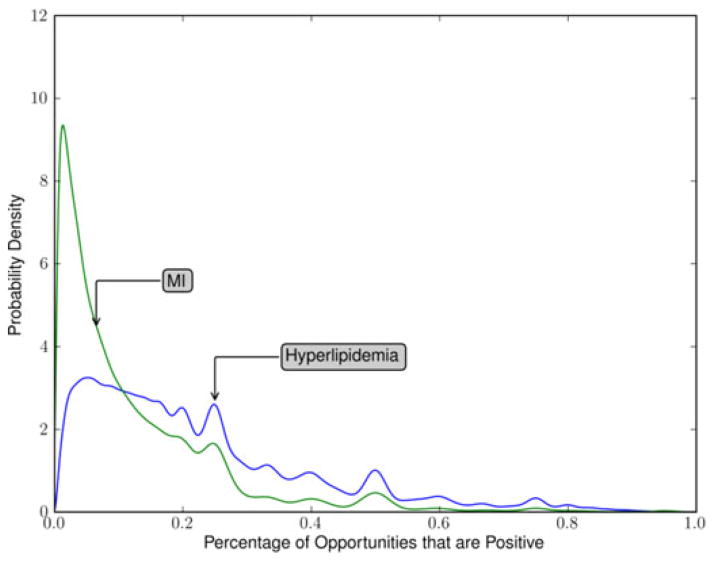
For each condition and for each example patient such as those illustrated in Fig. 1, a positive documentation proportion was calculated and the distribution of these proportions was estimated for each condition. For hyperlipidemia, as seen in Fig. 2, the distribution had wide variance, one major mode and several minor modes that are likely the result of patients with few visits on record. For MI, also seen in Fig. 2, there is a much higher mode indicating greater homogeneity in the population of documentation patterns.
Fig. 2.
Distribution of documentation proportions across patients for MI and hyperlipidemia.
By comparing the two curves in Fig. 2, it can be seen that the uncertainty regarding positive documentation proportions is far greater in hyperlipidemia compared to MI.
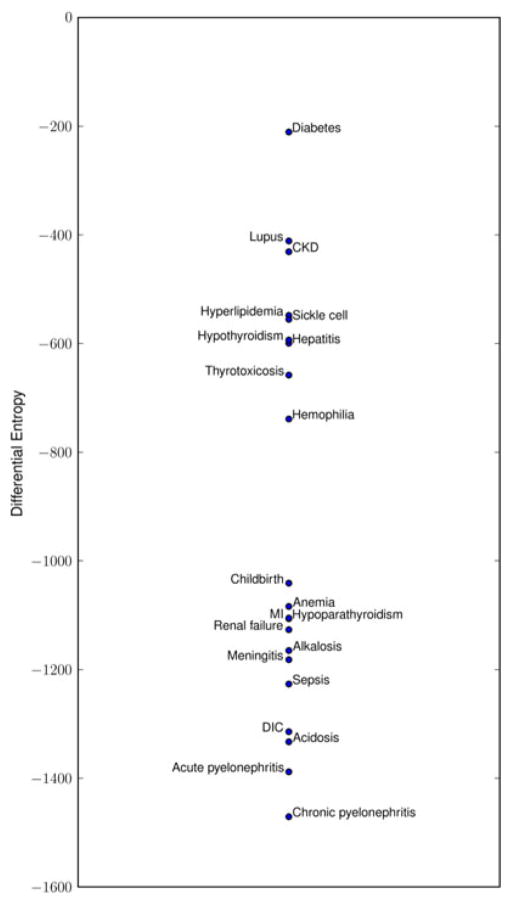
Fig. 3 shows the estimated entropies of hyperlipidemia and MI as well as for the other 19 conditions. Conditions seem to be clustered into two groups that roughly correspond to chronic and acute based on face validity. Chronic pyelonephritis, a condition with relatively few occurrences in our dataset, is an exception and is grouped together with the acute conditions.
Fig. 3.
Scaled (×1000) differential entropy of documentation distributions.
The differential entropy of these estimated distributions were compared to the gold standard of expert opinion. Table I shows the physician reviewers’ majority categorization. The resulting receiver operating characteristic (ROC) area under the curve (AUC) was 0.83 with a 95% confidence interval of 0.63 to 0.94 [24]. Also, the inter-rater reliability as measured by Fleiss’ Kappa was 0.87, indicating a high level of consensus among our physician reviewers.
B. Kernel Smoothing for Populations of Sparse Time Series
As in the first experiment, a set of records from 176 098 of 1 876 413 patients from a single academic medical center were analyzed. The inclusion criteria were that a patient must have greater than three dates of documentation and have at least one mention for a condition in our set.
An estimate for the probability of positive documentation over time for each of the 21 conditions was calculated. This analysis yielded many of the expected dynamics for the conditions considered. As examples, the authors will review the results for a relatively permanent condition (hypothyroidism) [25], two chronic conditions (thyrotoxicosis and diabetes), and two acute conditions (MI and childbirth).
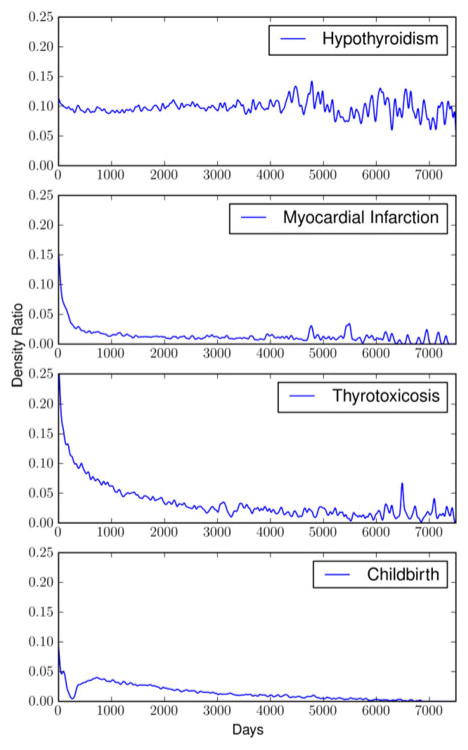
In the case of hypothyroidism, the authors observe a relatively constant probability of documentation following initial documentation (See Fig. 4). After approximately 11 or 12 years, there has been enough attrition of the patients from the original cohort to create a significant amount of variance in the ratio estimate. However, it appears that the mean remains relatively stable despite the increase in variance. Hypothyroidism is known to be a relatively permanent condition, often a result of radioactive iodine therapy or surgery. In the case of MI, an acute condition (albeit with chronic sequelae), it is expected that the probability of documentation should drop precipitously after the first incident. An interesting feature of the curve for MI is that there is a relatively sharp initial decline in the rate of documentation followed by a relatively flat low level probability that remains several years after the first incident. In the case of thyrotoxicosis, one observes a very smooth decline in the rate of documentation that is in between that of a very acute condition such as MI and a relatively permanent condition such as hypothyroidism. In childbirth, a recurring acute condition with a refractory period, this method demonstrates the dynamics associated with the refractory period in the months following the initial diagnosis of childbirth.
Fig. 4.
Documentation probability over time for hypothyroidism, MI, thyrotoxicosis, and childbirth.
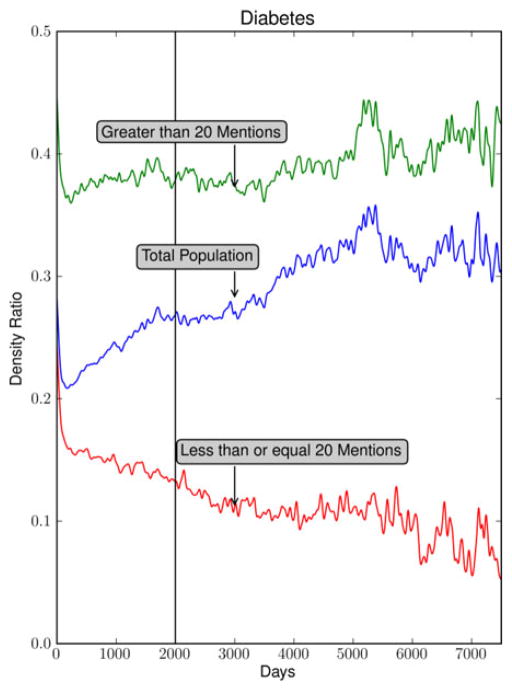
In the case of diabetes, a somewhat surprising pattern emerges (see Fig. 5). The ratio of positive to total mentions for the entire population of diabetes patients has a positive slope. The immediate interpretation for diabetes is that once a patient is diagnosed their probability of positive documentation for diabetes increases with time. This could be explained considering that many patients with diabetes develop increasing insulin resistance as time progresses [26].
Fig. 5.
Documentation probability over time for all diabetes patients, those with greater than 20 positive mentions, and those with less than or equal to 20 positive mentions.
However, another possibility as to why this might be is that there are two populations of patients described by this temporal profile.
To examine the possibility that there may be two populations in this data, the parameters of the analysis were explored. A simple division of the population of diabetes patients based on the total number of positive mentions (20) separates the population in two. Fig. 5 demonstrates the density ratio for patients with more than 20 positive mentions (7991 patients) as well as those with 20 or fewer positive mentions (42 323 patients). In cases with more than 20 positive mentions, the slope is no longer rising but is relatively flat. In cases with less than or equal to 20 positive mentions, the slope is negative.
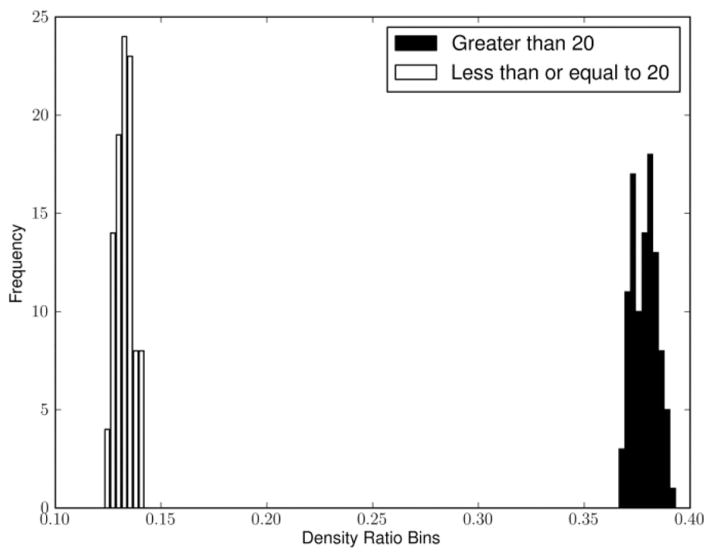
To evaluate the robustness of this result, Fig. 6 demonstrates that the variance of the density ratio is estimated at 2000 days (indicated in Fig. 5 with a vertical line) based on a bootstrap procedure is quite small for both groups. In addition, we found the mean and variance of these estimates (based on additional bootstrap procedures) to be insensitive to small changes in the threshold. For example, we estimated 0.361 with a 0.005 standard error (SE) for the > 10 group and 0.07 with a 0.004 SE for the < = 10 group at 2000 days after initial diagnosis. Similarly at 30, we estimated 0.392 with a 0.008 SE for the > 30 group and 0.176 with a 0.004 SE for the < = 30 group at 2000 days after initial diagnosis.
Fig. 6.
Bootstrapped samples of the density ratio for the group with > 20 mentions and the group with < = 20 mentions at 2000 days after initial diagnosis.
The small SE values are a reflection of the large population sizes. A more detailed evaluation of the population substructure would call for a cluster analysis which is beyond the scope of this paper.
V. Discussion
The results for the first experiment show that differential entropy of ICD9 code documentation patterns is an informative summary statistic for conditions. The reason for this is that there is more uncertainty about how someone will be documented if the condition he or she is being documented for is chronic. In other words, the pattern of documentation for chronic conditions can be similar to that of acute conditions if the documentation is incomplete. In summary, our analysis demonstrates that conditions that are relatively chronic as identified by our panel of physicians tend to have higher entropies and those conditions that are relatively acute tend to have lower entropies. We found that this 1-D measure is sufficiently informative about chronicity to classify conditions with an ROC AUC of 0.83 as compared to our gold standard.
Chronic pyelonephritis was an outlier in our analysis. As expected, the independent physician labeled it as a chronic condition yet it was placed at the acute end of the scale based on our measure. Our evaluation in the second experiment also revealed that chronic pyelonephritis had a documentation profile similar to that of an acute condition. A potential explanation for this is that there were few patients with at least one qualifying ICD9 code and of those many were documented for it very sparsely.
In the second experiment, empirical temporal profiles for the same set of conditions were examined. They revealed patterns that are congruent with current thoughts about these conditions.
For hypothyroidism, one would expect that the probability of documentation after the initial diagnosis to be relatively constant. For acute conditions such as an MI, one would expect a relatively rapid decay in time to zero or near zero (a feature that will be discussed further later). For chronic conditions such as thyrotoxicosis, one would expect a profile between that of the acute conditions such as an MI and the permanent conditions such as hypothyroidism.
The rapid decline in the curve for the MI followed by a relatively long and flat tail could be representing the residual risk for patients following their first MI [27]. More precisely, it is the probability of a positive documentation given an opportunity for documentation in the days following their first MI.
Finally, in the case of diabetes, the population was separated into two cohorts to examine the possibility of there being more than one population in the analysis. Fig. 5 demonstrates the upward slope of the graph for diabetes. This temporal profile could also be an artifact of the particular patients seen at the academic medical center in question, an artifact of a large scale diabetes study, or it may be that there truly are two populations of diabetes patients. However, there seem to be at least two populations; one that has a recovery rate represented by the negative slope of the ≤20 curve of Fig. 5 and another more severe population represented by the flat slope of the >20 curve. Although, diabetes is often considered a permanent condition, it has been shown that recovery is possible, particularly in obese patients following bariatric surgery [28].
These figures illustrate that ICD9 codes, in aggregate, reveal significant information about the time course of conditions and could potentially be used to compare populations, inform other clinical systems, or generate knowledge about known conditions in a rapid and automated fashion.
VI. Limitations
This study included only the patient records at a single academic medical center limiting generalizability. The effectiveness of these methods in other academic institutions, as well as in nonacademic institutions, is yet to be evaluated. However, it is reasonable to think that the results would generalize to other longitudinal care facilities, particularly, other metropolitan tertiary care centers. Also, as previously mentioned, ICD9 coding practices are not unbiased.
ICD10, an updated classification system, will replace ICD9 in 2014, according to a new rule published by the Department of Health and Human Services [29]. We believe, however, that this transition should not affect the contributions of this paper for three reasons: 1) the same analysis could be applied to ICD10 codes; 2) this analysis could be performed on a combination of ICD9 and ICD10 codes, since there exists a mapping between ICD9 and ICD10 through the Unified Medical Language System [30]; and 3) documentation patterns for clinicians and hospital systems will not likely change in the aggregate as a result of the transition.
This study incorporates all of a patient’s encounters, including inpatient, emergency department, and outpatient visits, and including primary, as well as specialty care. It is possible that this mixing may introduce some bias; however, our aim in this study was to represent the longitudinal profile of an individual, as completely as possible.
It is difficult to characterize the relationships between the evolution of disease and the evolution of documentation. Here, we study the medical record as a natural object, but we hope that eventually the understanding of documentation will translate to an understanding of disease. In order to make this important step, the relationship between documentation and disease must be characterized.
Also, it is evident that our methods are unable to distinguish between certain patterns of disease occurrence. For example, our methods cannot distinguish acute exacerbations as a separate entity from underlying chronic conditions or recurring acute conditions from semichronic conditions.
VII. Conclusion
We have demonstrated two methods for characterizing the time course of disease. The first of the two methods places conditions on a scale of differential entropy. According to this measure, conditions seem to be distributed according to a bimodal distribution.
The second of the two methods provides a more fine-grained method for characterizing disease time course. This method aligns the time series for patients with a specific condition and estimates the probability of being documented for a condition given the time since the first documentation.
Overall, these results demonstrate that diagnosis codes have temporal validity despite being inaccurate in other ways.
Acknowledgments
This work was supported in part by the National Library of Medicine under Grants R01 LM006910 “Discovering and applying knowledge in clinical databases” and in part by the Grant T15 LM007079 “Training in Biomedical Informatics at Columbia University.”
Appendix
A. Details for Evaluating Differential Entropy as a Summary Statistic
A beta kernel density estimator (1) was used to estimate the distribution of proportions [31]
| (1) |
where Kα, β (x) is the estimated function, n is the number of points used to estimate the probability density function (pdf), b is the smoothing parameter where b goes to 0 as n goes to ∞ (see [31] for details), α and β are the parameters of the beta kernel, and Γ is the gamma function defined as follows:
| (2) |
The beta distribution was chosen because what is being estimated here is a distribution over proportions. Proportions are real valued and bounded. Therefore, the beta distribution was the appropriate exponential family distribution to model this data.
The differential entropies (3) of the estimated distributions were calculated (up to a constant) using an estimate defined by (4) where D is the number of bins. The number of bins used for these calculations is 1000
| (3) |
The reported differential entropy values are scaled by D
| (4) |
A feature of differential entropy of note is that unlike discrete entropy it can take negative values. A simple example demonstrating this is the differential entropy of the uniform distribution from 0 to (1/2)(−log(2)).
B. Details for Kernel Smoothing of Sparse Time Series
A Gaussian kernel was used to estimate the probability of documentation over time is given as
| (5) |
| (6) |
In our analysis σ = 20.
Contributor Information
Adler Perotte, Email: adler.perotte@dbmi.columbia.edu.
George Hripcsak, Email: hripcsak@columbia.edu.
References
- 1.Birman-Deych E, Waterman AD, Yan Y, Nilasena DS, Radford MJ, Gage BF. Accuracy of ICD-9-CM codes for identifying cardiovascular and stroke risk factors. Med Care. 2005;43(5):480–485. doi: 10.1097/01.mlr.0000160417.39497.a9. [DOI] [PubMed] [Google Scholar]
- 2.Farzandipour M, Sheikhtaheri A, Sadoughi F. Effective factors on accuracy of principal diagnosis coding based on international classification of diseases, the 10th revision. Int J Inf Manage. 2010;30:78–84. [Google Scholar]
- 3.The Computational Medicine Center’s. Medical Natural Language Processing Challenge. 2007 [Online]. Available: http://www.computationalmedicine.org/challenge/previous.
- 4.DiSalvo TG, Normand SL, Hauptman PJ, Guadagnoli E, Palmer RH, McNeil BJ. Pitfalls in assessing the quality of care for patients with cardiovascular disease. Amer J Med. 2001 Sep;111(4):297–303. doi: 10.1016/s0002-9343(01)00842-7. [DOI] [PubMed] [Google Scholar]
- 5.Aronsky D, Haug PJ, Lagor C, Dean NC. Accuracy of administrative data for identifying patients with pneumonia. Amer J Med Qual. 2005 Nov-Dec;20(6):319–328. doi: 10.1177/1062860605280358. [DOI] [PubMed] [Google Scholar]
- 6.Hsia DC, Krushat WM, Fagan AB, Tebbutt JA, Kusserow RP. Accuracy of diagnostic coding for Medicare patients under the prospective-payment system. N Engl J Med. 1988 Feb 11;318(6):352–355. doi: 10.1056/NEJM198802113180604. [DOI] [PubMed] [Google Scholar]
- 7.Hsia DC, Ahern CA, Ritchie BP, Moscoe LM, Krushat WM. Medicare reimbursement accuracy under the prospective payment system, 1985 to 1988. J Amer Med Assoc. 1992 Aug 19;268(7):896–899. [PubMed] [Google Scholar]
- 8.Iezzoni LI, Foley SM, Daley J, Hughes J, Fisher ES, Heeren T. Comorbidities, complications, and coding bias. Does the number of diagnosis codes matter in predicting in-hospital mortality? J Amer Med Assoc. 1992 Apr 22–29;267(16):2197–2203. doi: 10.1001/jama.267.16.2197. [DOI] [PubMed] [Google Scholar]
- 9.Goldstein LB. Accuracy of ICD-9-CM coding for the identification of patients with acute ischemic stroke: Effect of modifier codes. Stroke. 1998;29:1602–1604. doi: 10.1161/01.str.29.8.1602. [DOI] [PubMed] [Google Scholar]
- 10.Calle EE, Rodriguez C, Walker-Thurmond K, Thun MJ. Overweight, obesity, and mortality from cancer in a prospectively studied cohort of U.S. adults. N Engl J Med. 2003 Apr 24;348(17):1625–1638. doi: 10.1056/NEJMoa021423. [DOI] [PubMed] [Google Scholar]
- 11.Steinman MA, Landefeld CS, Gonzales R. Predictors of broad-spectrum antibiotic prescribing for acute respiratory tract infections in adult primary care. J Amer Med Assoc. 2003 Feb 12;289(6):719–725. doi: 10.1001/jama.289.6.719. [DOI] [PubMed] [Google Scholar]
- 12.Charbonneau A, Rosen AK, Ash AS, Owen RR, Kader B, Spiro A, 3rd, Hankin C, Herz LR, Jo M, Pugh V, Kazis L, Miller DR, Berlowitz DR. Measuring the quality of depression care in a large integrated health system. Med Care. 2003 May;41(5):669–680. doi: 10.1097/01.MLR.0000062920.51692.B4. [DOI] [PubMed] [Google Scholar]
- 13.Jackson LA, Neuzil KM, Yu O, Benson P, Barlow WE, Adams AL, Hanson CA, Mahoney LD, Shay DK, Thompson WW. Effectiveness of pneumococcal polysaccharide vaccine in older adults. N Engl J Med. 2003 May 1;348(18):1747–1755. doi: 10.1056/NEJMoa022678. [DOI] [PubMed] [Google Scholar]
- 14.Martin GS, Mannino DM, Eaton S, Moss M. The epidemiology of sepsis in the United States from 1979 through 2000. N Engl J Med. 2003 Apr 17;348(16):1546–1554. doi: 10.1056/NEJMoa022139. [DOI] [PubMed] [Google Scholar]
- 15.Studdert DM, Gresenz CR. Enrollee appeals of preservice coverage denials at 2 Health Maintenance Organizations. J Amer Med Assoc. 2003 Feb 19;289(7):864–870. doi: 10.1001/jama.289.7.864. [DOI] [PubMed] [Google Scholar]
- 16.Hripcsak G, Albers D, Perotte A. Using lagged linear correlation to find relationships between laboratory values and clinician concepts. presented at the Amer. Med. Inf. Assoc. Summit Translational Bioinform; San Francisco, CA, USA. 2011. [Google Scholar]
- 17.Hripcsak G, Albers D, Perotte A. Interpreting lagged linear correlation and using range to prioritize. presented at the Amer. Med. Inf. Assoc. Summit Translational Bioinform; San Francisco, CA, USA. 2012. [Google Scholar]
- 18.Hripcsak G, Albers D, Perotte A. Exploiting time in electronic health record correlations. J Amer Med Inf Assoc. 2011 Dec;18(suppl 1):i109–i115. doi: 10.1136/amiajnl-2011-000463. [DOI] [PMC free article] [PubMed] [Google Scholar]
- 19.Garg AX, Adhikari NK, McDonald H, Rosas-Arellano MP, Devereaux PJ, Beyene J, Sam J, Haynes RB. Effects of computerized clinical decision support systems on practitioner performance and patient outcomes: A systematic review. J Amer Med Assoc. 2005 Mar 9;293(10):1223–1238. doi: 10.1001/jama.293.10.1223. [DOI] [PubMed] [Google Scholar]
- 20.Blumenthal D. Stimulating the adoption of health information technology. W V Med J. 2009 May-Jun;105(3):28–29. [PubMed] [Google Scholar]
- 21.Kuperman GJ, Bobb A, Payne TH, Avery AJ, Gandhi TK, Burns G, Classen DC, Bates DW. Medication-related clinical decision support in computerized provider order entry systems: A review. J Amer Med Inf Assoc. 2007 Jan-Feb;14(1):29–40. doi: 10.1197/jamia.M2170. [DOI] [PMC free article] [PubMed] [Google Scholar]
- 22.Hripcsak G, Elhadad N, Chen YH, Zhou L, Morrison FP. Using empiric semantic correlation to interpret temporal assertions in clinical texts. J Amer Med Inf Assoc. 2009 Mar-Apr;16(2):220–227. doi: 10.1197/jamia.M3007. [DOI] [PMC free article] [PubMed] [Google Scholar]
- 23.Bishop C. Pattern Recognition and Machine Learning. New York, NY, USA: Springer Science+Business Media; 2006. [Google Scholar]
- 24.Hamadicharef B. Frequentist versus Bayesian approaches for AUC confidence interval bounds. Proc. 10th Int. Conf. Inf. Sci., Signal Process. Appl; Kuala Lumpur, Malaysia. 2010. pp. 341–344. [Google Scholar]
- 25.Palit TK, Miller CC, III, Miltenburg DM. The efficacy of thyroidectomy for Graves’ disease: A meta-analysis. J Surg Res. 2000 May 15;90(2):161–155. doi: 10.1006/jsre.2000.5875. [DOI] [PubMed] [Google Scholar]
- 26.Weyer C, Bogardus C, Mott DM, Pratley RE. The natural history of insulin secretory dysfunction and insulin resistance in the pathogenesis of type 2 diabetes mellitus. J Clin Invest. 1999 Sep;104(6):787–794. doi: 10.1172/JCI7231. [DOI] [PMC free article] [PubMed] [Google Scholar]
- 27.Kannel WB, Sorlie P, McNamara PM. Prognosis after initial myocardial infarction: The Framingham study. Amer J Cardiol. 1979 Jul;44(1):53–59. doi: 10.1016/0002-9149(79)90250-9. [DOI] [PubMed] [Google Scholar]
- 28.Sjöström L, Lindroos AK, Peltonen M, Torgerson J, Bouchard C, Carlsson B, Dahlgren S, Larsson B, Narbro K, Sjöström CD, Sullivan M, Wedel H. Lifestyle, diabetes, and cardiovascular risk factors 10 years after bariatric surgery. N Engl J Med. 2004 Dec 23;351(26):2683–2693. doi: 10.1056/NEJMoa035622. [DOI] [PubMed] [Google Scholar]
- 29.Office of the Secretary, HHS. Administrative simplification: Adoption of a standard for a unique health plan identifier; addition to the National Provider Identifier requirements; and a change to the compliance date for the International Classification of Diseases, 10th Edition (ICD-10-CM and ICD-10-PCS) medical data code sets. Final rule. Fed Regist. 2012 Sep 5;77(172):54663–54720. [PubMed] [Google Scholar]
- 30.Lindberg DA, Humphreys BL, McCray AT. The unified medical language system. Methods Inf Med. 1993 Aug;32(4):281–291. doi: 10.1055/s-0038-1634945. [DOI] [PMC free article] [PubMed] [Google Scholar]
- 31.Chen SX. Beta kernel estimators for density functions. Comput Statist Data Anal. 1999;31(2):131–145. [Google Scholar]


