

Abstract
Background/Aims
Type 2 resistant starch from high-amylose maize (HAM-RS2) is associated with increased fermentation, increased expression of proglucagon (gene for GLP-1) and peptide YY (PYY) genes in the large intestine, and improved health. To determine what other genes are up- or down-regulated with feeding of HAM-RS2 a microarray was performed.
Methods
Adult, male SD rats were fed one of the following three diets for a four week study period: cornstarch control (CC, 3.74 kcal/g), dietary energy density control (EC, 3.27kcal/g), and 30% HAM-RS2 (RS, 3.27 kcal/g). Rat microarray with ∼27,000 genes and validation of 94 representative genes with multiple qPCR were used to determine gene expression in total RNA extracts of cecal cells from rats. The RS vs. EC comparison tested effects of fermentation as energy density of the diet was controlled.
Results
For the RS vs. EC comparison, 86% of the genes were validated from the microarray and the expression indicates promotion of cell growth, proliferation, differentiation, and apoptosis. Gut hormones GLP-1 and PYY were increased.
Conclusions
Gene expression results predict improved structure and function of the GI tract and production of gut hormones may promote healthy functions beyond the GI tract.
Keywords: high-amylose maize, resistant starch, microarray, validation, cecal cells, GI tract
Introduction
Although the mechanism remains unclear, dietary resistant starches have been shown to decrease plasma cholesterol and triglycerides, increase insulin sensitivity, decrease fat storage, and produce anticancer effects in humans [1-13]. The current research is to gather gene expression data that will help identify mechanisms by which resistant starch improves health. Resistant starches (RS) are one type of non-digestible, fermentable fiber. Generally, RS is categorized into 4 categories [14]: RS1 is a result of the structured food matrix in unprocessed whole grains, seeds or legumes; RS2 is generally high amylose, but is primarily the result of an organized granular structure tightly packed in a radial pattern as in high amylose cornstarch products; RS3 is retrograded starch as in cooked then cooled potatoes, and RS4 is considered chemically modified starch with either constituent groups attached or linkages between starch molecules. RS potentially will have three major effects when included in the diet: 1) dilution of dietary energy as the metabolizable energy of one type of RS2, HAM-RS2, is 2.8 kcal/g compared to the 3.6 to 4 kcal/g of typical starches [10], 2) a bulking effect similar to non-fermentable fiber, and 3) fermentation to short chain fatty acids and an increase in expression of genes in the gut and peptide hormones in plasma [5, 8, 9, 11, 12].
RS is fermented to short chain fatty acids by microflora in the large intestine [5, 8]. The colonic fermentation of one specific form of RS from high-amylose maize, HAM-RS2, has been shown to elicit several beneficial changes such as increased cecal and large intestine gene expression of peptide YY (PYY) and proglucagon (gene for GLP-1), increased plasma levels of PYY and glucagon-like peptide-1 (GLP-1) and decreased abdominal fat [5, 8, 9]. Thus, it is important to understand the full scale of gene expression changes by HAM-RS2 in the cecum, where the fermentation occurs. However, our previous studies have been limited to a handful of genes using real time reverse transcriptase polymerase chain reaction (qPCR) and peptide hormone assays. The current study is a microarray with ∼27,000 genes of the rat genome followed by a validation or focusing of the microarray that was performed on 94 genes. We compared gene expression profiles in cecal cells of rats fed a HAM-RS2 diet with that of rats fed two types of control diets. One, a standard AIN-93G diet with added cornstarch (CC = control cornstarch) that is greater in metabolizable energy than the RS diet [15]. The second with equal metabolizable energy density due to the addition of cellulose (EC = energy density control). The inclusion of the EC diet allowed for testing of fermentation separate from energy density differences.
Methods
Animals and Diets
Forty-five eight week old male Sprague Dawley (Harlan, Indianapolis, IN) rats (n=15/treatment; three separate orders from Harlan Co., n=5/treatment) were fed treatment diets for 4 weeks: a rapidly-digestible cornstarch control (CC, 3.74 kcal/g), an energy control with a rapidly-digestible cornstarch and purified, non-fermentable cellulose added to dilute metabolizable energy (EC, 3.27 kcal/g), and the resistant starch treatment (RS, 3.27 kcal/g) using a fermentable, high amylose cornstarch resistant starch category 2, HAM-RS2 (Table 1). Note that the staggering of orders equalized for the three treatments was to control for condition of rats at one order time vs. another time. The EC and RS diets have equal energy density. Energy content of the starches was calculated based on an approximate metabolizable energy content of 2.8 kcal/g for the high-amylose cornstarch [10, 16] and using the Atwater factor of 4.0 kcal/g for the rapidly-digestible cornstarch (4.0 kcal/g). A modified version of the Englyst method [17] was used to derive an estimate of 56% resistant starch for the HAM-RS2. Thus, the HAM-RS2 diet had 530.7 g of Hi-maize® starch and 297 g of resistant starch, or 29.7% of the weight of the diet (Table 1).
Table 1.
Composition of the rat diets.
| Ingredient (g) | CC | EC | RS |
|---|---|---|---|
| Casein | 200 | 200 | 200 |
| Sucrose | 100 | 100 | 100 |
| Cornstarch1 | 530.69 | 403.69 | 0 |
| Resistant Cornstarch2 | 0 | 0 | 530.69 |
| Cellulose | 50 | 177 | 50 |
| Soybean oil | 70 | 70 | 70 |
| Mineral Mix (AIN-93M) | 35 | 35 | 35 |
| Vitamin Mix (AIN-93) | 10 | 10 | 10 |
| Choline Chloride | 1.3 | 1.3 | 1.3 |
| L-Cystine | 3 | 3 | 3 |
| BHT | 0.014 | 0.014 | 0.014 |
| Total grams | 1000 | 1000 | 1000 |
| Energy density3 | 3.74 kcal/g | 3.27 kcal/g | 3.27 kcal/g |
100% amylopectin cornstarch (Amioca®, National Starch LLC, Bridgewater, NJ).
High-amylose maize cornstarch (Hi-maize®260, National Starch LLC, Bridgewater, NJ). This product has RS2 and is described in the methods section of the text.
Rats were killed by heart puncture and plasma was collected for analysis of peptide YY and glucagon-like peptide-1 by RIA (Phoenix, Burlingame, CA) and ELISA (Millipore, Billerica, MA), respectively. The full ceca were excised and weighed, and an aliquot of cecal contents was removed for measurement of pH. In addition, three abdominal fat pads, retroperitoneal, perirenal and epididymal, were also removed and weighed. After cecal contents were removed, the cecum was carefully opened with scissors and the inner surface of the cecum was rinsed with sterilized saline three times. Cecal cell samples used for RNA extraction were collected by gently scraping the inner cecal surface. This layer of cells includes epithelial (colonocytes) cells, nerve cells, endocrine cells and immune cells, which represent all cell types that would be exposed to short chain fatty acids, the fermentation products of RS in the cecum. Previously Chen et al. [18] used a similar approach for collecting cells of the proximal colon for a gene array with dietary fibers.
RNA and cDNA
RNA was isolated from cecum cell scrapings using the Qiagen (Valencia, CA) RNeasy mini kit with an additional on column DNase digestion. RNA samples were eluted with RNase free water. RNA concentrations and integrities were determined using an Agilent Bioanalyzer (Foster City, CA). Only RNA samples with a concentration over 2.3 ng/ul and an RNA integrity number greater than 8.0 were used. The best total RNA samples from each time period (see animal section above) were used (maximum of three except for one time period with n=4 for RS). Thus, the total n for the three groups was: RS, n=10; and CC and EC, n=9. The Applied Biosystems (Carlsbad, CA) Chemiluminescent RT Labeling Kit was used to produce digoxygenin (DIG)-labeled cDNA for hybridization to the microarray.
Microarray Procedure
We used the Applied Biosystems rat genomic chips (∼27,000 genes). From each sample, 10 ug of labeled cDNA was hybridized to a microarray and processed for scanning using the Applied Biosystems Chemiluminescent Detection Kit. Microarrays were scanned by an Applied Biosystems 1700. ABarray software (Bioconductor.org) was used to quantile normalize the signal across all arrays. It filtered the data to retain genes having a signal to noise ratio ≥3. The data were also filtered to remove data derived from array spots which were flagged as defective by AB1700 software. Fold-change, log2 fold-change, p-value, Benjamini Hochberg adjusted p-value, and fold-change bin were provided for each detected gene or transcript. Three gene lists from ABarray pairwise comparisons CC-EC, CC-RS, and EC-RS were generated. The Protein Analysis through Evolutionary Relationships (PANTHER, www.pantherdb.org) software was used to determine if significantly affected genes were known to be assigned to a biochemical pathway or were unclassified at the present time. Analysis was performed with and without Bonferoni adjustment to determine statistical significance of pathway gene hits. In addition, the software was used to determine if molecular functions of the unclassified genes were known. Additionally, Spotfire® software was used for hierarchical clustering.
Validation Procedure
We used Applied Biosystems 384 well TaqMan® Custom Arrays for qPCR to focus on and confirm 94 genes from the microarray results. The 96a format was chosen which includes one mandatory control, 18SrRNA, and allows four samples per 384 well array. Another control, cyclophilin F, was also included. The total n for the three groups was: RS and EC, n=8; and CC, n=7 and each of these biological samples were run in triplicate. The RS vs. EC comparison was considered the most important of the three comparisons as it represents the effect of resistant starch beyond simple energy dilution of the diet. Narrowing our list to 94 genes was accomplished by choosing genes with the greatest fold changes and with the lowest p values. Only genes that were inventoried by Applied Biosystems could be included in the custom arrays. Additionally, neurotensin, a peptide hormone with a high fold change and very low p value, was run separately from the custom arrays. The 18S rRNA gene was used as the reference gene in analyses as it was more consistently expressed than cyclophilin F from sample to sample and between experimental groups. The custom array data were normalized using 18S followed by fold-change calculation using the ΔΔCT method (2-∆∆Ct) [19]. These values were submitted to ABqPCR software to determine p values using t-tests for comparisons of CC-EC, CC-RS, and EC-RS. The average values for each gene in each group were used to determine fold changes (FC).
Results
Microarray
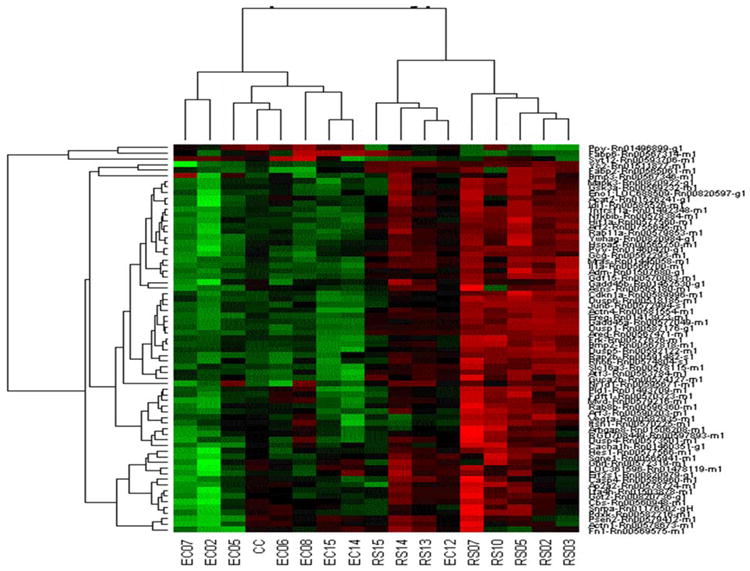
Over 10,000 genes were considered “present” (the signal to noise ratio was ≥3) for all three comparisons. The RS vs. CC comparison had the greatest number of differences in mRNA expression for genes out of the possible ∼27,000 genes measured on the microarrays. The greater number of differentially expressed genes for RS vs. CC appears logical as this comparison represents the greatest dietary differences that include dilution of dietary energy density and fermentation with the addition of HAM-RS2 to the diet. A summary of the microarray results is shown in table 2. Strong global differences among the three groups are depicted in a hierarchical cluster using Z scores from signal intensities of genes that had significantly different FC at p<0.01 (Figure 1).
Table 2.
Microarray results.
| Results | CC vs. EC | CC vs. RS | RS vs. EC |
|---|---|---|---|
| “Present” Gene expression (S/N≥3) | 10,023 | 10,573 | 10,388 |
| Gene differences p<0.05 | 629 | 3,192 | 2,640 |
| Gene differences p<0.01 | 158 | 1,769 | 1,301 |
| PANTHER Gene Pathways p<0.051 | 18 | 23 | 17 |
| Unclassified Genes p<0.052 | 515 | 2,711 | 2,266 |
PANTHER was the gene ontology software program used to estimate the number of gene mRNAs in pathways or unclassified.
Figure 1.
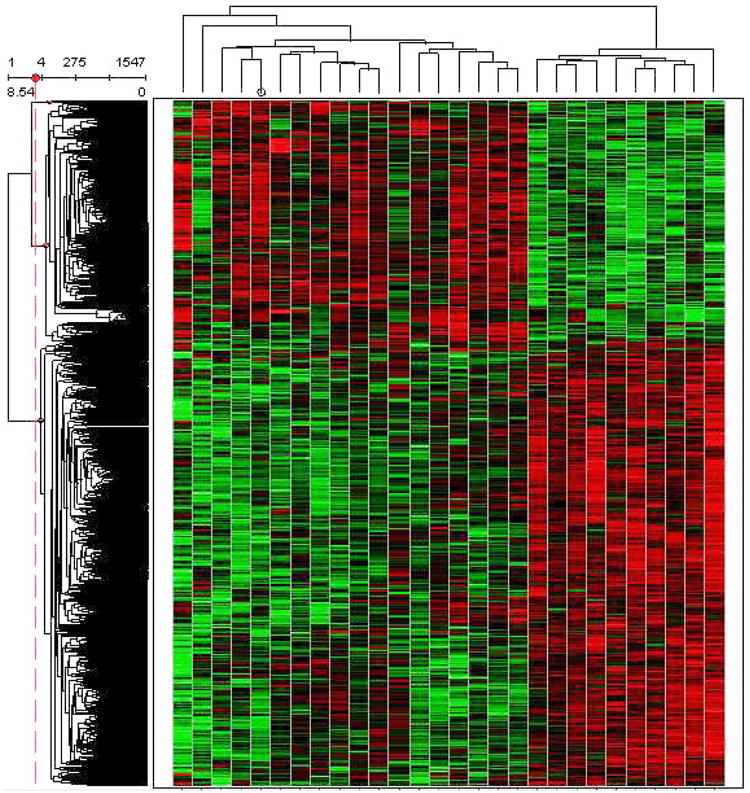
A hierarchical cluster of the Z scores of the microarray signals for RS, CC and EC groups for genes that were significantly different at p<0.01. This visualization shows data in a dendrogram (a tree graph) based on the similarity between treatment replicates. The Z-scores were determined by calculating the three groups combined mean for each gene, and then individual differences of treatment replicates from the mean were divided by the standard deviation. This is one type of normalization for making gene-gene comparisons. Different genes are shown in each separate row. The columns are individual replicates of treatments and from left to right they are: EC3, CC3, CC14, CC2, CC8, CC12, CC4, CC15, EC15, EC13, EC12, EC6, CC7, EC5, EC2, CC6, EC9, EC7, RS3, RS9, RS15, RS8, RS13, RS4, RS12, RS14, RS7, RS5.
Validation
The genes chosen from the microarray for validation have their microarray results listed in tables 3, 4 and 5 with names, abbreviations, fold changes, p values, category of function (pathway or unclassified), and NCBI Gene ID number. Panther gene expression analysis without the Bonferoni adjustment for the RS vs. EC comparison, demonstrated that our microarray gene list contained genes significantly over-represented in 44 pathways. One gene did not amplify in the TaqMan® custom arrays so we report on 93 genes from the custom arrays (Figures 2-4). For the RS vs. EC comparison, there was validation of 86% of the genes as 80 out of 93 genes that had a significant difference in fold change with the microarray showed a significant difference with the custom arrays. Chosen from the microarray were 74 genes with a FC>1 and low p values. Seventy-two of these genes were significant with the custom arrays. Of the 19 genes with a FC<1 and low p values with the microarray, eight were significant using qPCR. Two genes changed from a significant FC<1 to significant with a FC>1. In Figure 5, RS vs. EC is compared to RS vs. EC for similarities and differences in numbers of genes that were either up-regulated, not different, or down regulated grouped according to four broad categories of function. A hierarchical cluster for the RS vs. EC comparison is shown in figure 6. Neurotensin was analyzed separately by individual qPCR. From the microarray and PANTHER results, the FC for RS vs. EC for neurotensin was 8, the p value<0.0001, and the pathway assignment was unclassified. The individual qPCR results for neurotensin for RS vs. EC, RS vs. CC and CC vs. EC were: FC = 4.59, p<0.0001; FC = 4.17, p<0.0001; FC = 1.1, NS; respectively. Thus, the microarray results were largely confirmed.
Table 3.
List of genes from microarray with RS vs. EC results and used in validation1,2 (alphabetical by abbreviation).
| Name | Abbrev | NCBI Gene ID | Fold Change | p Value | Function (Pathway or Unclassified) |
|---|---|---|---|---|---|
| Acetyl-coenzyme A acyltransferase 3 | Acat 3 | 308100 | 1.61 | 0.000 | Unclassified |
| Actinin alpha 1 | Actn1 | 81634 | 1.98 | 0.000 | Integrin |
| Actinin alpha 4 | Actn4 | 63836 | 1.97 | 0.000 | Integrin |
| Adrenomedullin | Adm | 25026 | 5.32 | 0.000 | Unclassified |
| Aldehyde oxidase 3 | Aox3 | 493909 | 0.56 | 0.004 | Adenine and hypoxanthine salvage |
| Adaptor protein complex AP-2 | Ap2a2 | 81637 | 1.51 | 0.004 | Huntington Disease |
| Amphiregulin | Areg | 29183 | 25.64 | 0.000 | EGF receptor signaling |
| ADP-ribosylation factor 2 | Arf2 | 79119 | 1.51 | 0.006 | Huntington Disease + Integrin |
| ADP-ribosylation factor 3 | Arf3 | 140940 | 1.78 | 0.002 | Huntington Disease + Integrin |
| Rho GTPase activating protein 27 | Arhgap27 | 303583 | 1.45 | 0.002 | PDGF signaling |
| Rho GTPase activating protein 8 | Arhgap8 | 300115 | 2.15 | 0.002 | Angiogenesis + PDGF signaling + VEGF signaling + Cytoskeleton regulation by RhoGTPase |
| Asparagine synthetase | Asns | 25612 | 2.73 | 0.000 | Asparagine and aspartate biosynthesis |
| Activating transcription factor 3 | Atf3 | 25389 | 3.26 | 0.000 | Apoptosis |
| Beta-site APP-cleaving enzyme 2 | Bace2 | 288227 | 0.5 | 0.004 | Alzheimer disease-amyloid secretase |
| Bone morphogenetic protein 2 | Bmp2 | 29373 | 1.31 | 0.009 | TGF beta signaling |
| Bone morphogenetic protein 3 | Bmp3 | 25667 | 2.48 | 0.030 | Unclassified |
| Calcium channel, voltage-dependent, T type, alpha 1H subunit | Cacna1h | 114862 | 3.12 | 0.005 | Unclassified |
| Caspase 4 | Casp4 | 114555 | 1.59 | 0.000 | Unclassified |
| Cystathionine beta synthase | Cbs | 24250 | 1.52 | 0.008 | Cysteine biosynthesis |
| CD14 antigen | Cd14 | 60350 | 0.56 | 0.005 | Toll-like receptor |
| Cyclin-dependent kinase | Cdk2 | 362817 | 1.59 | 0.006 | p53 + p53 feedback loops 2 |
| Cyclin-dependent kinase inhibitor 1A | Cdkn1a | 114851 | 2.18 | 0.000 | Interleukin + p53 feedback loops 2 + p53 |
| Chromogranin A | Chga | 24258 | 0.52 | 0.000 | Unclassified |
| Chromogranin B | Chgb | 24259 | 0.54 | 0.000 | Unclassified |
| Collagen, type 5, alpha 3 | Col5a3 | 60379 | 2.72 | 0.003 | Integrin |
| Dual specificity phosphatase 1 | Dusp1 | 114856 | 5.99 | 0.000 | Unclassified |
| Dual specificity phosphatase 4 | Dusp4 | 60587 | 2.96 | 0.000 | Oxidative stress response |
| Dual specificity phosphatase 5 | Dusp5 | 171109 | 1.65 | 0.001 | Oxidative stress response |
| Dual specificity phosphatase 6 | Dusp6 | 116663 | 1.68 | 0.001 | Oxidative stress response |
| Eukaryotic translation initiation factor 2, subunit 1 | Eif2s1 | 54318 | 1.42 | 0.004 | Apoptosis |
| Enolase 1, alpha | Eno1 | 24333 | 1.59 | 0.000 | Glycolysis |
| Epiregulin | Ereg | 59325 | 7.81 | 0.000 | EGF receptor signaling |
| Fatty acid binding protein 2 | Fabp2 | 25598 | 4.55 | 0.000 | Unclassified |
| fatty acid binding protein 6, ileal (gastrotropin) | Fabp6 | 25440 | 0.12 | 0.012 | Unclassified |
| farnesyl diphosphate farnesyl transferase 1 | Fdft1 | 29580 | 1.55 | 0.008 | Cholesterol biosynthesis |
| fibroblast growth factor receptor 2 | Fgfr2 | 25022 | 0.56 | 0.000 | Angiogenesis |
| fibronectin 1 | Fn1 | 25661 | 2.28 | 0.027 | Integrin |
| fyn-related kinase | Frk | 79209 | 1.57 | 0.000 | B-cell activation + Integrin + Axon guidance |
| growth arrest and DNA-damage-inducible 45 alpha | Gadd45a | 25112 | 2.70 | 0.000 | p53 +PI3kinase |
| growth arrest and DNA-damage-inducible 45 beta | Gadd45b | 299626 | 2.12 | 0.014 | p53 |
| growth arrest specific 6 | Gas6 | 58935 | 0.58 | 0.005 | Unclassified |
| glucagon | Gcg | 24952 | 6.9 | 0.001 | Unclassified |
| growth differentiation factor 15 | Gdf15 | 29455 | 2.97 | 0.007 | Unclassified |
| ghrelin precursor | Ghrl | 59301 | 0.66 | 0.014 | Unclassified |
| glutamate oxaloacetate transaminase 2 | Got2 | 25721 | 1.56 | 0.001 | Asparagine and aspartate biosynthesis |
| glycogen synthase kinase 3 alpha | Gsk3a | 50686 | 1.89 | 0.001 | Insulin IGF PKB +Angiogenesis + Interleukin + PI3Kinase + Hedgehog signaling |
| glutathione S-transferase Yc2 subunit | Gsta5 | 494500 | 10.6 | 0.000 | Unclassified |
| guanylate cyclase activator 2b | Guca2b | 64055 | 1.51 | 0.008 | Unclassified |
| hemopoietic cell kinase | Hck | 25734 | 0.58 | 0.001 | Parkinson disease + Angiogenesis = Integrin + Interleukin |
| hairy and enhancer of split 1 (Drosophila) | Hes1 | 29577 | 1.44 | 0.003 | Notch signaling |
| hypoxia inducible factor 1, alpha subunit | Hif1a | 29560 | 1.59 | 0.000 | Angiogenesis |
| heat shock 70kDa protein 5 (glucose-regulated protein) | Hspa5 | 25617 | 1.63 | 0.000 | Parkinson disease |
| Isocitrate dehydrogenase 2 (NADP+) | Idh2 | 361596 | 1.52 | 0.003 | Tricarboxylic acid |
| isopentenyl-diphosphate delta isomerase | Idi1 | 89784 | 2.23 | 0.000 | Cholesterol biosynthesis |
| interleukin 15 | Il15 | 25670 | 0.69 | 0.006 | Interleukin |
| interleukin 1 alpha | Il1a | 24493 | 5.03 | 0.000 | Interleukin |
| intersectin 1 | Itsn1 | 29491 | 2.06 | 0.008 | Unclassified |
| Jun-B oncogene | Junb | 24517 | 2.38 | 0.000 | TGF Beta |
| leukotriene A4 hydrolase | Lta4h | 299732 | 1.5 | 0.000 | Unclassified |
| leukotriene C4 synthase | Ltc4s | 114097 | 0.57 | 0.000 | Inflammation-mediated chemokine & cytokine |
| mitogen activated protein kinase 3 | Mapk3 | 50689 | 1.51 | 0.005 | Inflammation-mediated chemokine & cytokine + B-cell activation +Parkinson disease +Apoptosis + Integrin + Leukotriene |
| muscle and microspikes RAS | Mras | 25482 | 3.72 | 0.000 | Integrin |
| mevalonate (diphospho) decarboxylase | Mvd | 81726 | 2.21 | 0.004 | Cholesterol biosynthesis |
| nuclear factor of kappa light chain gene enhancer in B-cells inhibitor, beta | Nfkbib | 81525 | 1.41 | 0.001 | Apoptosis + Toll-like receptor |
| nuclear receptor subfamily 1, group D, member 1 | Nr1d1 | 252917 | 2.58 | 0.04 | Circadian clock system |
| platelet derived growth factor, alpha | Pdgfa | 25266 | 2.10 | 0.000 | Unclassified |
| pyridoxal (pyridoxine, vitamin B6) kinase | Pdxk | 83578 | 2.97 | 0.004 | Pyridoxal phosphate salvage |
| phospholipase C, gamma 2 | Plcg2 | 29337 | 0.59 | 0.000 | Inflammation-mediated chemokine & cytokine + B-cell activation + Angiogenesis + PDGF signaling + VEGF signaling |
| phospholipase D1 | Pld1 | 25096 | 1.50 | 0.003 | Angiogenesis + Ras |
| pleckstrin homology domain containing, family G (with RhoGef domain) member 5 | Plekhg5 | 310999 | 0.52 | 0.004 | Cytoskeleton + Axon guidance |
| pancreatic polypeptide | Ppy | 24677 | 0.43 | 0.01 | Unclassified |
| presenilin 2 | Psen2 | 81751 | 2.07 | 0.03 | Notch signaling + Alzheimer disease |
| proteaseome (prosome, macropain) 28 subunit, 3 | Psme3 | 287716 | 1.54 | 0.000 | Cell cycle |
| peptide YY (mapped) | Pyy | 287730 | 1.62 | 0.001 | Unclassified |
| RAB11a, member RAS oncogene family | Rab11a | 81830 | 1.55 | 0.000 | Huntington disease |
| RAB8B, member RAS oncogene family | Rab8b | 266688 | 1.42 | 0.000 | TGF beta signaling |
| RAP2B, member of RAS oncogene family | Rap2b | 170923 | 2.16 | 0.000 | Integrin |
| resistin-like gamma | Retnlg | 288135 | 3.6 | 0.006 | Unclassified |
| ras homolog gene family, member B | Rhob | 64373 | 1.56 | 0.002 | Inflammation-mediated chemokine & cytokine + Angiogenesis + Integrin + Axon guidance + Ras + Cytoskeleton regulation by RhoGTPase |
| ribosomal protein S6 kinase, polypeptide 2 | Rps6kb2 | 361696 | 1.44 | 0.001 | PDGF signaling + PI3Kinase |
| scavenger receptor class B, member 1; | Scarb1 | 25073 | 2.52 | 0.004 | Unclassified |
| Secretogranin V | Scg5 | 25719 | 1.55 | 0.001 | Unclassified |
| monocarboxylate transporter | Slc16a3 | 80878 | 2.36 | 0.000 | Unclassified |
| SMAD family member 6 | Smad6 | 367100 | 0.67 | 0.000 | TGF beta signaling |
| MAD homolog 7 (Drosophila) | Smad7 | 81516 | 0.66 | 0.001 | TGF beta signaling |
| smoothened homolog (Drosophila) | Smo | 25273 | 2.69 | 0.005 | Hedgehog signaling |
| small nuclear ribonucleoprotein polypeptide A | Snrpa | 292729 | 1.83 | 0.006 | mRNA splicing |
| synaptotagmin 12 | Syt12 | 191595 | 0.31 | 0.003 | Unclassified |
| toll-like receptor 3 | Tlr3 | 364594 | 0.74 | 0.007 | Toll-like receptor |
| tumor necrosis factor receptor superfamily, member 1a | Tnfrsf1a | 25625 | 1.64 | 0.000 | Apoptosis |
| TOX high mobility group box family member 4 | Tox4 | 286990 | 1.93 | 0.006 | Nucleoside, nucleotide and nucleic acid metabolism |
| vascular endothelial growth factor A | Vegfa | 83785 | 2.82 | 0.000 | Angiogenesis + VEGF signaling |
| tyrosine 3-monooxygenase/tryptophan 5-monooxygenase activation protein, gamma polypeptide | Ywhag | 56010 | 1.85 | 0.000 | FGF signaling + PI3Kinase |
One gene did not amplify on the 96 well LDA panel,platforms and, therefore, only 93 of 94 test genes are reported in tables 3 through 5. The gene was Cga (Gene ID 116700), glycoprotein hormones, alpha subunit, with FC 0.390 and p value 0.02. Two genes were used as controls and not listed in the tables.
All genes in table are currently (July 2011) recognized as genes at the NCBI website.
Figure 2.
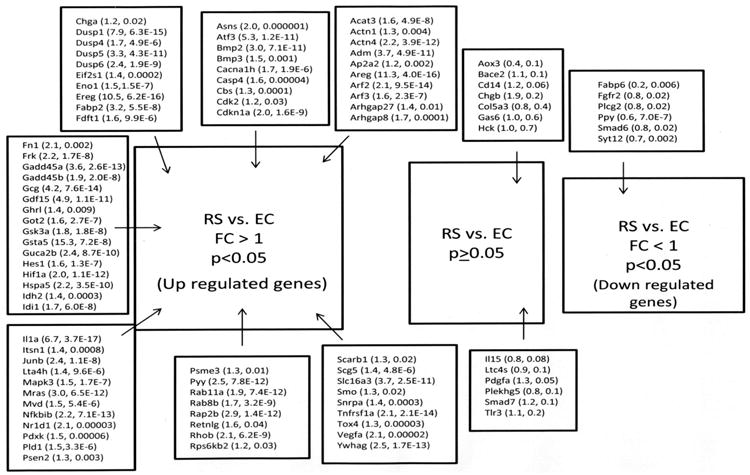
Results of validation for the RS vs. EC comparison. Genes are identified by their abbreviation. In parentheses are the (fold change, p value). Names of genes and their abbreviations are listed in tables 3 through 5.
Figure 4.
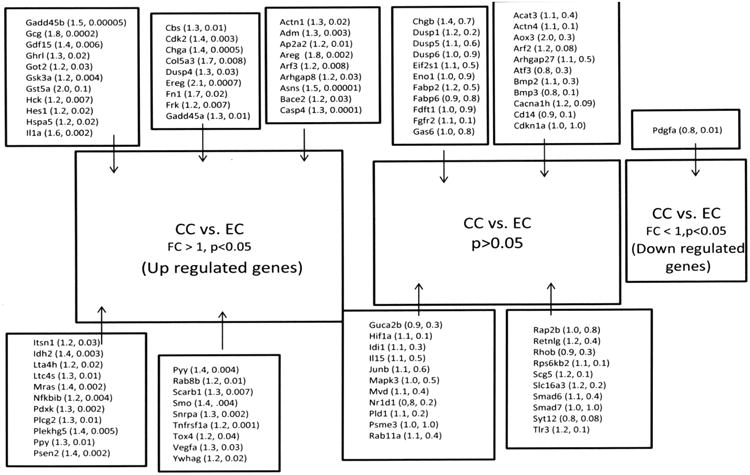
Results of validation for the CC vs. EC comparison. Genes are identified by their abbreviation. In parentheses are the (fold change, p value). Names of genes and their abbreviations are listed in tables 3 through 5.
Figure 5.
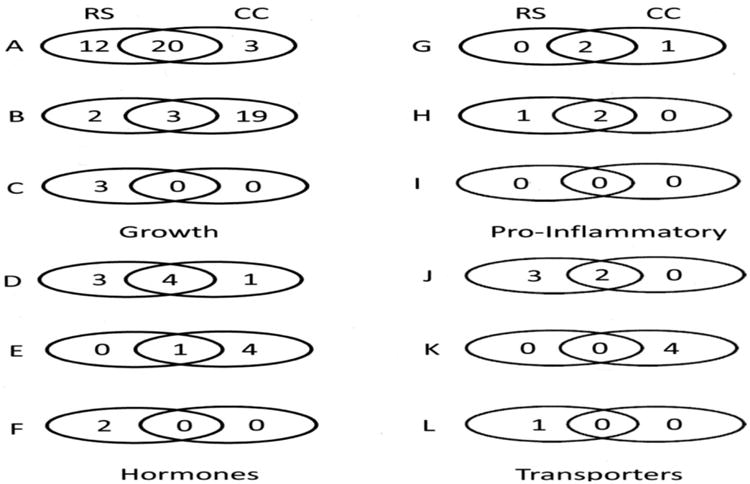
Venn diagrams comparing RS and CC gene expression grouped according to four broad categories of function. The figure compares RS vs. EC with RS vs. EC for similarities and differences in numbers of genes that were either up-regulated (A, D, G, J), not different (B, E, H, K), or down- regulated (C, F, I, L). The four broad categories are 1. growth and differentiation, regulators of cell cycle, and angiogenesis; 2. Hormones and secretory proteins; 3. pro-inflammatory; and 4. Transporters.
Figure 6.
A hierarchical cluster of the Z scores of the antilogs of the 2-ΔΔCT of RS vs. EC from the TaqMan Custom Array panel results from the validation. The Z-scores were determined by calculating the three groups combined mean for each gene, and then individual differences of treatment replicates from the mean were divided by the standard deviation. This is one type of normalization for making gene-gene comparisons. Different genes are shown in each separate row. The columns are individual replicates of treatments and from left to right they are: EC7, EC12, EC5, mean of CC group, EC6, EC8, EC15, EC14, RS15, RS14, RS13, EC12, RS7, RS10, RS5, RS2, RS3.
Other Results
At the end of this four-week study period, the RS and EC groups had reduced abdominal fat pads and body weights compared to the CC group, but RS and EC were not statistically different (data not shown). This is in contrast to our previous observations where rats fed HAMS-RS2 for 12 weeks had a significantly lower abdominal fat than the rats fed the EC diet [5, 9, 13]. Thus, HAM-RS2 needs to be consumed for more than four weeks to elicit effects on adiposity when rodents are consuming an equal energy density diet and the difference between diets is the presence of higher levels of fermentable carbohydrate. The greater body weights and abdominal fat for CC rats were likely the result of their greater energy intake for CC compared to RS and EC (data not shown). Food intake (grams) was similar among groups, but the higher energy density of the CC diet resulted in greater energy intake. The RS groups had significantly greater (p<0.0001) full cecal weights than the CC and EC groups (RS, 16.7; CC, 2.6; EC 3.2±0.9 g pooled error), while the CC and EC groups were not different. Cecal contents pH was much lower (p<0.0001) for RS than CC and EC (RS, 5.97; CC 8.14; EC, 8.49±0.05 pooled error), and CC cecal contents pH was also significantly lower (p<0.0001) than EC. Plasma total PYY (Figure 6a) and GLP-1 (Figure 6b) were increased for RS compared to CC and EC. The main goal of this microarray study was to examine the changes of gene expression profile in cecal cells with enhanced gut fermentation caused by dietary HAM-RS2. These results demonstrate that the fermentation of HAM-RS2 is established at the end of four week period.
Discussion
The aim of the current study was to use microarray technology to analyze expression of many genes in a single experiment quickly and efficiently to understand the fundamental aspects of mechanisms related to colonic fermentation of HAM-RS2 diets that may improve health. Adding HAM-RS2 to a diet by replacing other starches would lower the energy density of the diet, which is an important contributor for causing change in the gene expression profile in the gut. We used an additional control group (EC group) to control for this confounding factor. Adding HAM-RS2 to a diet also increases the amount of fermentation in the large intestine, particularly the cecum. Fermentation of HAM-RS2 in the cecum was previously shown to be associated with increased expression of cecal genes for PYY and proglucagon [5, 11], increased plasma levels of PYY and GLP-1 [5, 9, 12], reduced abdominal fat [5, 8, 9, 13], and increased proopiomelanocortin (POMC) in the arcuate nucleus of the hypothalamus [9]. Thus, in the current study, we used three treatment groups to assess the effects of simple energy dilution (CC vs. EC), fermentation with similar energy density of diets (RS vs. EC) or both energy density dilution and fermentation (RS vs. CC) on global gene expression of cells from the cecum of rats.
Fermentation of HAM-RS2 leads to an increase in short chain fatty acids in the lumen of the cecum, which affects all cells on the cecal inner surface. Our cecal cell collection method, also similar in a recent study [18], allowed us to examine a broad view of gene expression affected by HAM-RS2 fermentation. In a previous study, fermentation was evident through measuring short chain fatty acids in cecal contents after 1 week of feeding of HAM-RS2 [5]. After four weeks in the current study, HAM-RS2 fed rats had increased full cecal weights, decreased cecal contents pH, and increased plasma levels of PYY and GLP-1. All of these are well known indicators of fermentation. Thus, the four week study period allowed us to focus on changes in gene expression profile in cecal cells that resulted from fermentation of HAM-RS2. Beginning the study with 8 week old rats meant that the rats may be considered not quite adults. However, many of our studies use about this age as a starting age. This may mean that some of the results in our studies may be due to adolescent growth.
The results from the microarray indicated that about 38% of the genes of the rat genome (10,000+/∼27,000) were expressed above an acceptable level of noise (S/N≥3) from the sampled cells (Table 2). It was also validly hypothesized that the RS vs. CC comparison should have the greatest number of gene differences because this comparison represents both a difference in energy density of the diet and greater fermentation with RS compared to CC. Hierarchical clusters of the microarray results (Figure 1) also demonstrated that there were global differences in the differential expression results of genes for RS compared to both the CC and EC groups.
Originally the search for PANTHER pathways was for those that had a significant number of genes overrepresented and differentially expressed in an amount greater than by chance. Initially the searches were restricted with Bonferoni adjustment. .However, our next step was to focus on the RS vs. EC comparison for validation of the microarray results. As a result we expanded the number of PANTHER pathways by removing the Bonferoni adjustment. This was all dictated by our major goal, which was to examine the beneficial effects of fermentation beyond simple energy density dilution of the diet; and to broaden the scope for validation. Thirty three of the 44 pathways were represented with the TaqMan®Custom Array panels for the validation focusing in on the RS vs. EC comparison. Other genes included in the panels were for peptide hormones, growth and immune factors. The results from the validation demonstrate that our broadening was an effective strategy as 86% of the genes from the microarray chosen for the panels remained significantly differentially expressed (Figure 2).
The general picture from the results of the validation of the microarray using the RS vs. EC comparison, is one of growth of the gut with appropriate signaling pathways for cell division and apoptosis. We previously showed increased thickness of the cecal mucosal layer with feeding of HAM-RS2 to rats (unpublished data: CCa, 3979; ECb, 4608; 19% weight of diet as HAM-RS2c, 5555; ±172 μm pooled error). Other researchers have reported increased colon proliferation in neonatal pigs fed fructooligosaccharide (FOS) [20], and this is considered healthy as there is increased surface area for absorption of nutrients [18]. Several genes were listed in PANTHER as part of the integrin pathway. These included Actn1 and Actn4, Fn1, Frk, Mapk3, Arf2 and Arf3 (see tables 3-5 for gene abbreviations and names). Functions listed in PANTHER for this list of genes are in line with Rust et al. [21] who describe integrins as cell surface receptors that regulate many intracellular processes. These processes include “growth, death (apoptosis), adhesion, migration, and invasion by activating several signaling pathways.” Integrins are also considered good targets for chemotherapeutic agents to treat cancer. Other genes also fit these functions. Mras appears to function in reorganization of the actin cytoskeleton [22]. Bmps are a group of growth factors also called cytokines that were originally discovered for induction of the formation of bone and cartilage, but they are now known to be morphogenetic factors important for tissue architecture throughout the body [23]. Dusp proteins respond to oxidative stress and also negatively regulate cell proliferation by inactivation of mitogen-activated protein (MAP) kinase phosphatases [24-26]. Areg mRNA was highly elevated in RS vs. EC rats (FC, 11.3, p value = 4 × 10-16), and the protein product of this gene is part of the epidermal growth factor (EGF) family and interacts with EGF and transforming growth factor-alpha (TGF-α) to promote growth and regeneration of normal epithelial cells [27] and inhibit growth of certain aggressive cancer cell lines [28]. However, increased Areg is also associated with tumors [29]. Le Leu et al. [30] have reported that dietary RS promotes apoptosis of pre-cancerous cells, while not reducing normal cell proliferation. Thus, the data indicate that dietary RS supports normal healthy growth of the gut while likely preventing growth of tumors.
Similar to simultaneous stimulation of growth factors and inhibitors of growth was an increase in the mRNA of a pro-inflammatory signal Il1a [31]. Along with an increase in gene expression of Il1a there was an increased expression for a regulator and promoter of the cell cycle, Cdk2 [32]. Apoptosis is required to turn off inflammation. Thus, there was also increased gene expression of Cdkn1a, the cyclin-dependent kinase inhibitor which promotes apoptosis of potentially inflammatory cells [33]. Several caspase proteins are involved in activation of pro-inflammatory cytokines that function in innate immunity. However, for Casp4 no substrate has been identified and so its function remains unknown [34]. Tnfrsf1a is a receptor for the TNF proteins [35]. Upon binding of TNF proteins to TNF receptors one of three pathways can be stimulated based on cell type and conditions [36, 37]. TNF can be involved in either promoting or preventing apoptosis and stimulating the immune response. Thus, there was increased expression of genes for inflammation, cell proliferation and apoptosis.
Several other factors that had significantly increased mRNA for the RS vs. EC comparison also support increased healthy growth of the gut. Eif2s1 is the alpha subunit of Eif that catalyzes the first regulated step of protein synthesis initiation, promoting the binding of the initiator tRNA to ribosomal subunits [38]. Ereg also belongs to the EGF family of polypeptides and is involved in cell proliferation [39], but Ereg is also up-regulated in cancer cell growth [40]. Several of the Gadd45 proteins promote apoptosis by activating mitogen-activated protein kinase kinase (MEKK/MTK1), which then increases mitogen-activated protein kinase kinase 4 (MKK4) and then phosphorylation of c-Jun N-terminal kinase (JNK) [41]. In several types of cancer cells, nuclear factor kappa-light-chain-enhancer of activated B cells (NF-κB) increases the protein cellular myc (c-myc) which represses gene expression of GADD45α and γ and the result is the escape from programmed cell death [42]. Jun-B proto-oncogene mRNA was increased and this occurs under control of TGFβ [43], and is associated with cell proliferation and differentiation [44]. However, knock down of Jun-B in wild type murine fibroblasts did result in increased proliferation and tumorigenicity [45]. Rhob inhibits NF-κB activity, which would then promote apoptosis of damaged cells [46]. Gdf15 is produced in response to injury and regulates [47] inflammation, cell survival, proliferation, and apoptosis in several types of injured tissues with varying disease processes. Additionally, Nfkbib mRNA was increased indicating the binding of NF-κB and increased apoptosis as NF-κB is known to be an inhibitor of apoptosis and increased activity increases risk of cancer [41]. Psme3 (also known as PA28γ) promotes an interaction between tumor suppressor p53 and murine double minute oncogene (MDM2) and this may be the mechanism by which Psme3 inhibits apoptosis and promotes cell cycle progression [48].
Additionally, mRNAs of several genes whose proteins regulate blood flow were increased. Hif1a mRNA was increased and the protein is a subunit of the transcription factor Hif-1. This transcription factor plays a role in inducing transcription of genes whose proteins play a role in survival during hypoxia [49]. Hypoxia also induces Vegfa [49], and Vegfa mRNA was increased and the protein product promotes increased blood vessel development [50]. At the same time, Adm mRNA was increased and translation of Adm mRNA results in a proadrenomedullin peptide that upon post-translational modification results in a peptide that promotes vasodialtion and hypotension by inhibiting angiotensin II [51]. However, Adm protein is also elevated in disorders in patients with disorders of the cardiovascular system [51]. All of these conditions, excluding the cardiovascular disorders, are necessary for growth of tissue.
Atf3 gene expression was highly up-regulated. When the protein product of this gene was discovered to be a transcription factor, it was assumed that it was an activating factor because the majority of transcription factor proteins are activating factors and very few repressors have been discovered [52]. However, it was later discovered that there are several different alternatively spliced isoforms. Atf3 functions as a repression element by its binding to promoters of genes and stabilizing inhibitory co-factors. Another version of the protein, Atf3ΔZip, lacks the ability to bind to DNA as it lacks the leucine zipper domain. This version of the protein actually activates gene transcription as it appears to bind to inhibitory co-factors and prevent their interaction with gene promoter regions [52]. Hackl et al [53] discuss that Atf3 is involved in “the complex process of cellular stress response.” Also under various conditions the protein can have tumor suppressive or oncogenic effects. They reported that down-regulation of Atf3 promoted colon cancer and that blocking the production of heat shock protein 90 Hsp90, increased Atf3 production [53]. Another recent publication reported that Atf3 can have positive or negative effects on proliferation and survival of adult T-cell leukemia cells depending on the conditions [54].
Genes for several detoxifying enzymes were up-regulated with the RS vs. EC comparison. Gsta5 represented this group in the validation. It appears that increased levels of expression of these genes represent sensitivity to noxious chemicals [55]. Compounds known to protect against chemical carcinogenesis, such as coumarins and phenolic antioxidants, are known to increase amounts of glutathione S-transferase enzymes.
Additionally, several fatty acid binding proteins were up-regulated by the RS vs. EC comparison. Slc16a3 is also monocarboxylate transporter 4 that transports lactate, pyruvate and the ketone bodies, acetoacetate and β-hydroxybutyrate [56]. Fabp2 which binds long chain fatty acids [57] was up-regulated, but Fabp6 appears to bind bile acids in the cytoplasm after sodium-dependent uptake by enterocytes by active transport [58] was down-regulated by RS. Several other Slc16a transporter proteins were up-regulated in the gene array, but were not included in the validation. For example, Slc16a1, also called monocarboxylate transporter 1, transports short chain fatty acids into cells [59, 60].
Several other gene mRNAs were increased with the RS vs. EC comparison that were identified by PANTHER as proteins that are components of metabolic pathways. Acat3 combines cholesterol and fatty acids to form cholesterol esters in several tissues. Acat1 is ubiquitous, but Acat3 is limited to intestine and liver [61]. Currently at the NCBI website the Entrez Gene ID number from PANTHER for Acat2 discussed in [61] refers to Acat3. Idh2 is a mitochondrial, NADP+-enzyme that catalyzes the third step in the citric acid cycle converting isocitrate to α-ketoglutarate [62]. Asns produces asparagine from aspartate. Cbs is an enzyme catalyzing the reaction of serine plus homocysteine to cystathionine. Eno1 is an enzyme that catalyzes the conversion of 2-phosphoglycerate to phosphoenolpyruvate in glycolysis. Pdxk converts pyridoxal to pyridoxal phosphate. All of the proteins from these genes would be important for normal cellular metabolism and their function is commonly known.
Three peptide hormone mRNAs, Gcg, Pyy, and neurotensin (Nts), that were increased for RS vs. EC in the microarray were also validated with the panels or separately (Nts) by individual qPCR. Plasma levels of GLP-1 and PYY were also measured in this study and were elevated for RS compared to either CC or EC groups. Our lab group has previously demonstrated in several studies that Gcg and Pyy gene expression and plasma peptide levels are increased with feeding of HAM-RS2 to rodents. [5, 8, 9, 11, 12] Thus, Gcg and Pyy were used as positive controls for the microarray and validation. Gcg is the glucagon gene that is also referred to as preproglucagon or proglucagon. The protein is produced in pancreatic α cells, brain and intestine and undergoes different post-translational modification depending on the tissue [63]. In the L-endocrine cells of the intestine the products are GLP-1, glucagon-like peptide 2 and oxyntomodulin. PYY is also produced by L-endocrine cells in the intestine. In the gut these peptides are associated with improved health. Nts is produced by NT cells in the intestine [64] and is also produced in neural cells throughout the body. In the gut, Nts is reported to control gut motility [65]. GLP-1 and PYY are involved with glucose control [66, 67] and energy metabolism [68-75].
For the most part, but with some exceptions, gene expression results for the validation were similar for the RS vs. EC and RS vs. CC comparisons. However, the CC vs. EC comparison results from the validation were quite different from the results of the other two comparisons (Figures 2-4). This was expected as the differences between the CC and EC groups were lower energy density in the EC diet and a greater amount of cellulose. Clearly then, the greatest amount of gene expression was altered in RS vs.EC compared to EC vs. CC. Thus, increased fermentation in RS rats had a fairly similar response for many genes to rats fed the CC diet with a greater energy density diet. The numerical results are summarized with Venn-diagrams in figure 5; and specific similarities and differences between these two groups of rats can be determined using figures 2 and 3. The differences in results between RS and CC groups further demonstrate that fermentation of RS impacted the cecal gene expression profile more than energy dilution in rats.
Figure 3.
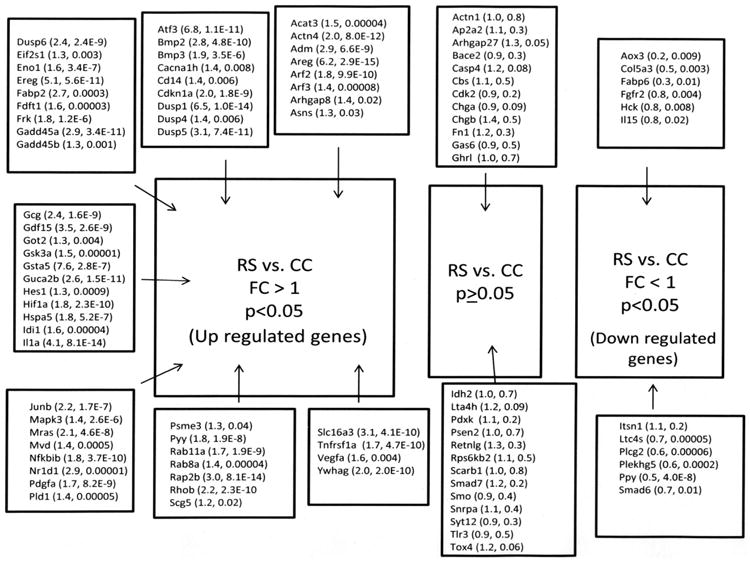
Results of validation for the RS vs. CC comparison. Genes are identified by their abbreviation. In parentheses are the (fold change, p value). Names of genes and their abbreviations are listed in tables 3 through 5.
Previous reports of gene array and validation results with other sources of fermentable fibers, such as fructooligosaccharide (FOS) and wheat bran, demonstrate some general similarity to the results from the currently reported study [18, 76]. Chen et al [18] report greater amounts of changes in gene expression with FOS than with wheat bran, presumably because of higher rates of fermentation and short chain fatty acid production. Wheat bran is considered to ferment more slowly than FOS and its fermentation is less complete than FOS. Chen et al. [18] also speculate that different transit times can affect fermentation and gene expression results. RS is generally used in rodent diets in greater amounts than for similar studies with FOS. In the current study, the amount of HAM-RS2 used was an amount that promotes abdominal body fat loss in rodents (>25% of weight of diet) [5, 8, 9, 13]. Unlike Chen et al. [18] who report fold changes greater than 1.6, Fukasawa et al. [76] report fold changes greater than 1. We also chose to report data as fold changes lower than a prescribed number such as 1.5 because many of the relatively lower fold changes for gene expression had extremely small p values. Obviously there is no difference in significance at p<0.05 and p<0.01 as significance is set by convention of p<0.05. However, the risk of a type 1 error is much lower for the latter p value. Small fold changes for RS vs. EC with a very small p value may represent important treatment differences because of very low variation of the mean.
One major advantage of our current microarray and validation study is that we employed an energy dilution control. Energy dilution occurs when dietary fiber components replace starches or other carbohydrates in diet formulations. Fukasawa et al [76] increased FOS at the expense of sucrose resulting in two groups similar to our RS vs. CC comparison as their FOS group would have a lower energy density than their control group. On the other hand, Chen et al. [18] controlled for dietary fiber, but not energy density as their control diet with 10% by weight of diet as cellulose had a lower energy density than their experimental diets with either FOS or wheat bran. However, this difference is relatively small with a maximum of a 7% difference in energy density as the total fiber in all diets is only 10% of the diet. In the current study, the CC diet is essentially an AIN-93 diet [15] and has greater energy density than the RS and EC diets. Based on an approximate calculation using the metabolizable energy density of 2.8 kcal/g for the Hi-maize® high amylose cornstarch [10] ∼50% of the HAM-RS2 in our HAM-RS2 diet is fermented. What this means is the following: 1) Hi-maize® high amylose cornstarch is ∼56% HAM-RS2, 2) based on the amount of Hi-maize® added to the diet, 530.7 g/1000 g of diet, ∼297 g of HAM-RS2/1000 g of diet were added, 3) ∼50% of the 297 g of HAM-RS2 is not fermented. Using this approximation and information, the HAM-RS2 diet has ∼11% more non-fermentable fiber than the EC diet, but the same energy density. This includes 50 g of cellulose/1000 g of diet and ∼50% of the 297 g of HAM-RS2/1000 g of diet or 148.5 g/1000 g of diet. The EC diet had 177 g cellulose added/1000g of diet. Thus, in the current study, we controlled for dietary energy density, were close in non-fermentable fiber, and tested for fermentable fiber with the RS vs. EC comparison.
In summary, a microarray and validation of the microarray were conducted with a total RNA extract from cecal cells in rats fed one of three treatment diets, RS, CC and EC. About 10,000 of ∼27,000 genes were expressed for all three groups. The greatest number of significantly differentially expressed genes was observed with the RS vs. CC comparison as this comparison measured both differences in energy density of the diet and fermentation effects. However, the focus of the validation was primarily on the RS vs. EC comparison because the two treatment diets were equal in energy density and specific fermentation effects were tested. Genes chosen for the validation had higher fold changes, lower p values and had to be inventoried by Applied Biosystems. The validation was “successful” as 86% of the genes chosen from the microarray were confirmed as significantly differentially expressed.
Further, the results demonstrated that fermentation of HAM-RS2 altered expression of genes that would result in cell growth, proliferation and differentiation of the gut, as well as expression of genes involved in apoptosis and control of cell proliferation. Additionally, expression of several genes related to metabolic pathways and gut peptide hormones were altered, such as GLP-1 and PYY. Plasma levels for these hormones were also increased. GLP-1 and PYY can have effects throughout the body. Overall, the increased gene expressions observed appears to improve the structure and function of the GI tract, based on their functions and supporting information in the literature. Because fermentation of dietary resistant starch changes the gene expression profile in cecal cells, the physiological relevance of these gene expression changes requires further investigation to explore the beneficial effects of HAM-RS2 beyond simple dietary energy dilution as a fiber.
Figure 7.
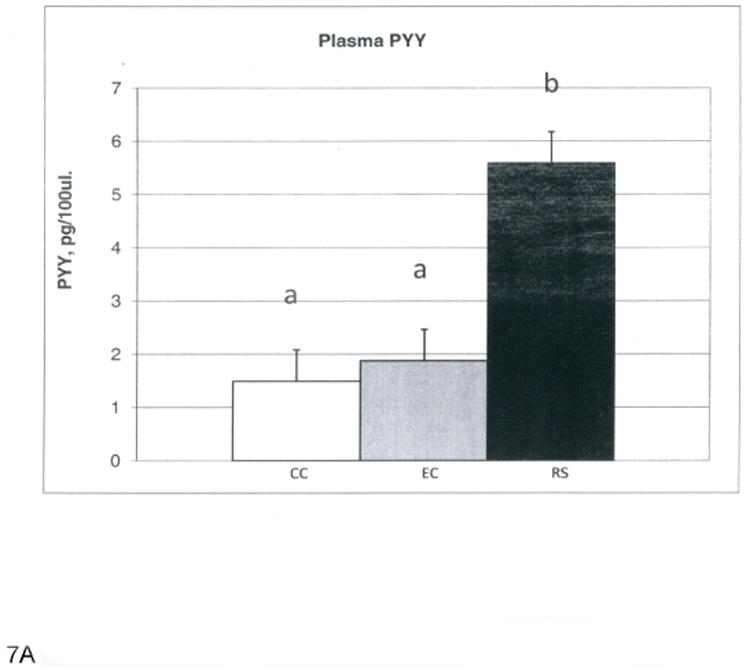
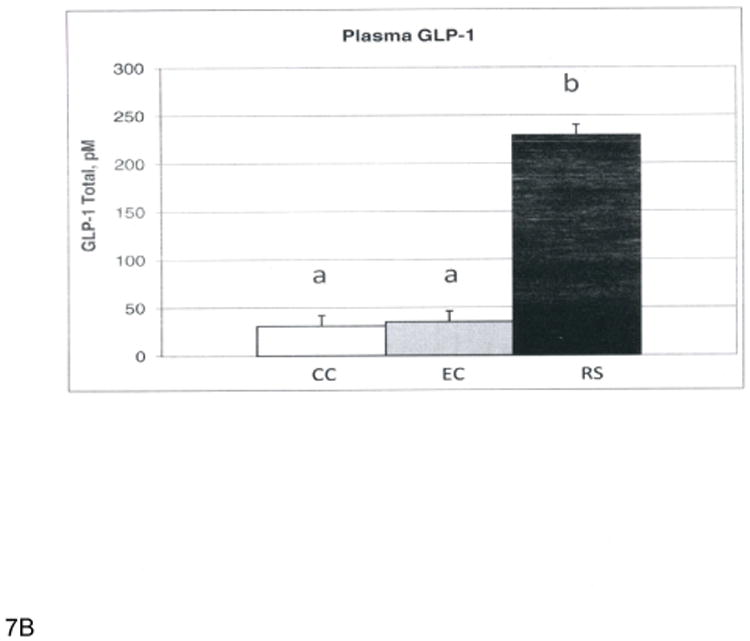
A. Plasma PYY levels (pg/100μl). B. Plasma GLP-1 levels (pM). Bars with different superscripts are statistically different at p<0.0001.
Acknowledgments
This paper was approved for publication by the Director of Louisiana Agricultural Experiment Station as manuscript no. 2011-239-6315. This research was supported by grants from National Starch LLC and the LSU AgCenter Biotechnology Program. Amioca® and Hi-maize®260 were supplied as gifts by National Starch LLC, Bridgewater, NJ.
This project used Genomics core facilities that are supported in part by COBRE (NIH P20-RR021945) and NORC (NIH 1P30-DK072476) center grants from the National Institutes of Health.
The research was conducted at the Louisiana State University Agricultural Center and Pennington Biomedical Research Center.
References
- 1.Brown IL. Applications and uses of resistant starch. J AOAC Int. 2004;87:727–732. [PubMed] [Google Scholar]
- 2.Cassidy A, Bingham SA, Cummings JH. Starch intake and colorectal cancer risk: an international comparison. Br J Cancer. 1994;69:937–942. doi: 10.1038/bjc.1994.181. [DOI] [PMC free article] [PubMed] [Google Scholar]
- 3.de Deckere EA, Kloots WJ, van Amelsvoort JM. Resistant starch decreases serum total cholesterol and triacylglycerol concentrations in rats. J Nutr. 1993;123:2142–2151. doi: 10.1093/jn/123.12.2142. [DOI] [PubMed] [Google Scholar]
- 4.Higgins JA. Resistant starch: metabolic effects and potential health benefits. J AOAC Int. 2004;87:761–768. [PubMed] [Google Scholar]
- 5.Keenan MJ, Zhou J, McCutcheon KL, Raggio AM, Bateman HG, Todd E, Jones CK, Tulley RT, Melton S, Martin RJ, Hegsted M. Effects of resistant starch, a non-digestible fermentable fiber, on reducing body fat. Obesity (Silver Spring) 2006;14:1523–1534. doi: 10.1038/oby.2006.176. [DOI] [PubMed] [Google Scholar]
- 6.Robertson MD, Bickerton AS, Dennis AL, Vidal H, Frayn KN. Insulin-sensitizing effects of dietary resistant starch and effects on skeletal muscle and adipose tissue metabolism. Am J Clin Nutr. 2005;82:559–567. doi: 10.1093/ajcn.82.3.559. [DOI] [PubMed] [Google Scholar]
- 7.Robertson MD, Currie JM, Morgan LM, Jewell DP, Frayn KN. Prior short-term consumption of resistant starch enhances postprandial insulin sensitivity in healthy subjects. Diabetologia. 2003;46:659–665. doi: 10.1007/s00125-003-1081-0. [DOI] [PubMed] [Google Scholar]
- 8.Shen L, Keenan MJ, Raggio A, Williams C, Martin RJ. Dietary-resistant starch improves maternal glycemic control in Goto-Kakazaki rat. Molecular Nutrition and Food Research. 2011;55 doi: 10.1002/mnfr.201000605. [DOI] [PMC free article] [PubMed] [Google Scholar]
- 9.Shen L, Keenan MJ, Martin RJ, Tulley RT, Raggio AM, McCutcheon KL, Zhou J. Dietary Resistant Starch Increases Hypothalamic POMC Expression in Rats. Obesity (Silver Spring) 2009;17:40–45. doi: 10.1038/oby.2008.483. [DOI] [PMC free article] [PubMed] [Google Scholar]
- 10.Tulley RT, Appel MJ, Enos TG, Hegsted M, McCutcheon KL, Zhou J, Raggio AM, Jeffcoat R, Birkett A, Martin RJ, Keenan MJ. Comparative Methodologies for Measuring Metabolizable Energy of Various Types of Resistant High Amylose Corn Starch. J Agric Food Chem. 2009 doi: 10.1021/jf900971c. [DOI] [PubMed] [Google Scholar]
- 11.Zhou J, Hegsted M, McCutcheon KL, Keenan MJ, Xi X, Raggio AM, Martin RJ. Peptide YY and proglucagon mRNA expression patterns and regulation in the gut. Obesity (Silver Spring) 2006;14:683–689. doi: 10.1038/oby.2006.77. [DOI] [PubMed] [Google Scholar]
- 12.Zhou J, Martin RJ, Tulley RT, Raggio AM, McCutcheon KL, Shen L, Danna SC, Tripathy S, Hegsted M, Keenan MJ. Dietary resistant starch upregulates total GLP-1 and PYY in a sustained day-long manner through fermentation in rodents. Am J Physiol Endocrinol Metab. 2008;295:E1160–1166. doi: 10.1152/ajpendo.90637.2008. [DOI] [PMC free article] [PubMed] [Google Scholar]
- 13.Zhou J, Martin RJ, Tulley RT, Raggio AM, Shen L, Lissy E, McCutcheon K, Keenan MJ. Failure to ferment dietary resistant starch in specific mouse models of obesity results in no body fat loss. J Agric Food Chem. 2009;57:8844–8851. doi: 10.1021/jf901548e. [DOI] [PMC free article] [PubMed] [Google Scholar]
- 14.Sajilata MG, Singhai RS, Kulkarni PR. Resistant starch: a review. Comprehensive Reviews in Food Science and Food Safety. 2006;5:1–17. doi: 10.1111/j.1541-4337.2006.tb00076.x. [DOI] [PubMed] [Google Scholar]
- 15.Reeves PG, Nielsen FH, Fahey GC., Jr AIN-93 purified diets for laboratory rodents: final report of the American Institute of Nutrition ad hoc writing committee on the reformulation of the AIN-76A rodent diet. J Nutr. 1993;123:1939–1951. doi: 10.1093/jn/123.11.1939. [DOI] [PubMed] [Google Scholar]
- 16.Behall KM, Howe JC. Resistant starch as energy. J Am Coll Nutr. 1996;15:248–254. doi: 10.1080/07315724.1996.10718595. [DOI] [PubMed] [Google Scholar]
- 17.Englyst HN, Kingman SM, Hudson GJ, Cummings JH. Measurement of resistant starch in vitro and in vivo. Br J Nutr. 1996;75:749–755. doi: 10.1079/bjn19960178. [DOI] [PubMed] [Google Scholar]
- 18.Chen Q, Swist E, Beckstead J, Green J, Matias F, Roberts J, Qiao C, Raju J, Brooks SP, Scoggan KA. Dietary fructooligosaccharides and wheat bran elicit specific and dose-dependent gene expression profiles in the proximal colon epithelia of healthy Fischer 344 rats. J Nutr. 2011;141:790–797. doi: 10.3945/jn.110.133421. [DOI] [PubMed] [Google Scholar]
- 19.Livak KJ, Schmittgen TD. Analysis of relative gene expression data using real-time quantitative PCR and the 2(-Delta Delta C(T)) Method. Methods. 2001;25:402–408. doi: 10.1006/meth.2001.1262. [DOI] [PubMed] [Google Scholar]
- 20.Howard MD, Gordon DT, Pace LW, Garleb KA, Kerley MS. Effects of dietary supplementation with fructooligosaccharides on colonic microbiota populations and epithelial cell proliferation in neonatal pigs. J Pediatr Gastroenterol Nutr. 1995;21:297–303. doi: 10.1097/00005176-199510000-00007. [DOI] [PubMed] [Google Scholar]
- 21.Rust WL, Carper SW, Plopper GE. The Promise of Integrins as Effective Targets for Anticancer Agents. J Biomed Biotechnol. 2002;2:124–130. doi: 10.1155/S1110724302204015. [DOI] [PMC free article] [PubMed] [Google Scholar]
- 22.Matsumoto K, Asano T, Endo T. Novel small GTPase M-Ras participates in reorganization of actin cytoskeleton. Oncogene. 1997;15:2409–2417. doi: 10.1038/sj.onc.1201416. [DOI] [PubMed] [Google Scholar]
- 23.Bleuming SA, He XC, Kodach LL, Hardwick JC, Koopman FA, Ten Kate FJ, van Deventer SJ, Hommes DW, Peppelenbosch MP, Offerhaus GJ, et al. Bone morphogenetic protein signaling suppresses tumorigenesis at gastric epithelial transition zones in mice. Cancer Res. 2007;67:8149–8155. doi: 10.1158/0008-5472.CAN-06-4659. [DOI] [PubMed] [Google Scholar]
- 24.Kim GS, Choi YK, Song SS, Kim WK, Han BH. MKP-1 contributes to oxidative stress-induced apoptosis via inactivation of ERK1/2 in SH-SY5Y cells. Biochem Biophys Res Commun. 2005;338:1732–1738. doi: 10.1016/j.bbrc.2005.10.143. [DOI] [PubMed] [Google Scholar]
- 25.Vogt A, McDonald PR, Tamewitz A, Sikorski RP, Wipf P, Skoko JJ, 3rd, Lazo JS. A cell-active inhibitor of mitogen-activated protein kinase phosphatases restores paclitaxel-induced apoptosis in dexamethasone-protected cancer cells. Mol Cancer Ther. 2008;7:330–340. doi: 10.1158/1535-7163.MCT-07-2165. [DOI] [PubMed] [Google Scholar]
- 26.Vogt A, Lazo JS. Discovery of protein kinase phosphatase inhibitors. Methods Mol Biol. 2007;356:389–400. doi: 10.1385/1-59745-217-3:389. [DOI] [PubMed] [Google Scholar]
- 27.Shao JSH. Amphiregulin promotes intestinal epithelial regeneration: roles of intestinal subepithelia myofibroblasts. Endocrinology. 2010;151:3728–3737. doi: 10.1210/en.2010-0319. [DOI] [PMC free article] [PubMed] [Google Scholar]
- 28.Plowman GD, Green JM, McDonald VL, Neubauer MG, Disteche CM, Todaro GJ, Shoyab M. The amphiregulin gene encodes a novel epidermal growth factor-related protein with tumor-inhibitory activity. Mol Cell Biol. 1990;10:1969–1981. doi: 10.1128/mcb.10.5.1969. [DOI] [PMC free article] [PubMed] [Google Scholar]
- 29.Billings SD, Southall MD, Li T, Cook PW, Baldridge L, Moores WB, Spandau DF, Foley JG, Travers JB. Amphiregulin overexpression results in rapidly growing keratinocytic tumors: an in vivo xenograft model of keratoacanthoma. Am J Pathol. 2003;163:2451–2458. doi: 10.1016/S0002-9440(10)63600-0. [DOI] [PMC free article] [PubMed] [Google Scholar]
- 30.Le Leu RK, Brown IL, Hu Y, Young GP. Effect of resistant starch on genotoxin-induced apoptosis, colonic epithelium, and lumenal contents in rats. Carcinogenesis. 2003;24:1347–1352. doi: 10.1093/carcin/bgg098. [DOI] [PubMed] [Google Scholar]
- 31.Dinarello CA. The interleukin-1 family: 10 years of discovery. FASEB J. 1994;8:1314–1325. [PubMed] [Google Scholar]
- 32.Chen S, Law CS, Gardner DG. Vitamin D-dependent suppression of endothelin-induced vascular smooth muscle cell proliferation through inhibition of CDK2 activity. J Steroid Biochem Mol Biol. 2010;118:135–141. doi: 10.1016/j.jsbmb.2009.11.002. [DOI] [PMC free article] [PubMed] [Google Scholar]
- 33.Rossi AG, Sawatzky DA, Walker A, Ward C, Sheldrake TA, Riley NA, Caldicott A, Martinez-Losa M, Walker TR, Duffin R, et al. Cyclin-dependent kinase inhibitors enhance the resolution of inflammation by promoting inflammatory cell apoptosis. Nat Med. 2006;12:1056–1064. doi: 10.1038/nm1468. [DOI] [PubMed] [Google Scholar]
- 34.Martinon FTJ. Inflammatory caspases and inflammasomes: master switches of inflammation. Cell Death and Differentation. 2007;14:10–22. doi: 10.1038/sj.cdd.4402038. [DOI] [PubMed] [Google Scholar]
- 35.Aggarwal BB, Aiyer RA, Pennica D, Gray PW, Goeddel DV. Human tumour necrosis factors: structure and receptor interactions. Ciba Found Symp. 1987;131:39–51. doi: 10.1002/9780470513521.ch4. [DOI] [PubMed] [Google Scholar]
- 36.Chen G, Goeddel DV. TNF-R1 signaling: a beautiful pathway. Science. 2002;296:1634–1635. doi: 10.1126/science.1071924. [DOI] [PubMed] [Google Scholar]
- 37.Wajant H. Death receptors. Essays Biochem. 2003;39:53–71. doi: 10.1042/bse0390053. [DOI] [PubMed] [Google Scholar]
- 38.Hershey JW. Translational control in mammalian cells. Annu Rev Biochem. 1991;60:717–755. doi: 10.1146/annurev.bi.60.070191.003441. [DOI] [PubMed] [Google Scholar]
- 39.Shirakata Y, Komurasaki T, Toyoda H, Hanakawa Y, Yamasaki K, Tokumaru S, Sayama K, Hashimoto K. Epiregulin, a novel member of the epidermal growth factor family, is an autocrine growth factor in normal human keratinocytes. J Biol Chem. 2000;275:5748–5753. doi: 10.1074/jbc.275.8.5748. [DOI] [PubMed] [Google Scholar]
- 40.Zhu ZKJ, Friess H, Wang L, Zimmerman A, Yarden Y, Buchler MW, Korc M. Epiregulin is up-regulated in pancreatic cancer and stimulates pancreatic cancer cell growth. Biochemical and Biophysical Research Communications. 2000;273:1019–1024. doi: 10.1006/bbrc.2000.3033. [DOI] [PubMed] [Google Scholar]
- 41.Zerbini LF, Libermann TA. Life and death in cancer GADD45 alpha and gamma are critical regulators of NF-kappaB mediated escape from programmed cell death. Cell Cycle. 2005;4:18–20. doi: 10.4161/cc.4.1.1363. [DOI] [PubMed] [Google Scholar]
- 42.Zerbini LF, Libermann TA. GADD45 deregulation in cancer: frequently methylated tumor suppressors and potential therapeutic targets. Clin Cancer Res. 2005;11:6409–6413. doi: 10.1158/1078-0432.CCR-05-1475. [DOI] [PubMed] [Google Scholar]
- 43.Li L, Hu JS, Olson EN. Different members of the jun proto-oncogene family exhibit distinct patterns of expression in response to type beta transforming growth factor. J Biol Chem. 1990;265:1556–1562. [PubMed] [Google Scholar]
- 44.Wilkinson DG, Bhatt S, Ryseck RP, Bravo R. Tissue-specific expression of c-jun and junB during organogenesis in the mouse. Development. 1989;106:465–471. doi: 10.1242/dev.106.3.465. [DOI] [PubMed] [Google Scholar]
- 45.Gurzov EN, Bakiri L, Alfaro JM, Wagner EF, Izquierdo M. Targeting c-Jun and JunB proteins as potential anticancer cell therapy. Oncogene. 2008;27:641–652. doi: 10.1038/sj.onc.1210690. [DOI] [PubMed] [Google Scholar]
- 46.Fritz G, Kaina B. Ras-related GTPase Rhob represses NF-kappaB signaling. J Biol Chem. 2001;276:3115–3122. doi: 10.1074/jbc.M005058200. [DOI] [PubMed] [Google Scholar]
- 47.Zimmers TA, Jin X, Hsiao EC, McGrath SA, Esquela AF, Koniaris LG. Growth differentiation factor-15/macrophage inhibitory cytokine-1 induction after kidney and lung injury. Shock. 2005;23:543–548. [PubMed] [Google Scholar]
- 48.Zhang Z, Zhang R. Proteasome activator PA28 gamma regulates p53 by enhancing its MDM2-mediated degradation. EMBO J. 2008;27:852–864. doi: 10.1038/emboj.2008.25. [DOI] [PMC free article] [PubMed] [Google Scholar]
- 49.Lang KJ, Kappel A, Goodall GJ. Hypoxia-inducible factor-1alpha mRNA contains an internal ribosome entry site that allows efficient translation during normoxia and hypoxia. Mol Biol Cell. 2002;13:1792–1801. doi: 10.1091/mbc.02-02-0017. [DOI] [PMC free article] [PubMed] [Google Scholar]
- 50.Holmes KRO, Thomas AM, Cross MJ. Vascular endothelial growth factor receptor-2: Structure, function, intracellular signalling and therapeutic inhibition. Cellular Signalling. 2007;19:2003–2012. doi: 10.1016/j.cellsig.2007.05.013. [DOI] [PubMed] [Google Scholar]
- 51.Rossi F, Bertone C, Petricca S, Santiemma V. Adrenomedullin antagonizes angiotensin II-stimulated proliferation of human aortic smooth muscle cells. Peptides. 2006;27:2935–2941. doi: 10.1016/j.peptides.2006.05.003. [DOI] [PubMed] [Google Scholar]
- 52.Chen BP, Liang G, Whelan J, Hai T. ATF3 and ATF3 delta Zip Transcriptional repression versus activation by alternatively spliced isoforms. J Biol Chem. 1994;269:15819–15826. [PubMed] [Google Scholar]
- 53.Hackl C, Lang SA, Moser C, Mori A, Fichtner-Feigl S, Hellerbrand C, Dietmeier W, Schlitt HJ, Geissler EK, Stoeltzing O. Activating transcription factor-3 (ATF3) functions as a tumor suppressor in colon cancer and is up-regulated upon heat-shock protein 90 (Hsp90) inhibition. BMC Cancer. 2010;10:668. doi: 10.1186/1471-2407-10-668. [DOI] [PMC free article] [PubMed] [Google Scholar]
- 54.Hagiya K, Yasunaga J, Satou Y, Ohshima K, Matsuoka M. ATF3, an HTLV-1 bZip factor binding protein, promotes proliferation of adult T-cell leukemia cells. Retrovirology. 2011;8:19. doi: 10.1186/1742-4690-8-19. [DOI] [PMC free article] [PubMed] [Google Scholar]
- 55.Pulford DJ, Hayes JD. Characterization of the rat glutathione S-transferase Yc2 subunit gene, GSTA5: identification of a putative antioxidant-responsive element in the 5′-flanking region of rat GSTA5 that may mediate chemoprotection against aflatoxin B1. Biochem J. 1996;318(Pt 1):75–84. doi: 10.1042/bj3180075. [DOI] [PMC free article] [PubMed] [Google Scholar]
- 56.Dimmer KS, Friedrich B, Lang F, Deitmer JW, Broer S. The low-affinity monocarboxylate transporter MCT4 is adapted to the export of lactate in highly glycolytic cells. Biochem J. 2000;350(Pt 1):219–227. [PMC free article] [PubMed] [Google Scholar]
- 57.Franchini GR, Curto LM, Caramelo JJ, Delfino JM. Dissection of a beta-barrel motif leads to a functional dimer: the case of the intestinal fatty acid binding protein. Protein Sci. 2009;18:2592–2602. doi: 10.1002/pro.273. [DOI] [PMC free article] [PubMed] [Google Scholar]
- 58.Bonne A, Gosele C, den Bieman M, Gillissen G, Kreitler T, Pravenec M, Kren V, van Lith H, van Zutphen B. Sequencing and chromosomal localization of Fabp6 and an intronless Fabp6 segment in the rat. Mol Biol Rep. 2003;30:173–176. doi: 10.1023/a:1024968606162. [DOI] [PubMed] [Google Scholar]
- 59.Hadjiagapiou C, Schmidt L, Dudeja PK, Layden TJ, Ramaswamy K. Mechanism(s) of butyrate transport in Caco-2 cells: role of monocarboxylate transporter 1. Am J Physiol Gastrointest Liver Physiol. 2000;279:G775–780. doi: 10.1152/ajpgi.2000.279.4.G775. [DOI] [PubMed] [Google Scholar]
- 60.Saksena S, Dwivedi A, Gill RK, Singla A, Alrefai WA, Malakooti J, Ramaswamy K, Dudeja PK. PKC-dependent stimulation of the human MCT1 promoter involves transcription factor AP2. Am J Physiol Gastrointest Liver Physiol. 2009;296:G275–283. doi: 10.1152/ajpgi.90503.2008. [DOI] [PMC free article] [PubMed] [Google Scholar]
- 61.Hori M, Satoh M, Furukawa K, Sakamoto Y, Hakamata H, Komohara Y, Takeya M, Sasaki Y, Miyazaki A, Horiuchi S. Acyl-coenzyme A:cholesterol acyltransferase-2 (ACAT-2) is responsible for elevated intestinal ACAT activity in diabetic rats. Arterioscler Thromb Vasc Biol. 2004;24:1689–1695. doi: 10.1161/01.ATV.0000137976.88533.13. [DOI] [PubMed] [Google Scholar]
- 62.Reitman ZJ, Jin G, Karoly ED, Spasojevic I, Yang J, Kinzler KW, He Y, Bigner DD, Vogelstein B, Yan H. Profiling the effects of isocitrate dehydrogenase 1 and 2 mutations on the cellular metabolome. Proc Natl Acad Sci U S A. 2011;108:3270–3275. doi: 10.1073/pnas.1019393108. [DOI] [PMC free article] [PubMed] [Google Scholar]
- 63.Kieffer TJ, Habener JF. The glucagon-like peptides. Endocr Rev. 1999;20:876–913. doi: 10.1210/edrv.20.6.0385. [DOI] [PubMed] [Google Scholar]
- 64.Kislauskis E, Bullock B, McNeil S, Dobner PR. The rat gene encoding neurotensin and neuromedin N. Structure, tissue-specific expression, and evolution of exon sequences. J Biol Chem. 1988;263:4963–4968. [PubMed] [Google Scholar]
- 65.Degolier TF, Duke GE, Carraway RE. Neurotensin decreases pepsin output and gastrointestinal motility in chickens. Poult Sci. 1997;76:1435–1439. doi: 10.1093/ps/76.10.1435. [DOI] [PubMed] [Google Scholar]
- 66.Boey D, Sainsbury A, Herzog H. The role of peptide YY in regulating glucose homeostasis. Peptides. 2007;28:390–395. doi: 10.1016/j.peptides.2006.07.031. [DOI] [PubMed] [Google Scholar]
- 67.Lovshin JA, Drucker DJ. Incretin-based therapies for type 2 diabetes mellitus. Nat Rev Endocrinol. 2009;5:262–269. doi: 10.1038/nrendo.2009.48. [DOI] [PubMed] [Google Scholar]
- 68.Boey D, Heilbronn L, Sainsbury A, Laybutt R, Kriketos A, Herzog H, Campbell LV. Low serum PYY is linked to insulin resistance in first-degree relatives of subjects with type 2 diabetes. Neuropeptides. 2006;40:317–324. doi: 10.1016/j.npep.2006.08.002. [DOI] [PubMed] [Google Scholar]
- 69.Batterham RL, Cowley MA, Small CJ, Herzog H, Cohen MA, Dakin CL, Wren AM, Brynes AE, Low MJ, Ghatei MA, et al. Gut hormone PYY(3-36) physiologically inhibits food intake. Nature. 2002;418:650–654. doi: 10.1038/nature00887. [DOI] [PubMed] [Google Scholar]
- 70.Lee M, Wardlaw SL. The central melanocortin system and the regulation of energy balance. Front Biosci. 2007;12:3994–4010. doi: 10.2741/2366. [DOI] [PubMed] [Google Scholar]
- 71.Ma X, Bruning J, Ashcroft FM. Glucagon-like peptide 1 stimulates hypothalamic proopiomelanocortin neurons. J Neurosci. 2007;27:7125–7129. doi: 10.1523/JNEUROSCI.1025-07.2007. [DOI] [PMC free article] [PubMed] [Google Scholar] [Retracted]
- 72.Osaka T, Endo M, Yamakawa M, Inoue S. Energy expenditure by intravenous administration of glucagon-like peptide-1 mediated by the lower brainstem and sympathoadrenal system. Peptides. 2005;26:1623–1631. doi: 10.1016/j.peptides.2005.02.016. [DOI] [PubMed] [Google Scholar]
- 73.Pannacciulli N, Bunt JC, Koska J, Bogardus C, Krakoff J. Higher fasting plasma concentrations of glucagon-like peptide 1 are associated with higher resting energy expenditure and fat oxidation rates in humans. Am J Clin Nutr. 2006;84:556–560. doi: 10.1093/ajcn/84.3.556. [DOI] [PubMed] [Google Scholar]
- 74.Usui D, Yamaguchi-Shima N, Okada S, Shimizu T, Wakiguchi H, Yokotani K. Selective activation of the sympathetic ganglia by centrally administered corticotropin-releasing factor in rats. Auton Neurosci. 2009;146:111–114. doi: 10.1016/j.autneu.2008.12.008. [DOI] [PubMed] [Google Scholar]
- 75.Adams SH, Lei C, Jodka CM, Nikoulina SE, Hoyt JA, Gedulin B, Mack CM, Kendall ES. PYY[3-36] administration decreases the respiratory quotient and reduces adiposity in diet-induced obese mice. J Nutr. 2006;136:195–201. doi: 10.1093/jn/136.1.195. [DOI] [PubMed] [Google Scholar]
- 76.Fukasawa T, Murashima K, Matsumoto I, Hosono A, Ohara H, Nojiri C, Koga J, Kubota H, Kanegae M, Kaminogawa S, et al. Identification of marker genes for intestinal immunomodulating effect of a fructooligosaccharide by DNA microarray analysis. J Agric Food Chem. 2007;55:3174–3179. doi: 10.1021/jf062814q. [DOI] [PubMed] [Google Scholar]