

ABSTRACT
Bacteria shed a diverse set of outer membrane vesicles that function as transport vehicles to deliver effector molecules and virulence factors to host cells. Helicobacter pylori is a gastric pathogen that infects half of the world’s population, and in some individuals the infection progresses into peptic ulcer disease or gastric cancer. Here we report that intact vesicles from H. pylori are internalized by clathrin-dependent endocytosis and further dynamin-dependent processes, as well as in a cholesterol-sensitive manner. We analyzed the uptake of H. pylori vesicles by gastric epithelial cells using a method that we refer to as quantification of internalized substances (qIS). The qIS assay is based on a near-infrared dye with a cleavable linker that enables the specific quantification of internalized substances after exposure to reducing conditions. Both chemical inhibition and RNA interference in combination with the qIS assay showed that H. pylori vesicles enter gastric epithelial cells via both clathrin-mediated endocytosis and additional endocytic processes that are dependent on dynamin. Confocal microscopy revealed that H. pylori vesicles colocalized with clathrin and dynamin II and with markers of subsequent endosomal and lysosomal trafficking. Interestingly, however, knockdown of components required for caveolae had no significant effect on internalization and knockdown of components required for clathrin-independent carrier (CLIC) endocytosis increased internalization of H. pylori vesicles. Furthermore, uptake of vesicles by both clathrin-dependent and -independent pathways was sensitive to depletion, but not sequestering, of cholesterol in the host cell membrane suggesting that membrane fluidity influences the efficiency of H. pylori vesicle uptake.
IMPORTANCE
Bacterial vesicles act as long-distance tools to deliver toxins and effector molecules to host cells. Vesicles can cause a variety of host cell responses via cell surface-induced cell signaling or internalization. Vesicles of diverse bacterial species enter host cells via different endocytic pathways or via membrane fusion. With the combination of a fluorescence-based quantification assay that quantifies internalized vesicles in a large number of cells and either chemical inhibition or RNA interference, we show that clathrin-mediated endocytosis is the major pathway for uptake of Helicobacter pylori vesicles and that lipid microdomains of the host cell membrane affect uptake of vesicles via clathrin-independent pathways. Our results provide important insights about membrane fluidity and its important role in the complex process that directs the H. pylori vesicle to a specific endocytic pathway. Understanding the mechanisms that operate in vesicle-host interactions is important to fully recognize the impact of vesicles in pathogenesis.
INTRODUCTION
Bacterial virulence factors can be delivered to host cells through different secretion mechanisms (1). One such strategy that Gram-negative bacteria use to avoid intimate contact with host cells is the secretion of membrane vesicles (2, 3). These vesicles are shed from the bacterial outer membrane, vary in size, and carry a large set of bacterial substances and virulence factors, such as adhesins, proteases, and toxins, in a concentrated form (4). Membrane vesicles can promote infection, impair host cell functions, and modulate host immune defenses and responses (5, 6). A series of reports have described the cellular internalization of bacterial vesicle substances and shown that this internalization occurs through both endocytosis and membrane fusion (5, 7).
Endocytosis is the fundamental process used by cells to communicate between their interior and the surrounding environment (8). The process involves invagination of the cell membrane and occurs through different pathways that vary depending on the composition, morphology, and size of the vesicles and the cargo being internalized. The different pathways are characterized by the proteins and lipids that are involved in the internalization process, and the most-studied pathway involves the formation of uniform clathrin-coated vesicles (9). Clathrin-mediated endocytosis (CME) utilizes complex protein machinery, with clathrin, adaptor protein 2 (AP-2), and dynamin as its core components. Dynamin is involved in scission of clathrin-coated pits from the plasma membrane and has also been suggested to be an important component in other endocytic pathways (8, 10, 11). Lipid microdomains are dynamic nanoscale assemblies in the plasma membrane that are formed by cholesterol, sphingolipids, and proteins that are associated with different clathrin-independent endocytic pathways (8, 10, 12, 13).
Vesicles from enterotoxigenic Escherichia coli (ETEC), Porphyromonas gingivalis, and Moraxella catarrhalis enter host cells via lipid rafts in a clathrin-independent manner (14–16), and vesicles from Aggregatibacter actinomycetemcomitans and Pseudomonas aeruginosa fuse with lipid raft microdomains of host cells (17, 18). Recently, dynamin has been shown to be important for the uptake of bacterial vesicles (19, 20). Uptake of Helicobacter pylori vesicles has been suggested to occur via CME or via lipid microdomains (21, 22).
H. pylori persistently infects about half of the world’s population; 10 to 15% of infected individuals develop peptic ulcer disease, and 1 to 2% develop gastric cancers (23). Membrane vesicles shed from H. pylori have been detected in gastric biopsy specimens and intracellularly (24, 25). The vesicle content has been characterized in detail and found to contain more than a hundred different proteins, including several of the known H. pylori virulence factors (24–27). Because the H. pylori vesicle population is heterogeneous in terms of protein and lipid composition (26), a scenario where different endocytic routes might be involved in the cellular uptake of vesicles by host cells has been proposed (21, 22, 28). However, some results have been contradictory, which has made it difficult to reach a final conclusion. In this study, we used several techniques together with a specific control for CME to further address this question. RNA interference and chemical inhibition were used to specifically block endocytic pathways followed by quantification of the vesicles internalized by the host cell. We conclude that uptake of H. pylori vesicles is facilitated by both CME and clathrin-independent endocytic pathways. We also used specific markers for different endocytic pathways in fluorescent confocal microscopy and found that H. pylori vesicles are routed via the endocytic pathway. In summary, our results suggest that a dynamic host cell membrane promotes the internalization of vesicles with pleomorphic characteristics.
RESULTS
Host cell entry by H. pylori vesicles.
Previous work from our laboratory has shown that H. pylori vesicles have a complex protein composition and that the vesicle population is highly heterogeneous with respect to the size of the vesicles, which range from 20 nm to 300 nm in diameter (26). We isolated highly pure vesicles to study bacterial vesicle entry into human gastric epithelial cells. This ensures that the uptake and associated cellular responses are due to the vesicles and not to soluble proteins in the vesicle preparations. Vesicles were added to gastric adenocarcinoma epithelial AGS cells. The vesicles were either fluorescently labeled or unlabeled and were detected with a series of antibodies together with Alexa-labeled secondary antibodies or with streptavidin-FITC (fluorescein isothiocyanate) (Strp-FITC) and the biotinylated Lewis b receptor conjugate that interacts with high affinity with the H. pylori BabA adhesin. Internalization at different time points was analyzed by fluorescence microscopy. Independently of how the vesicles were detected, we found vesicles evenly distributed on the cell surface, inside the cells, and adhering to the glass surface (Fig. 1A; also, see Fig. S1 in the supplemental material). Using these approaches, it was difficult to reliably and quantitatively distinguish internalized vesicles from those bound to the cell surface. To circumvent these problems and to specifically study cell-internalized vesicles, we instead labeled the purified vesicles with a biotinylated cleavable linker. Under reducing conditions, the disulfide bond in the linker region is cleaved and biotin is released from the vesicle surface. We used a reducing agent, sodium 2-mercaptoethanesulfonate (MESNA), that cannot cross the cell membrane, so that the linker is cleaved on the noninternalized vesicles, and thus, only internalized vesicles are detected with Strp-FITC in confocal microscopy (Fig. 1B; also, see Fig. S2 in the supplemental material). We also confirmed that internalization of vesicles labeled with the biotin linker occurred to the same extent as unlabeled vesicles (data not shown).
FIG 1 .

Quantification of internalized substances—a new approach to study H. pylori vesicle cell internalization. (A) AGS cells and H. pylori vesicles after incubation for 2.5 h at 37°C. Despite extensive washing, unspecific adhesion of vesicles was observed. Cells were stained for F-actin (orange) and clathrin heavy chain (red). Biotin linker-labeled vesicles were visualized with Strp-FITC antibodies (green). Scale bar = 5 µm. (B) AGS cells and biotin-linker labeled H. pylori vesicles were incubated for 6 h. Vesicles were detected with Strp-FITC (green) after exposure to reducing conditions. In the merged 3D confocal image, the outline of the AGS cell was visualized after removal of the red channel (the plasma membrane). (C) Schematic presentation of the principle behind the qIS assay. Labeled vesicles bind to and are internalized into host cells at 37°C. The cell-impermeative reducing agent cleaves off the linker of noninternalized vesicles, allowing detection only of vesicles within cells. (Inset) IRDye800CW disulfide linker NHS ester (Li-Cor Biosciences). (D) IRDye800-labeled Tfn was incubated with AGS cells at 4°C for 30 min and pulse-chased for 20 min (+4°C/+37°C). Fluorescence achieved under nonreducing conditions (Non-red; buffer) was set at 100%. At 4°C, when Tfn is bound to the cell surface, reducing conditions (Red, MESNA) cleave the linker and this results in 35% IRDye800 fluorescence. In contrast, Tfn is internalized in pulse-chase experiments and the linker is protected from cleavage by the reducing agent and this results in 84% IRDye800 fluorescence. All experiments were performed in triplicate (n = 2). Statistical significance was as follows: for 4°C, P = 0.0313; for 4°C/37°C, not significant (NS). (E) Values for AGS cells were incubated with IRDye800-labeled vesicles for 20 min at 37°C. Cells treated with buffer (Ves) were set at 100% and compared to values for cells exposed to reducing conditions (Intern. ves.). The average relative uptake of vesicles was 49%. Only 2% of lysed vesicles were internalized. All experiments were performed in triplicate (n = 4). P was 0.001.
Quantification of internalized substances (qIS) to study host cell entry of bacterial vesicles.
To simultaneously quantify the cellular internalization of vesicles in a large number of cells, we labeled the vesicles with a near-infrared dye (IRDye800) that contains a cleavable linker (Fig. 1C, inset). The advantages of using a dye that is visible in the near-infrared spectrum are low background autofluorescence and light scattering as well as a higher signal-to-noise ratio. Here, cells are seeded in a multiwell plate and incubated with IRDye800-labeled vesicles. After treatment with MESNA (the reducing agent), the amount of internalized vesicles is quantified by measuring the fluorescence of the internalized vesicles at 800 nm relative to the fluorescence of the stained cells at 700 nm. We named this method for simultaneously quantifying cell-internalized IRDye800-labeled substances in a large number of cells quantification of internalized substances (qIS).
Endocytosis of transferrin (Tfn) is dependent on Tfn receptors that are specifically internalized via CME and is a well-defined process (29). Therefore, uptake of Tfn is often used as a standard assay for CME and was also used here as a positive control for the qIS assay. First, we wanted to test the efficiency of the reducing agent to cleave the linker and remove the dye. Tfn labeled with the IRDye800 was incubated with AGS cells for 30 min at 4°C. At this temperature, Tfn binds the Tfn receptors on the cell surface but is not internalized. After repeated washing and treatment with either MESNA or buffer, cells were fixed and stained and the fluorescence was measured. The results of this experiment showed that MESNA cleaved 65% of the IRDye800 linker from the Tfn that was bound to the cell surface (Fig. 1D). Next we tested how much of the Tfn was internalized and thus protected from the reducing agent. In pulse-chase experiments, Tfn was first bound to the cell surface at 4°C, internalized at 37°C for 20 min, and then treated as described above for the 4°C samples. We found that the majority of the bound Tfn was internalized at 37°C (Fig. 1D). In conclusion, MESNA removed the IRDye800 from surface-associated noninternalized Tfn bound to the plasma membrane but not from internalized Tfn. Thus, the qIS assay constitutes a general approach to efficiently quantify internalized material in a large number of cells and to obtain statistically significant results that complement conventional microscopy methods.
Endocytic processes are generally fast, and we performed our quantitative uptake studies for 20 min. Quantification of the internalized H. pylori vesicles with the qIS assay showed that 49% of the vesicles were internalized after 20 min (Fig. 1E). To confirm that the signal from the qIS assay corresponds to the internalization of only intact vesicles and not individual vesicle components, we determined whether lysed vesicles were taken up. Importantly, only intact vesicles were internalized (Fig. 1E), and components originating from lysed vesicles were not detected in the qIS assay, suggesting that vesicles need to be intact to be internalized by host cells. To confirm the ability of the reducing agent to cleave the linker on vesicles labeled with the IRDye800, vesicles were treated either with the reducing agent or with buffer. This showed that the fluorescence was reduced from vesicles treated with MESNA but not from buffer-treated vesicles (see Fig. S3 in the supplemental material).
The number of internalized vesicles increases with time.
A series of studies have described an increase in vesicle internalization with time (14, 16, 21, 28). We followed H. pylori vesicle host cell entry from 30 min to 6 h and found that uptake of vesicles indeed increased over time (Fig. 2A). At longer time points, confocal microscopy revealed that both unlabeled and labeled vesicles aggregated on the surfaces and edges of the cells (Fig. 2B; also, see Fig. S1A in the supplemental material). This phenomenon has, to our knowledge, not been reported elsewhere and prompted us to restrict our uptake studies to a maximum of 6 h. Computer-based analysis of three-dimensional (3D) confocal fluorescent micrographs at 1 h and 3 h also confirmed the increase in vesicle internalization with time (Fig. 2C). Although the number of internalized vesicles varied greatly between cells, detailed analysis revealed a higher number of internalized vesicles per cell at 3 h than 1 h (8.0 vesicles/cell versus 5.5 vesicles/cell, respectively). Also, the size of the internalized structures (i.e., vesicles) differed within the cells (Fig. 2C, inset).
FIG 2 .
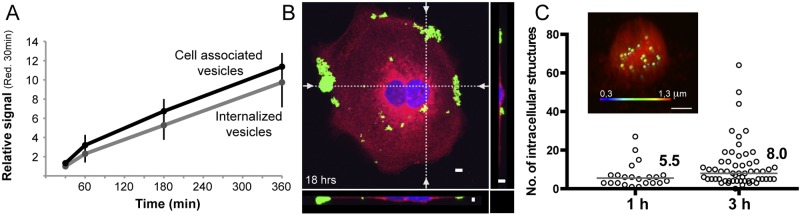
Uptake of H. pylori vesicles increases over time. (A) Vesicle internalization and vesicles associated with cells (both bound and internalized vesicles) were analyzed at 30 min, 1 h, 3 h, and 6 h with the qIS assay. All values are related to the signal seen at 30 min after exposure to the reducing agent (n = 3). (B) 3D confocal fluorescent micrographs of H. pylori vesicles incubated with AGS cells for 18 h. Vesicles were detected with Strp-FITC (green) and found to be aggregated to the edges and surfaces of AGS cells. The cell plasma membrane was stained with CellMask (red), and the nuclei were stained with DAPI (blue). The dotted lines in the merged 3D confocal micrograph indicate the optical sections (z plane) that are visualized at the bottom and to the right. Scale bar = 5 µm. (C) Calculation of the average number of vesicles per cell. 3D micrographs of intracellular vesicles at 1 and 3 h (under reducing conditions) were analyzed with Imaris software, and the number of vesicles per cell is displayed. At 1 h, the median was 5.5 vesicles/cell for 22 cells analyzed, and at 3 h, the median was 8.0 vesicles/cell for 57 cells analyzed. P was 0.0194. (Inset) 3D confocal micrograph of a cell analyzed with Imaris software. The fluorescent vesicles of different sizes are displayed in different colors (blue = 0.3 µm; red = 1.3 µm).
H. pylori vesicles are transported intracellularly through the endocytic pathway.
We used specific markers to analyze intracellular trafficking of internalized vesicles, specifically, anti-EEA-1 for early endosomes and anti-LAMP-1 for lysosomes. A single microscopy image represents a snapshot of a transient state in the fast endocytic process, and therefore, only a few colocalizations were expected to be detected. In fluorescent confocal micrographs, we identified colocalization of both of these markers with vesicles (Fig. 3A and B). H. pylori vesicles colocalizing with EEA-1 were also found in MKN45 and KatoIII cells, which are two other gastric epithelial cell lines (data not shown). We also used markers for the retrograde pathway, but after 3 h, no colocalization between H. pylori vesicles and markers for the Golgi apparatus (anti-AP-1) or endoplasmic reticulum (anti-calnexin and anti-MHC-1) was observed (data not shown). Thus, the presence of vesicles in early endosomes and lysosomes shows that at least a subset of H. pylori vesicles are transported through the endocytic pathway.
FIG 3 .
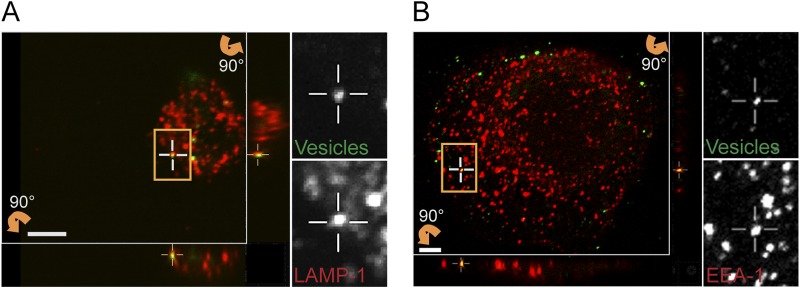
Following endocytosis, H. pylori vesicles are trafficked to endosomes and lysosomes. Sections of 3D confocal fluorescent images show colocalization of H. pylori vesicles with markers for intracellular trafficking. Vesicles were visualized with Strp-FITC (green), and markers for intracellular trafficking were detected with secondary Alexa antibodies (red). (A) Lysosomes (anti-LAMP-1), 3 h. (B) Early endosomes (anti-EEA-1), 30 min. The boxed regions with colocalizing H. pylori vesicles are enlarged, and the green and red channels are visualized separately. Vertical (z) optical sections (x-z and y-z planes) are shown at the bottom and to the right of the large image. Scale bar = 5 µm.
H. pylori vesicles are internalized via clathrin- and dynamin-dependent endocytosis.
Drugs are an often-used approach to inhibit cellular functions such as endocytic pathways. Therefore, AGS cells were treated with chlorpromazine to inhibit CME or with Dyngo4a to target all three isoforms of dynamin (13). Quantification with the qIS assay revealed that chlorpromazine caused a 40% decrease in vesicle internalization compared to internalization in untreated cells (Fig. 4A). Our results confirm the previous finding that H. pylori vesicles can be internalized via CME (21). Treatment with Dyngo4a revealed a dose-dependent decrease in vesicle internalization after pretreatment with Dyngo4a and an 80% decrease in vesicle internalization with 30 mM Dyngo4a (Fig. 4B). We used live/dead staining to confirm that neither of these drugs has toxic effects on the AGS cells (see Fig. S4 in the supplemental material), and we used Tfn as a control for internalization by CME (Fig. 4A and B). Chlorpromazine showed a greater effect on the uptake of Tfn than Dyngo4a. However, in contrast to Tfn, a greater inhibition of vesicle uptake occurred upon treatment with Dyngo4a. Therefore, we argue that in addition to CME, other dynamin-dependent pathways are likely to be involved in vesicle internalization.
FIG 4 .

Inhibitors of dynamin and clathrin-mediated endocytosis reduce uptake of H. pylori vesicles. (A) H. pylori vesicles were incubated with chlorpromazine-treated AGS cells for 20 min. Disrupting CME decreased vesicle internalization to 61% compared to untreated cells (100%). Internalization of Tfn decreased to 52%. All experiments were performed in triplicate (n = 3). Statistical significance was as follows: for vesicles (Ves), P = 0.0039; for Tfn, P = 0.0313. (B) H. pylori vesicles were incubated for 20 min with AGS cells exposed to 7.5 µM, 15 µM, and 30 µM Dyngo4a. Inhibition of dynamin activity by Dygno4a decreased vesicle internalization to 45%, 31%, and 20% compared to untreated cells (100%). Internalization of Tfn decreased to 74%, 66%, and 62%. All experiments were performed in triplicate (n = 3). Statistical significance was as follows: for 7.5 µM, Ves P = 0.0039 and Tfn P = 0.0039; for 15 µM, Ves P = 0.0039 and Tfn P = 0.0039; for 30 µM, Ves P = 0.0039 and Tfn P = 0.0039. For comparison between chlorpromazine- and Dyngo4a-treated cells, two-way ANOVA was performed on 2×-square root-transformed data of values relative to the control; for interaction, P is 0.0039, and for Tukey’s multiple-comparison test, P is <0.05. (C and D) Sections of 3D confocal fluorescent images show colocalization of H. pylori vesicles with different endocytic markers after 30 min. Vesicles were visualized by Strp-FITC (green), and the endocytic markers were detected with secondary Alexa antibodies (red). (C) Clathrin detected with anti-clathrin (heavy chain). (D) Dynamin detected with anti-dynamin II. The boxed regions with colocalizing H. pylori vesicles are enlarged, and the green and red channels are visualized separately. Vertical (z) optical sections (x-z and y-z planes) are shown at the bottom and to the right of the large image. Scale bar = 5 µm.
For a more detailed understanding of the molecular processes involved in vesicle uptake, we continued with colocalization analysis and included markers for both clathrin and dynamin II. We found H. pylori to colocalize with dynamin II and clathrin in AGS cells (Fig. 4C and D) as well as in KatoIII and MKN45 cells (data not shown).
siRNA knockdown of AP-2 and dynamin II reduces H. pylori vesicle uptake.
Neither chlorpromazine nor Dyngo4A had major cytotoxic effects on the AGS cells. Still, a disadvantage with chemical drugs is that they might have unspecific effects, a fact that is often overlooked. As a complement to our drug inhibition experiments, we decided to include small interfering RNA (siRNA) and specifically knock down individual target proteins. For this we selected AP-2, which acts as a major hub during formation of clathrin-coated vesicles (9), and dynamin II. As in previous experiments, Tfn was included as a control. AP-2 and dynamin II were knocked down in AGS cells, and uptake of vesicles and Tfn was quantified with the qIS assay. Knockdown of the μ subunit of AP-2 inhibited uptake of vesicles by 37% and uptake of Tfn by 65% (Fig. 5A). Knockdown of dynamin II reduced uptake of vesicles by 20% and Tfn by 42%. We found a synergistic effect on vesicle uptake in double knockdowns of AP-2 and dynamin II, where vesicle uptake was reduced by 54% and uptake of Tfn was reduced by 71%. The effect on expression of the respective knockdown was analyzed by Western blotting (Fig. 5B). It has previously been shown that to efficiently inhibit CME through knockdown of dynamin II, the knockdown efficiency needs to be above 95% (30). Our knockdown efficiency of dynamin II was only 85%, and this could explain why dynamin II knockdown did not inhibit Tfn and vesicle uptake to a larger extent. Our results clearly show that both AP-2 and dynamin II play an important role in cellular uptake of H. pylori vesicles.
FIG 5 .
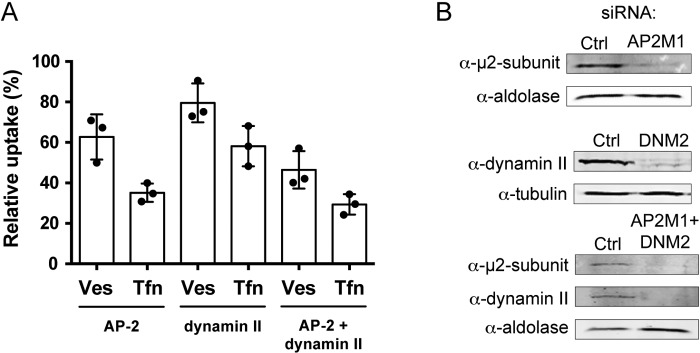
Cells depleted of AP-2 and dynamin II show reduced uptake of H. pylori vesicles. (A) H. pylori vesicles were incubated with siRNA-transfected AGS cells for 20 min. In comparison to vesicle uptake in AGS cells transfected with negative siRNA (100%), vesicle internalization was affected as follows in the knockdowns: AP-2, 63%; dynamin II, 80%; AP-2 plus dynamin II, 46%. In comparison to Tfn uptake in AGS cells transfected with negative siRNA (100%), Tfn internalization was affected as follows in the knockdowns: AP-2, 35%; dynamin II, 58%; AP-2 plus dynamin II, 29%. All experiments were performed in triplicate (n = 3). Statistical significance was as follows: with AP-2, P for Ves was 0.0039 and P for Tfn was 0.0039; for dynamin II, P for Ves was 0.0039 and P for Tfn was 0.0039); for AP-2 plus dynamin II, P for Ves was 0.0039 and P for Tfn was 0.0039). Ves, vesicles; Tfn, transferrin. (B) Western blot analysis to measure knockdown efficiency in AGS cells. Knockdown efficiency was as follows: for AP-2 (AP2M1) (m2 subunit), 81%; for dynamin II (DNM2), 84%; for AP-2 (m2 subunit) plus dynamin II, 89% and 91%. Tubulin or aldolase was used as the loading control to correlate the amount of protein in each sample.
Knockdown of the CLIC/GEEC protein GRAF-1 increases uptake of H. pylori vesicles.
In addition to CME, dynamin has been implicated in caveola-mediated endocytosis (8, 10, 11). To further study if caveolae are a possible route for vesicle entry into host cells, we continued to use the siRNA assay. Cavin proteins function together with caveolins to regulate the formation of caveolae (11). When we knocked down cavin-1 in AGS cells, we saw only a slight and insignificant decrease in uptake of H. pylori vesicles (Fig. 6A). However, when we analyzed colocalization of H. pylori vesicles with caveolin-1, we found vesicles colocalizing with caveolin-1 in AGS cells (Fig. 6B) as well as in KatoIII cells and in 3T3-L1 adipocytes (data not shown). We had not expected to find any cavin-1-mediated effect on uptake of Tfn, which we did. In conclusion, although caveolae might be a possible route for vesicle uptake, they cannot be considered a major route for uptake of H. pylori vesicles.
FIG 6 .

Caveolae and CLICs in H. pylori vesicle internalization. (A) H. pylori vesicles were incubated with siRNA-transfected AGS cells for 20 min. In comparison to vesicle uptake in AGS cells transfected with negative siRNA (100%), vesicle internalization was reduced 95% upon cavin-1 knockdown. In comparison to Tfn uptake in AGS cells transfected with negative siRNA (100%), Tfn internalization was reduced to 73% by cavin-1 knockdown. All experiments were performed in triplicate (n = 3). Statistical significance was as follows: for cavin-1, Ves values were NS and P for Tfn was 0.0039. (B) Sections of 3D confocal fluorescent images show colocalization of H. pylori vesicles with caveolin-1 after 30 min. Vesicles were visualized with Strp-FITC (green), and anti-caveolin-1 was detected with secondary Alexa antibodies (red). The boxed regions with colocalizing H. pylori vesicles are enlarged and visualized separately for the green and red channels. Vertical (z) optical sections (x-z and y-z planes) are shown at the bottom and to the right of the large image. Scale bar = 5 µm. (C) H. pylori vesicles were incubated with siRNA-transfected AGS cells for 20 min. In comparison to vesicle uptake in AGS cells transfected with negative siRNA (100%), vesicle internalization was increased to 126% by GRAF-1 knockdown. In comparison to Tfn uptake in AGS cells transfected with negative siRNA (100%), Tfn internalization was reduced to 78% by GRAF-1 knockdown. All experiments were performed in triplicate (n = 3). Statistical significance was as follows: with GRAF-1, P for Ves was 0.0039 and P for Tfn was 0.0039). Ves, vesicles; Tfn, transferrin. (D) Western blot analysis showing a 39% knockdown efficiency of cavin-1 in AGS cells. GRAF-1 knockdown was confirmed by immunoprecipitation and Western blotting. Tubulin was used as the loading control to correlate the protein amount from each sample.
Next, we analyzed an additional endocytic pathway and its role in the uptake of H. pylori vesicles. The GTPase regulator focal adhesion kinase 1 (GRAF-1) is part of an alternative clathrin-independent endocytic pathway called the CLIC/GEEC pathway that is important for fluid-phase uptake (31, 32). After knockdown of GRAF-1 in AGS cells, we saw a significant 26% increase in vesicle internalization (Fig. 6C). In contrast, uptake of Tfn decreased in the GRAF-1 knockdown (Fig. 6C). Therefore, the increased uptake of H. pylori vesicles probably occurs via a different mechanism than for Tfn. The effect on expression of cavin-1 after knockdown was analyzed by Western blotting, and expression of GRAF-1 after knockdown was analyzed by immunoprecipitation followed by Western blotting (Fig. 6D).
Cholesterol is important for H. pylori vesicle internalization.
H. pylori vesicles did not adhere to the AGS cell surfaces at temperatures below 18°C. This was seen in both the qIS assay and in microscopy studies (data not shown) and suggests the importance of membrane fluidity and, therefore, cholesterol in H. pylori vesicle adherence. Previous studies suggested that cellular uptake of bacterial vesicles occurs via lipid rafts (14–16). Methyl-β-cyclodextrin (MβCD) depletes cholesterol from the cell’s plasma membrane and disrupts lipid rafts. With the qIS assay, we found that uptake of vesicles decreased in AGS cells treated with 10 mM MβCD (Fig. 7A). We compared the effects on vesicle uptake into cells pretreated with MβCD and into cells where MβCD was still present during the internalization process. A clear difference was detected in the amount of vesicles internalized, and the internalization was reduced to 62% and 41% for the pretreatment and concurrent MβCD treatments, respectively. This small difference is likely due to delivery of endogenous cholesterol to the cell surface following the removal of cell membrane cholesterol by MβCD during the 20 min of vesicle uptake. Treatment of AGS cells with 4 mM MβCD did not affect vesicle internalization, which is in agreement with a previous study of H. pylori vesicle uptake (21). High concentrations of MβCD have been reported to affect CME internalization (28, 33–35), but we did not detect a decrease in Tfn internalization with either of the MβCD concentrations used (Fig. 7A). Therefore, we conclude that the decreased uptake of vesicles that we observed in the presence of 10 mM MβCD was not the result of disrupted CME.
FIG 7 .

Cell membrane cholesterol levels are important for H. pylori vesicle uptake. (A) H. pylori vesicles were incubated with MβCD-treated AGS cells for 20 min. Vesicle internalization decreased to 62% after pretreatment and to 41% when 10 mM MβCD was present during uptake compared to untreated cells (100%). Treatment of AGS cells with 4 mM MβCD did not affect vesicle internalization. Internalization of Tfn was not affected by MβCD. All experiments were performed in triplicate (n = 2). Statistical significance was as follows: with 10 mM MβCD, P for Ves was 0.0313 and Tfn values were NS; with 10 mM MβCD pretreatment, P for Ves was 0.0313 and Tfn values were NS; with 4 mM MβCD, Ves values and Tfn values were NS. (B) H. pylori vesicles were incubated with filipin-treated AGS cells for 20 min. Vesicle internalization was not affected (105%) relative to untreated cells (100%). Internalization of Tfn was not affected. For Ves, n = 3 (experiments were performed in triplicate); values were NS; for Tfn, n = 2 (experiments were performed in triplicate); values were NS. (C) Electron micrographs of untreated and MβCD-treated H. pylori vesicles show that treated vesicles are intact and have the same morphology as untreated vesicles. Scale bar = 0.5 µm. (D) Biotin linker-labeled vesicles were treated with MβCD or PBS and then incubated with AGS cells for 20 min at 37°C. Reducing conditions allowed detection of intracellular vesicles after staining with Strp-FITC and microscopy analysis of 100 AGS cells. Counting the number of intracellular vesicles revealed no difference in cholesterol-dependent vesicle uptake.
Filipin is an additional drug that affects the properties of cholesterol-rich membrane domains by sequestering cholesterol into large aggregates in the plasma membrane. Treating AGS cells with filipin did not decrease vesicle or Tfn internalization (Fig. 7B). To confirm the ability of filipin to sequester cholesterol in AGS cells, we used cholera toxin B (CtxB) as a control, because internalization of this molecule is dependent on lipid rafts. We saw a decrease in CtxB internalization that correlated with the filipin concentration (see Fig. S5 in the supplemental material). Fluorescent staining of F-actin, AP-2, and caveolin-1 in AGS cells after drug treatment with MβCD and filipin showed cells with intact AP-2 structures but disrupted caveolar structures (see Fig. S6). Taken together, these data confirm that cholesterol plays a role in H. pylori vesicle adherence and internalization. Although uptake via caveolae is possible, because we found vesicles to colocalize with caveolin, this does not appear to be the main cellular entrance for H. pylori vesicles, because neither filipin treatment nor cavin-1 knockdown significantly affected vesicle internalization.
H. pylori does not have an enzyme to carry out the de novo synthesis of cholesterol, and the bacteria take up cholesterol from their surroundings (36). We reported previously that cholesterol accounts for approximately 10% of the total phospholipid content in H. pylori vesicles (26). We speculated that another reason for the difference seen in vesicle internalization between AGS cells pretreated with MβCD and those where the drug was present during vesicle uptake could be cholesterol depletion in the vesicles. To test this, we treated H. pylori vesicles with MβCD in a test tube, and this did not affect vesicle integrity, as visualized in electron micrographs (Fig. 7C). We also incubated AGS cells with H. pylori vesicles in the presence of either MβCD or buffer and manually counted the number of intracellular vesicles in fluorescent micrographs. We saw no difference in the number of intracellular MβCD-treated or untreated vesicles (Fig. 7D). These results suggest that the cholesterol present in H. pylori vesicles does not affect the uptake of vesicles.
In summary, our results suggest that the host cellular cholesterol level, but not the cholesterol present in the vesicles, affects the uptake of H. pylori vesicles and that the host cell membrane fluidity affects adhesion of vesicles to the host cell surface.
DISCUSSION
Specific bacterial virulence factor-host receptor interactions often require close contact between the bacterium and the host cell. The surfaces of the vesicles resemble the bacterial outer membrane, thus providing a wide range of targets for interacting with the host cell surface. A number of reports have described several pathways that can be exploited for uptake of bacterial vesicles (14–21); it has been proposed that H. pylori vesicles are taken up via CME, and whether lipid rafts might play a role in this process has been discussed (21, 22). Here we show that vesicles from the same H. pylori strain are internalized by routes that include both CME and clathrin-independent pathways (Fig. 8).
FIG 8 .

Model depicting endocytic pathways for host cellular uptake of H. pylori vesicles. Shed vesicles constitute a heterogeneous population, illustrated here by their different sizes and by the use of different colors to show their different composition with respect to protein and lipid content. The dominating pathway for uptake of H. pylori vesicles is via CME. Since the local lipid environment and clustering of receptors and lipids in membrane microdomains influence the availability of host cell receptors, certain host membrane compositions will promote internalization of H. pylori vesicles via clathrin-independent endocytic pathways. We have shown that the membrane dynamics of the host cell membrane affect adhesion of vesicles to the cell surface and internalization. Thus, a combination of the pleiomorphic character of the vesicles and the local environment of the host cell membrane together influences how H. pylori vesicles are internalized.
Using fluorescent confocal microscopy, we found that internalized vesicles colocalized with markers for early endosomes (EEA-1) and lysosomes (LAMP-1), which suggests that at least a subset of H. pylori vesicles are transported through the endocytic pathway. The same route has been reported for vesicles from P. gingivalis and enterohemorrhagic E. coli (EHEC), which are also sorted to lysosomes (14, 20). We have not yet investigated the intracellular fate of H. pylori vesicles associated with the endosomes in terms of associations with sorting endosomes or recycling endosomes. H. pylori vesicles did not colocalize with markers for the retrograde pathway, which is in contrast to vesicles from ETEC and P. aeruginosa, which are distributed to nonacidified compartments (16, 28). Thus, vesicles from different species are clearly distributed to different locations within the host cell.
Internalization of H. pylori vesicles has previously been suggested to occur partly via CME (21) in a manner similar to that observed for Brucella abortus vesicles (37). With confocal microscopy, we found vesicles to colocalize with markers for both clathrin and dynamin II, and in further experiments where we specifically knocked down AP-2 and dynamin II with RNA interference, we confirmed that CME is a major route for uptake of vesicles and that dynamin II influences this uptake. Treatment with Dyngo4a, which targets all three isoforms of dynamin, decreased vesicle uptake compared to that with Tfn to a greater extent than treatment with chlorpromazine. Because dynamin, in addition to CME, has been suggested to be involved in clathrin-independent endocytosis, we suggest that H. pylori vesicles are internalized via both CME and clathrin-independent endocytosis (34, 38).
Dynamin has been shown to be involved in caveola internalization and RhoA-dependent endocytosis but not the CLIC/GEEC pathway (10). Clathrin-independent endocytosis appears to be regulated via a variety of cellular signaling events and processes that affect the plasma membrane organization at the cell surface (39). We report here that H. pylori vesicles colocalize with caveolin-1, a marker of caveolae, and colocalization with caveolin-1 was previously observed with vesicles from ETEC and Haemophilus influenzae (16, 40). However, knockdown of cavin-1, which disrupts caveolae (41), did not significantly affect internalization of vesicles in our study. We suggest that H. pylori vesicles can be enriched at, and internalized by, caveolae but that this is not the major route for uptake. This is consistent with the static and slow endocytic behavior of caveolae (42). GRAF-1 regulates fluid uptake via CLIC/GEEC-mediated endocytosis, and knockdown of GRAF-1 decreases fluid uptake (31). Here we show that depletion of GRAF-1 increased the internalization of vesicles while uptake of Tfn decreased. This suggests that distortion of membrane organization and cell surface dynamics via GRAF-1 depletion (43) positively influenced the efficiency of vesicle internalization. The H. pylori VacA cytotoxin is endocytosed via the CLIC/GEEC pathway (44), and vesicles carrying the VacA toxin have been shown to have an improved association with host cells and an increased uptake after chlorpromazine treatment compared to vesicles lacking VacA (21). In addition to VacA, we have shown that other virulence-associated factors that cause host cellular responses are present on the surfaces of H. pylori vesicles (26). It is tempting to speculate that some of the vesicle-associated proteins, via specific binding to cognate receptors and host cellular signaling, might affect the membrane dynamics, for example, through lipid microdomains, and thus affect uptake of vesicles via clathrin-independent pathways.
It has been shown that the presentation and availability of cell surface receptors are influenced by the local lipid environment and the clustering of receptors and lipids in membrane microdomains (42). Cholesterol induces the formation of such microdomains, which also affects the route and efficiency of uptake of both lipids and protein receptors. Targeting cellular cholesterol levels with chemical drugs like MβCD and filipin has been shown previously to decrease the level of internalization of bacterial vesicles via lipid rafts (16–18, 22, 28). However, contradictory results concerning an effect of treatment with MβCD on AGS cells in inhibiting H. pylori vesicle entry have previously been reported (21, 22). We observed that although sequestering of cholesterol by filipin did not affect uptake, removal of cholesterol from the plasma membrane diminished vesicle internalization. Such divergent effects have also been described for the uptake of P. aeruginosa vesicles (28). We propose that these results depend on the different chemical properties of MβCD and filipin and the way that they affect cholesterol. The binding and sorting of vesicles at the host cell surface and the way that they are incorporated into endocytic carriers appear to be dependent on cholesterol. Importantly, we did not see a decrease in Tfn internalization with either of the MβCD concentrations used. Thus, the observed decrease in vesicle internalization was not due to a general effect of MβCD on CME, as has been argued elsewhere (21, 28, 34, 35).
In this paper, we have shown that the major pathway for internalization of H. pylori vesicles is via CME. We also found that clathrin-independent endocytic pathways facilitate uptake of vesicles. These pathways are dependent on the local lipid composition and clustering of receptors to create invaginations in the host cell membrane and facilitate endocytosis. Most interestingly, depletion of GRAF-1, which distorts membrane organization, resulted in increased uptake of H. pylori vesicles. Detailed understanding of the mechanisms that operate during clathrin-independent endocytosis is still elusive. Based on our results, we suggest that yet-unidentified clathrin-independent pathways play an import role in H. pylori vesicle internalization (Fig. 8). Moreover, bacterial vesicles constitute a heterogeneous population with respect to protein and lipid content and are known to cause a series of host cellular effects. It is likely that specific interactions between vesicle and host cell receptors lead to signaling events within the host cell that subsequently modify the host cell membrane composition to influence vesicle uptake.
MATERIALS AND METHODS
Bacterial strains, growth conditions, and isolation of membrane vesicle.
H. pylori strain P12 (45) was grown as described previously (26). H. pylori vesicles were isolated as described in reference 26. Purified vesicles were resolved in phosphate-buffered saline (PBS; 5 mM KH2PO4, 20 mM K2HPO4, and 85 mM NaCl) and filtered through 800-nm and 400-nm filters in a miniextruder (Avanti Polar Lipids, USA) and stored at −80°C until used. Quantification of the vesicle protein concentration was performed with the Qubit system (Life Technologies, USA) according to the manufacturer’s instructions. Vesicles were disrupted with a Branson Sonifier 450 analog ultrasonic homogenizer (Emerson) set at a constant sound and with a strength of 1. Vesicles were kept on ice, and the device was run for 6 cycles of 10 s on and 20 s off.
Cell culture, siRNA knockdown, and chemical inhibition.
The human gastric adenocarcinoma cell line AGS (ATCC 1739) was cultured at 37°C with 5% CO2 in F-12K nutrient mixture (Life Technologies, USA) supplemented with 10% fetal bovine serum (FBS) (Life Technologies) and 1% penicillin-streptomycin-glutamine supplement (PEST) (Life Technologies). PEST was removed during cell treatments and vesicle internalization assays. MKN45 cells (JCRB0254) were grown in RPMI 1640, KatoIII cells (ATCC HTB-103) were grown in Iscove’s Modified Dulbecco Medium (IMDM), and 3T3-L1 BHK cells (ATCC CL-173) were grown in Dulbecco’s modified Eagle medium (DMEM). All media were supplemented with 10% FBS.
AGS cells were transfected with human-specific stealth siRNA using Lipofectamine 2000 (Life Technologies) according to the manufacturer’s instructions. Optimal knockdown was achieved after 3 to 4 days and was identified by confirming the behavior of Tfn in qIS assays. Stealth siRNA negative-control medium GC duplex (Life Technologies) was used as the control. The siRNA sequences were as follows: AP-2 μ-subunit siRNA, UAAGCUCAAACUCUCCAUCUGGCGG; dynamin II siRNA, CCAGAUUCUUCUGCUGAUCGACAUU; GRAF-1 siRNA, CCACUCAUGAUGUACCAGUUUCAAA; clathrin siRNA, GAGUGCUUUGGAGCUUGUCUGUUUA; cavin-1 siRNA, GCCGCAACUUUAAAGUCAUGAUCUA. The viability of siRNA-treated cells was analyzed visually.
Chemical inhibitors were added to AGS cells prior to vesicle incubation. Dyngo4a (Abcam, United Kingdom) in F-12K (−FBS) at 7.5 µM, 15 µM, and 30 µM was added to the cells 30 min before addition of vesicles in drug-free medium. Chlorpromazine (Sigma-Aldrich) in F-12K (+FBS) was added at 40 µM for 30 min before vesicle addition. MβCD (Sigma-Aldrich) in F-12K (+FBS) was added at 4 mM or 10 mM for 15 min before vesicle addition both with and without MβCD present. Filipin (Sigma-Aldrich) at 2 µg/ml and 5 µg/ml in F-12K (−FBS) was added for 1 h before addition of vesicles in drug-free medium.
Western blotting and immunoprecipitation.
The level of knockdown of the target proteins was determined by Western blotting. The primary antibodies used were as follows: for AP2, mouse anti-AP50/μ2 (611351) (BD Biosciences, USA); for aldolase, goat anti-aldolase (AB1809) (Millipore, USA); for cavin-1, rabbit anti-PTRF (ab48824) (Abcam, United Kingdom); for dynamin-II, rabbit anti-dynamin-II (PA1-661) (Thermo Scientific); for GRAF-1, rabbit anti-GRAF-1 (Ra83) (31); and for tubulin, mouse anti-tubulin (T5168) (Sigma-Aldrich). The secondary antibodies used were donkey anti-mouse, donkey anti-goat, and donkey anti-rabbit IgG coupled to IRDye 680LT or 800CW (Li-Cor Biosciences, USA) or goat anti-rabbit IgG conjugated to horseradish peroxidase (HRP) (Agrisera, Sweden). Quantification of knockdown efficiency was analyzed with the Image Studio software (Li-Cor Biosciences).
GRAF-1 immunoprecipitation was performed essentially as described in reference 43, with a slight modification. Cell lysates were centrifuged for 10 min, and the GRAF-1 antibody was coupled to protein G beads instead of protein A.
Labeling of H. pylori vesicles and Tfn.
Vesicles were labeled for 30 min at room temperature (RT) with a 10 M excess of IRDye800CW-disulfide-N-hydroxysulfosuccinimide (SS-NHS) ester (Li-Cor Biosciences) or a 20 M excess of EZ-Link sulfo-NHS-SS-biotin (Thermo Scientific). Nonreacted linker was quenched by washing with 50 mM Tris (pH 8.0) for 20 min followed by centrifugation at 19,000 × g at 4°C. Vesicles were washed and filtered as described above. Human Tfn (Sigma-Aldrich) was labeled for 2 h at RT with a 6 M excess of IRDye800CW-SS-NHS ester in 0.1 M NaHCO3–PBS using gentle rocking. Nonreacted dye was separated using an Illustra NAP-5 column (GE Healthcare, United Kingdom) and eluted with PBS.
Internalization studies—quantification of internalized substances (qIS).
A total of 1.5 × 10⁵ AGS cells were seeded in 24-well plates (Sarstedt, Germany) 2 days before qIS analysis to achieve 90 to 100% confluence. IRDye800-labeled vesicles (3.5 to 5 ng/µl) suspended in F-12K medium (+FBS) were incubated with AGS cells at 37°C for 20 min. The cell-impermeative reducing agent sodium 2-mercaptoethanesulfonate (MESNA) (Sigma-Aldrich), in a buffer of 100 mM NaCl, 2.5 mM CaCl2, and 50 mM Tris (pH 8.7), was added at a concentration of 50 mM to cleave the disulfide bond in the linker of noninternalized vesicles. After reduction (twice for 10 min each time) and repeated washing on ice, samples were fixed with 3% paraformaldehyde (PFA) (Sigma-Aldrich) for 15 min at RT. For internalization studies using siRNA-treated cells, the samples were washed twice in 37°C PBS directly after uptake. The cells were fixated in 3% PFA for 10 min at 37°C, washed three times in PBS, and reduced with 50 mM MESNA twice for 20 min each time at RT. For all internalization experiments, cells were stained with a far-red fluorescent DNA dye (DRAQ5 [BioStatus, United Kingdom]) for normalization of the number of cells in each well. Fluorescence at 800 nm (vesicles) and 700 nm (cells) was measured with the Odyssey Sa infrared imaging system (Li-Cor Biosciences). Image Studio software 2 (Li-Cor Biosciences) was used for image analysis. The relative trim-mean signal (this removes the highest and lowest 5% of the signal and can account for dust, aggregates, or other disturbances) between 800 nm and 700 nm was used to quantify the amount of intracellular vesicles. Graphical presentation of the data was performed with Excel (Microsoft) and Prism 6 (GraphPad Software, USA).
Drug treatment of vesicles.
Biotin-linker labeled vesicles (3.5 ng/µl) were treated with 10 mM MβCD–PBS or with PBS alone for 30 min at 37°C. MβCD was removed through centrifugation for 1 h at 120,000 × g at 4°C. Vesicles were additionally washed with PBS by centrifugation for 20 min at 19,000 × g at 4°C and filtered through a 400-nm filter.
Immunofluorescence microscopy.
For immunofluorescence studies, AGS cells were seeded to achieve 20% confluence. After uptake at 37°C of FITC-labeled, native, and biotin-linker labeled vesicles (1.64 ng/µl), samples were washed three times with PBS and treated with either buffer alone or 50 mM MESNA three times for 10 min each time on ice. After repeated washing, cells were fixed with 3% PFA for 15 min at RT and blocked in 5% goat serum–0.05% saponin–PBS for 15 min at RT. Native vesicles were detected with biotinylated Leb receptor glycoconjugate (Isosep AB, Tullinge, Sweden) and Strp-FITC at a 1:300 dilution (BD Biosciences, USA). AGS cells were visualized through staining of F-actin with rhodamine-phalloidin at a 1:700 dilution (Life Technologies), the plasma membrane with CellMask orange (Life Technologies), and nucleic acids with 4ʹ,6-diamidino-2-phenylindole (DAPI) (Life Technologies). Staining for colocalization studies was performed with the desired primary and secondary antibodies in 1% goat serum–0.05% saponin–PBS at RT with repeated washings in between. The following antibodies were used: for dynamin, mouse anti-dynamin II (Hudy), 1:300 (BD Biosciences/Upstate, US); for clathrin, mouse anti-clathrin heavy chain, 1:100 (Thermo, Fisher Scientific, USA); for caveolin, rabbit anti-caveolin-1 (ab2910), 1,700 (Abcam); for early endosome, mouse anti-EEA1 (ab2900), 1,300 (BD Biosciences, USA); for lysosome, mouse anti-LAMP1 (TM-BB6), 1,100 (Sven Carlsson, Umeå University, Sweden); for AP-1, mouse anti-AP-1 (A4200), 1,200 (Sigma-Aldrich); for calnexin, mouse anti-calnexin (AF-18) (ab31290), 1,100 (Abcam); and for major histocompatibility complex 1, mouse anti-MHC-1 (MS-1218), 1,300 (Thermo, Fisher Scientific). All secondary antibodies were conjugated to Alexa Fluor 488, 568, or 647 (Life Technologies). The numbers of z-stacks screened for colocalization with H. pylori vesicles were as follows: AP-1, 6; calnexin, 12; MHC-1, 5; and TGN45, 6.
Epifluorescence images were taken with a Zeiss Axio Imager Z1 system with AxioVision software (Zeiss, Germany). Confocal fluorescence images were obtained as described in reference 46. Image analysis for quantification of intracellular vesicles was performed with Imaris software (Bitplane, Switzerland).
Electron micrographs.
Electron microscopy was performed as previously described (26).
Statistical analysis.
Statistical data analysis was performed with Prism 6 (Graph Pad Software). The original signal received from each well from every experiment was analyzed with the Wilcoxon matched-pairs signed-rank test and presented as the mean ± standard deviation. The number of intracellular vesicles calculated in micrographs was analyzed with the Mann-Whitney U test and presented as a median value. For comparison between chlorpromazine- and Dyngo4a-treated cells, a two-way analysis of variance (ANOVA) on 2× square root-transformed data of values relative to controls and Tukey’s multiple-comparison test were used.
SUPPLEMENTAL MATERIAL
Cellular internalization of unlabeled and labeled H. pylori vesicles. (A) Native H. pylori vesicles are internalized into AGS cells. Unlabeled vesicles were incubated with AGS cells at 37°C for 30 min, 150 min, and 18 h. Vesicles were detected with biotinylated Lewis b conjugate and Strp-FITC (green). Cells were stained for actin with phalloidin-rhodamine (red). Scale bar = 5 µm. (B) H. pylori vesicles are internalized into primary buccal epithelial cells. FITC-labeled vesicles were incubated with buccal epithelial cells for 24 h. Vesicles are visualized in green, and the cell is visualized with a live/dead stain (red) in a confocal image, where the depth of the square is 9 mm. The lines point to the same vesicle viewed from the top and from the side of the cell and show that vesicles are internalized. Download
H. pylori vesicles are internalized into AGS cells. Biotin linker-labeled vesicles were incubated with AGS cells for 6 h. Internalized vesicles were detected with Strp-FITC (green) under reducing conditions, and the cell plasma membrane was stained with CellMask (red). Shown is a cell in a merged 3D confocal image in which the outline of the cell is drawn in white based on the red staining of the plasma (this is a complement to Fig. 1B). Download
Reducing conditions cleave the disulfide bond in labeled H. pylori vesicles. H. pylori vesicles in a test tube were treated with 50 mM MESNA (reducing conditions) or with buffer for 30 min on ice. After washing, the protein concentration was measured and a dilution series of vesicles (MESNA or buffer treated) was detected at 800 nm (green). Fluorescence at 800 nm was lower in vesicles treated with MESNA, verifying that it is possible to cleave the linker between the vesicle and the dye. Download
AGS cells remained viable after drug treatment. Cell viability was analyzed by live/dead staining (Life Technologies) after drug treatment of AGS cells as described in Materials and Methods. Fluorescence emission was detected at 535 nm (green) and 590 nm (red) with a Tecan Infinite f200 PRO reader. The amount of cells with an impermeable membrane (red) was compared to the total amount of cells (green) to determine the relative amount of dead cells. None of the conditions used for chemical inhibition were toxic to the cells, as indicated by equal survival rates among treated and control cells. Chlorpromazine- and MβCD-treated cells were compared to control cells (+FBS). Dyngo4a- and filipin-treated cells were compared to control cells (−FBS). Download
Filipin treatment of AGS cells decreases CtxB internalization. CtxB was incubated with filipin-treated AGS cells in the qIS assay for 20 min, and CtxB internalization decreased in a dose-dependent manner. CtxB internalization is known to be dependent on cholesterol, and analyzing CtxB internalization after filipin treatment of AGS cells proves the effectiveness of filipin. All experiments were performed in triplicate (n = 2). Download
Fluorescent micrographs show the disruption of caveola formation in AGS cells after treatment with MβCD and filipin. AGS cells were treated with filipin or MβCD under the indicated conditions, and cells were stained for F-actin (red), AP-2 (green), and caveolin-1 (blue) after fixation. The drug treatments targeting cholesterol levels in AGS cells disrupt the structure of the caveolae. Scale bar = 10 µm. Download
ACKNOWLEDGMENTS
This project was supported by grants from the JC Kempe Memorial Foundation to A.O. and L.N.S.; MIMS and the Swedish Foundation for Strategic Research to R.L.; the Swedish Cancer Society and Cancerforskningsfonden i Norrland to A.A. This work was performed within the Umeå Centre for Microbial Research (UCMR) Linnaeus Program.
We thank Anna Shevtsova for advice concerning the statistical analysis and Marie Westermark for help in isolating vesicles.
Footnotes
Citation Olofsson A, Nygård Skalman L, Obi I, Lundmark R, Arnqvist A. 2014. Uptake of Helicobacter pylori vesicles is facilitated by clathrin-dependent and clathrin-independent endocytic pathways. mBio 5(3):e00979-14. doi:10.1128/mBio.00979-14.
REFERENCES
- 1. Tseng TT, Tyler BM, Setubal JC. 2009. Protein secretion systems in bacterial-host associations, and their description in the gene ontology. BMC Microbiol. 9(Suppl 1):S2. 10.1186/1471-2180-9-2 [DOI] [PMC free article] [PubMed] [Google Scholar]
- 2. Kuehn MJ, Kesty NC. 2005. Bacterial outer membrane vesicles and the host-pathogen interaction. Genes Dev. 19:2645–2655. 10.1101/gad.1299905 [DOI] [PubMed] [Google Scholar]
- 3. Beveridge TJ. 1999. Structures of gram-negative cell walls and their derived membrane vesicles. J. Bacteriol. 181:4725–4733 [DOI] [PMC free article] [PubMed] [Google Scholar]
- 4. Unal CM, Schaar V, Riesbeck K. 2011. Bacterial outer membrane vesicles in disease and preventive medicine. Semin. Immunopathol. 33:395–408. 10.1007/s00281-010-0231-y [DOI] [PubMed] [Google Scholar]
- 5. Ellis TN, Kuehn MJ. 2010. Virulence and immunomodulatory roles of bacterial outer membrane vesicles. Microbiol. Mol. Biol. Rev. 74:81–94. 10.1128/MMBR.00031-09 [DOI] [PMC free article] [PubMed] [Google Scholar]
- 6. Macdonald IA, Kuehn MJ. 2012. Offense and defense: microbial membrane vesicles play both ways. Res. Microbiol. 163:607–618. 10.1016/j.resmic.2012.10.020 [DOI] [PMC free article] [PubMed] [Google Scholar]
- 7. Amano A, Takeuchi H, Furuta N. 2010. Outer membrane vesicles function as offensive weapons in host-parasite interactions. Microbes Infect. 12:791–798. 10.1016/j.micinf.2010.05.008 [DOI] [PubMed] [Google Scholar]
- 8. Doherty GJ, McMahon HT. 2009. Mechanisms of endocytosis. Annu. Rev. Biochem. 78:857–902. 10.1146/annurev.biochem.78.081307.110540 [DOI] [PubMed] [Google Scholar]
- 9. McMahon HT, Boucrot E. 2011. Molecular mechanism and physiological functions of clathrin-mediated endocytosis. Nat. Rev. Mol. Cell Biol. 12:517–533. 10.1038/nrm3151 [DOI] [PubMed] [Google Scholar]
- 10. Sandvig K, Pust S, Skotland T, van Deurs B. 2011. Clathrin-independent endocytosis: mechanisms and function. Curr. Opin. Cell Biol. 23:413–420. 10.1016/j.ceb.2011.03.007 [DOI] [PubMed] [Google Scholar]
- 11. Parton RG, del Pozo MA. 2013. Caveolae as plasma membrane sensors, protectors and organizers. Nat. Rev. Mol. Cell Biol. 14:98–112. 10.1038/nrm3512 [DOI] [PubMed] [Google Scholar]
- 12. Simons K, Gerl MJ. 2010. Revitalizing membrane rafts: new tools and insights. Nat. Rev. Mol. Cell Biol. 11:688–699. 10.1038/nrm2977 [DOI] [PubMed] [Google Scholar]
- 13. Henley JR, Krueger EW, Oswald BJ, McNiven MA. 1998. Dynamin-mediated internalization of caveolae. J. Cell Biol. 141:85–99. 10.1083/jcb.141.1.85 [DOI] [PMC free article] [PubMed] [Google Scholar]
- 14. Furuta N, Tsuda K, Omori H, Yoshimori T, Yoshimura F, Amano A. 2009. Porphyromonas gingivalis outer membrane vesicles enter human epithelial cells via an endocytic pathway and are sorted to lysosomal compartments. Infect. Immun. 77:4187–4196. 10.1128/IAI.00009-09 [DOI] [PMC free article] [PubMed] [Google Scholar]
- 15. Schaar V, De Vries SP, Perez Vidakovics ML, Bootsma HJ, Larsson L, Hermans PW, Bjartell A, Mörgelin M, Riesbeck K. 2011. Multicomponent Moraxella catarrhalis outer membrane vesicles induce an inflammatory response and are internalized by human epithelial cells. Cell. Microbiol. 13:432–449. 10.1111/j.1462-5822.2010.01546.x [DOI] [PubMed] [Google Scholar]
- 16. Kesty NC, Mason KM, Reedy M, Miller SE, Kuehn MJ. 2004. Enterotoxigenic Escherichia coli vesicles target toxin delivery into mammalian cells. EMBO J. 23:4538–4549. 10.1038/sj.emboj.7600471 [DOI] [PMC free article] [PubMed] [Google Scholar]
- 17. Bomberger JM, Maceachran DP, Coutermarsh BA, Ye S, O’Toole GA, Stanton BA. 2009. Long-distance delivery of bacterial virulence factors by Pseudomonas aeruginosa outer membrane vesicles. PLoS Pathog. 5:e1000382. 10.1371/journal.ppat.1000382 [DOI] [PMC free article] [PubMed] [Google Scholar]
- 18. Rompikuntal PK, Thay B, Khan MK, Alanko J, Penttinen A-M, Asikainen S, Wai SN, Oscarsson J. 2012. Perinuclear localization of internalized outer membrane vesicles carrying active cytolethal distending toxin (CDT) from Aggregatibacter actinomycetemcomitans. Infect. Immun. 80:31–42. 10.1128/IAI.06069-11 [DOI] [PMC free article] [PubMed] [Google Scholar]
- 19. Guidi R, Levi L, Rouf SF, Puiac S, Rhen M, Frisan T. 2013. Salmonella enterica delivers its genotoxin through outer membrane vesicles secreted from infected cells. Cell. Microbiol. 15:2034–2050. 10.1111/cmi.12172 [DOI] [PubMed] [Google Scholar]
- 20. Bielaszewska M, Rüter C, Kunsmann L, Greune L, Bauwens A, Zhang W, Kuczius T, Kim KS, Mellmann A, Schmidt MA, Karch H. 2013. Enterohemorrhagic Escherichia coli hemolysin employs outer membrane vesicles to target mitochondria and cause endothelial and epithelial apoptosis. PLoS Pathog. 9:e1003797. 10.1371/journal.ppat.1003797 [DOI] [PMC free article] [PubMed] [Google Scholar]
- 21. Parker H, Chitcholtan K, Hampton MB, Keenan JI. 2010. Uptake of Helicobacter pylori outer membrane vesicles by gastric epithelial cells. Infect. Immun. 78:5054–5061. 10.1128/IAI.00299-10 [DOI] [PMC free article] [PubMed] [Google Scholar]
- 22. Kaparakis M, Turnbull L, Carneiro L, Firth S, Coleman HA, Parkington HC, Le Bourhis L, Karrar A, Viala J, Mak J, Hutton ML, Davies JK, Crack PJ, Hertzog PJ, Philpott DJ, Girardin SE, Whitchurch CB, Ferrero RL. 2010. Bacterial membrane vesicles deliver peptidoglycan to NOD1 in epithelial cells. Cell. Microbiol. 12:372–385. 10.1111/j.1462-5822.2009.01404.x [DOI] [PubMed] [Google Scholar]
- 23. Atherton JC. 2006. The pathogenesis of Helicobacter pylori-induced gastro-duodenal diseases. Annu. Rev. Pathol. 1:63–96. 10.1146/annurev.pathol.1.110304.100125 [DOI] [PubMed] [Google Scholar]
- 24. Fiocca R, Necchi V, Sommi P, Ricci V, Telford J, Cover TL, Solcia E. 1999. Release of Helicobacter pylori vacuolating cytotoxin by both a specific secretion pathway and budding of outer membrane vesicles. Uptake of released toxin and vesicles by gastric epithelium. J. Pathol. 188:220–226. 10.1002/(SICI)1096-9896(199906)188:2<220::AID-PATH307>3.0.CO;2-C [DOI] [PubMed] [Google Scholar]
- 25. Keenan J, Day T, Neal S, Cook B, Perez-Perez G, Allardyce R, Bagshaw P. 2000. A role for the bacterial outer membrane in the pathogenesis of Helicobacter pylori infection. FEMS Microbiol. Lett. 182:259–264. 10.1111/j.1574-6968.2000.tb08905.x [DOI] [PubMed] [Google Scholar]
- 26. Olofsson A, Vallström A, Petzold K, Tegtmeyer N, Schleucher J, Carlsson S, Haas R, Backert S, Wai SN, Gröbner G, Arnqvist A. 2010. Biochemical and functional characterization of Helicobacter pylori vesicles. Mol. Microbiol. 77:1539–1555. 10.1111/j.1365-2958.2010.07307.x [DOI] [PMC free article] [PubMed] [Google Scholar]
- 27. Mullaney E, Brown PA, Smith SM, Botting CH, Yamaoka YY, Terres AM, Kelleher DP, Windle HJ. 2009. Proteomic and functional characterization of the outer membrane vesicles from the gastric pathogen Helicobacter pylori. Proteomics Clin. Appl. 3:785–796. 10.1002/prca.200800192 [DOI] [PubMed] [Google Scholar]
- 28. Bauman SJ, Kuehn MJ. 2009. Pseudomonas aeruginosa vesicles associate with and are internalized by human lung epithelial cells. BMC Microbiol. 9:26. 10.1186/1471-2180-9-26 [DOI] [PMC free article] [PubMed] [Google Scholar]
- 29. Mayle KM, Le AM, Kamei DT. 2012. The intracellular trafficking pathway of transferrin. Biochim. Biophys. Acta 1820:264–281. 10.1016/j.bbagen.2011.09.009 [DOI] [PMC free article] [PubMed] [Google Scholar]
- 30. Huang F, Khvorova A, Marshall W, Sorkin A. 2004. Analysis of clathrin-mediated endocytosis of epidermal growth factor receptor by RNA interference. J. Biol. Chem 279:16657–166611. 10.1074/jbc.C400046200 [DOI] [PubMed] [Google Scholar]
- 31. Lundmark R, Doherty GJ, Howes MT, Cortese K, Vallis Y, Parton RG, McMahon HT. 2008. The GTPase-activating protein GRAF1 regulates the CLIC/GEEC endocytic pathway. Curr. Biol. 18:1802–1808. 10.1016/j.cub.2008.10.044 [DOI] [PMC free article] [PubMed] [Google Scholar]
- 32. Doherty GJ, Lundmark R. 2009. GRAF1-dependent endocytosis. Biochem. Soc. Trans. 37:1061–1065. 10.1042/BST0371061 [DOI] [PubMed] [Google Scholar]
- 33. Parker H, Keenan JI. 2012. Composition and function of Helicobacter pylori outer membrane vesicles. Microbes Infect. 14:9–16. 10.1016/j.micinf.2011.08.007 [DOI] [PubMed] [Google Scholar]
- 34. Ivanov AI. 2008. Pharmacological inhibition of endocytic pathways: is it specific enough to be useful? Methods Mol. Biol. 440:15–33. 10.1007/978-1-59745-178-9_2 [DOI] [PubMed] [Google Scholar]
- 35. Rodal SK, Skretting G, Garred Ø, Vilhardt F, van Deurs B, Sandvig K. 1999. Extraction of cholesterol with methyl-β-cyclodextrin perturbs formation of clathrin-coated endocytic vesicles. Mol. Biol. Cell 10:961–974 [DOI] [PMC free article] [PubMed] [Google Scholar]
- 36. Wunder C, Churin Y, Winau F, Warnecke D, Vieth M, Lindner B, Zähringer U, Mollenkopf HJ, Heinz E, Meyer TF. 2006. Cholesterol glucosylation promotes immune evasion by Helicobacter pylori. Nat. Med. 12:1030–1038. 10.1038/nm1480 [DOI] [PubMed] [Google Scholar]
- 37. Pollak CN, Delpino MV, Fossati CA, Baldi PC. 2012. Outer membrane vesicles from Brucella abortus promote bacterial internalization by human monocytes and modulate their innate immune response. PLoS One 7:e50214. 10.1371/journal.pone.0050214 [DOI] [PMC free article] [PubMed] [Google Scholar]
- 38. Howes MT, Kirkham M, Riches J, Cortese K, Walser PJ, Simpson F, Hill MM, Jones A, Lundmark R, Lindsay MR, Hernandez-Deviez DJ, Hadzic G, McCluskey A, Bashir R, Liu L, Pilch P, McMahon H, Robinson PJ, Hancock JF, Mayor S, Parton RG. 2010. Clathrin-independent carriers form a high capacity endocytic sorting system at the leading edge of migrating cells. J. Cell Biol. 190:675–691. 10.1083/jcb.201002119 [DOI] [PMC free article] [PubMed] [Google Scholar]
- 39. de Curtis I, Meldolesi J. 2012. Cell surface dynamics—how Rho GTPases orchestrate the interplay between the plasma membrane and the cortical cytoskeleton. J. Cell Sci. 125:4435–4444. 10.1242/jcs.108266 [DOI] [PubMed] [Google Scholar]
- 40. Sharpe SW, Kuehn MJ, Mason KM. 2011. Elicitation of epithelial-derived immune effectors by outer membrane vesicles of nontypeable Haemophilus influenzae. Infect. Immun. 79:4361–4369. 10.1128/IAI.05332-11 [DOI] [PMC free article] [PubMed] [Google Scholar]
- 41. Hill MM, Bastiani M, Luetterforst R, Kirkham M, Kirkham A, Nixon SJ, Walser P, Abankwa D, Oorschot VM, Martin S, Hancock JF, Parton RG. 2008. PTRF-Cavin, a conserved cytoplasmic protein required for caveola formation and function. Cell 132:113–124. 10.1016/j.cell.2007.11.042 [DOI] [PMC free article] [PubMed] [Google Scholar]
- 42. Sandvig K, Bergan J, Kavaliauskiene S, Skotland T. 2014. Lipid requirements for entry of protein toxins into cells. Prog. Lipid Res. 54C:1–13. 10.1016/j.plipres.2014.01.001 [DOI] [PubMed] [Google Scholar]
- 43. Doherty GJ, Åhlund MK, Howes MT, Morén B, Parton RG, McMahon HT, Lundmark R. 2011. The endocytic protein GRAF1 is directed to cell-matrix adhesion sites and regulates cell spreading. Mol. Biol. Cell 22:4380–4389. 10.1091/mbc.E10-12-0936 [DOI] [PMC free article] [PubMed] [Google Scholar]
- 44. Gauthier NC, Monzo P, Kaddai V, Doye A, Ricci V, Boquet P. 2005. Helicobacter pylori VacA cytotoxin: a probe for a clathrin-independent and Cdc42-dependent pinocytic pathway routed to late endosomes. Mol. Biol. Cell 16:4852–4866. 10.1091/mbc.E05-05-0398 [DOI] [PMC free article] [PubMed] [Google Scholar]
- 45. Odenbreit S, Till M, Haas R. 1996. Optimized BlaM-transposon shuttle mutagenesis of Helicobacter pylori allows the identification of novel genetic loci involved in bacterial virulence. Mol. Microbiol. 20:361–373. 10.1111/j.1365-2958.1996.tb02623.x [DOI] [PubMed] [Google Scholar]
- 46. Morén B, Shah C, Howes MT, Schieber NL, McMahon HT, Parton RG, Daumke O, Lundmark R. 2012. EHD2 regulates caveolar dynamics via ATP-driven targeting and oligomerization. Mol. Biol. Cell 23:1316–1329. 10.1091/mbc.E11-09-0787 [DOI] [PMC free article] [PubMed] [Google Scholar]
Associated Data
This section collects any data citations, data availability statements, or supplementary materials included in this article.
Supplementary Materials
Cellular internalization of unlabeled and labeled H. pylori vesicles. (A) Native H. pylori vesicles are internalized into AGS cells. Unlabeled vesicles were incubated with AGS cells at 37°C for 30 min, 150 min, and 18 h. Vesicles were detected with biotinylated Lewis b conjugate and Strp-FITC (green). Cells were stained for actin with phalloidin-rhodamine (red). Scale bar = 5 µm. (B) H. pylori vesicles are internalized into primary buccal epithelial cells. FITC-labeled vesicles were incubated with buccal epithelial cells for 24 h. Vesicles are visualized in green, and the cell is visualized with a live/dead stain (red) in a confocal image, where the depth of the square is 9 mm. The lines point to the same vesicle viewed from the top and from the side of the cell and show that vesicles are internalized. Download
H. pylori vesicles are internalized into AGS cells. Biotin linker-labeled vesicles were incubated with AGS cells for 6 h. Internalized vesicles were detected with Strp-FITC (green) under reducing conditions, and the cell plasma membrane was stained with CellMask (red). Shown is a cell in a merged 3D confocal image in which the outline of the cell is drawn in white based on the red staining of the plasma (this is a complement to Fig. 1B). Download
Reducing conditions cleave the disulfide bond in labeled H. pylori vesicles. H. pylori vesicles in a test tube were treated with 50 mM MESNA (reducing conditions) or with buffer for 30 min on ice. After washing, the protein concentration was measured and a dilution series of vesicles (MESNA or buffer treated) was detected at 800 nm (green). Fluorescence at 800 nm was lower in vesicles treated with MESNA, verifying that it is possible to cleave the linker between the vesicle and the dye. Download
AGS cells remained viable after drug treatment. Cell viability was analyzed by live/dead staining (Life Technologies) after drug treatment of AGS cells as described in Materials and Methods. Fluorescence emission was detected at 535 nm (green) and 590 nm (red) with a Tecan Infinite f200 PRO reader. The amount of cells with an impermeable membrane (red) was compared to the total amount of cells (green) to determine the relative amount of dead cells. None of the conditions used for chemical inhibition were toxic to the cells, as indicated by equal survival rates among treated and control cells. Chlorpromazine- and MβCD-treated cells were compared to control cells (+FBS). Dyngo4a- and filipin-treated cells were compared to control cells (−FBS). Download
Filipin treatment of AGS cells decreases CtxB internalization. CtxB was incubated with filipin-treated AGS cells in the qIS assay for 20 min, and CtxB internalization decreased in a dose-dependent manner. CtxB internalization is known to be dependent on cholesterol, and analyzing CtxB internalization after filipin treatment of AGS cells proves the effectiveness of filipin. All experiments were performed in triplicate (n = 2). Download
Fluorescent micrographs show the disruption of caveola formation in AGS cells after treatment with MβCD and filipin. AGS cells were treated with filipin or MβCD under the indicated conditions, and cells were stained for F-actin (red), AP-2 (green), and caveolin-1 (blue) after fixation. The drug treatments targeting cholesterol levels in AGS cells disrupt the structure of the caveolae. Scale bar = 10 µm. Download