Abstract
A simple, accurate and robust quantitative CE method for the determination of oversulfated chondroitin sulfate (OSCS) as a contaminant in heparin (Hep) preparations is described. After degradation of the polysaccharides by acidic hydrolysis, the hexosamines produced, i.e., GlcN from Hep and GalN from OSCS, were derivatized with anthranilic acid (AA) and separated by means of CE in approx. 10 min with high sensitivity detection at 214 nm (limit of detection (LOD) of approx. 200 pg). Furthermore, AA-derivatized GlcN and GalN showed quite similar molar absorptivity allowing for direct and simple quantification of OSCS in Hep samples. Moreover, a preliminary step of specific enzymatic treatment by using chondroitin ABC lyase may be applied for the specific elimination of interference in the analysis due to the possible presence in Hep samples of natural chondroitin sulfate and dermatan sulfate impurities, making this analytical approach highly specific for OSCS contamination, since chondroitin ABC lyase is unable to act on this semi-synthetic polymer. The CE method was validated for specificity, linearity, accuracy, precision, LOD and limit of quantification (LOQ). Due to the very high sensitivity of CE, as little as 1% OSCS contaminant in Hep sample could be detected and quantified. Finally, a contaminated raw Hep sample was found to contain 38.9% OSCS while a formulated contaminated Hep was calculated to have 39.7% OSCS.
Keywords: Oversulfated chondroitin sulfate, Heparin, Glucosamine, Galactosamine, Capillary Electrophoresis, Anthranilic acid
Introduction
Heparin (Hep) is a linear sulfated natural polysaccharide consisting of 1→4 linked pyranosyluronic acid (uronic acid, either α-l-iduronic and β-d-glucuronic acid with some O-sulfo substitution) and 2-amino-2-deoxyglucopyranose (α-d-glucosamine, GlcN, with either N-sulfo or N-acetyl substitution) repeating units [1]. It belongs to the family of glycosaminoglycans (GAGs) endowed with anticoagulant and antithrombotic properties [1–3] used clinically over the last half-century as an anticoagulant drug [1]. Unfortunately, Hep possesses several undesirable side effects that include dangerous haemorrhagic complications [4, 5]. It was for this reason that low-molecular-weight (LMW)-Heps (average molecular mass of 3000–8000) were introduced as Hep substitutes having reduced side effects, more predictable pharmacological action, sustained antithrombotic activity, and improved bioavailability [6, 7].
Recently, patients presented, within several minutes after intravenous infusion of Hep, angioedema, hypotension, swelling of the larynx and related symptoms, which in some cases ended in death [8–10]. The contaminant was identified as an unusual oversulfated form of chondroitin sulfate (OSCS) present in high content in suspect lots of Hep [8]. Furthermore, dermatan sulfate (DS), a known impurity of Hep [11], was also found in selected samples with no other contaminant or impurities observed. Finally, initial reports have suggested that this OSCS macromolecule was also present in LMW-Hep formulations [10] with a greater difficulty to be detected depending on the depolymerization process adopted [10].
The structure of the OSCS contaminant, present within specific lots of Hep, has been fully identified by using multiple orthogonal techniques, including multidimensional NMR, to overcome the challenges inherent in the analysis of complex polysaccharides, including Hep [8]. The structure of OSCS was definitively confirmed as formed of disaccharide repeat units of d-glucuronic acid linked β1→3 to a β-N-acetyl-d-galactosamine (GalN). The disaccharide unit was found to posses an unusual sulfation pattern being sulfated at the 2-and 3-positions of the glucuronic acid as well as at the 4- and 6- positions of the GalN unit [8]. Due to the nature of this contaminant, traditional screening tests and analytical approaches are unable to differentiate between contaminated and uncontaminated lots. Furthermore, the methodology used for the initial characterization of this contaminant, i.e., multiple orthogonal techniques including multidimensional NMR [8], is complex, expensive and not useful for quality assurance in quality control laboratories as it is unable to process many samples in a short time and to give quantitative results with low coefficient of variation values. In contrast, capillary electrophoresis (CE) has been applied in the analysis of intact GAGs and GAG-derived oligosaccharides and disaccharides, as such monosaccharides, affording concentration and structural characterization data due to its high resolving power and sensitivity [12]. In this paper, a validated CE method has been developed for the quantitative determination of OSCS in Hep preparations after degradation of the polysaccharides to produce hexosamine units, i.e., GlcN from Hep and GalN from OSCS, their derivatization with anthranilic acid (AA) and separation by means of CE at 214 nm. Furthermore, a preliminary step of specific enzymatic treatment may be applied for the specific elimination of interference in the analysis due to the possible presence in Hep samples of natural CS/DS [11]. Finally, this analytical approach has been performed on raw material as such as Hep final formulations and potentially applicable also to LMW-Hep preparations.
Experimental
Materials
d-(+)-GlcN hydrochloride, d-(+)-GalN hydrochloride, d-Ribose (Rib), anthranilic acid (2-aminobenzoic acid, AA), sodium cyanoborohydride and chondroitinase ABC, chondroitin ABC lyase, from Proteus vulgaris (EC 4.2.2.4), 0.5–2 units/mg, were from Sigma-Aldrich. Chondroitin sulfate A from bovine trachea, CSA, chondroitin sulfate C, CSC, from shark cartilage, dermatan sulfate (DS) and Hep from porcine intestinal mucosa were from Sigma. Microcon YM-3 filters having a molecular mass cut-off of 3,000 Da were from Amicon. All the other reagents were analytical grade. OSCS was prepared from CS according to previous published procedures [8, 10, 13]. A contaminated Hep active pharmaceutical ingredient (API), a contaminated raw Hep and a contaminated formulated Hep sample were from heparin manufacturers [10].
NMR analysis
The 13C-NMR spectra of OSCS were recorded by a Bruker AMX400 WB spectrometer operating at 100.61 MHz. The sample was previously lyophilized three times with D2O, and finally prepared by dissolving 200 mg in 2.0 mL of D2O at a high level of deuteration (99.997%). The spectra were recorded at a temperature of 33°C and pH 6.5, unless specified.
Sample preparation
Stock solutions of GlcN or GalN standard were prepared by dissolving an accurately weighed amount of 50 mg in 5 ml (10 mg/mL) of doubly distilled water. A series of standard solutions were obtained by dilution of the stock solution in a standard volume of water (200 µL) and lyophilized.
Samples were prepared by dissolving an accurately weighed amount (10 mg) of sample in 10 ml (1 mg/mL) of doubly distilled water. Sample solutions (200 µL) were lyophilized and reconstituted with 200 µL of accurately prepared 2 M HCl. After 60 min at 110°C (see below for the time-course of chemical treatment), the samples were reconstituted with 2 mL of doubly distilled water and lyophilized.
In the case of pre-treatment with chondroitinase ABC to degrade possible CS/DS impurity Hep samples (200 µL of the above-prepared solutions) were incubated with enzyme (40 µL containing 100 m-units) and 260 µL of 50 mM ammonium acetate at pH 8.0 for 12 h at 37°C. After boiling for 5 min, the samples were filtered on the centrifugal filters YM-3 at 10,000 g for 60 min. The undigested polysaccharides, i.e., Hep and OSCS, were recovered from the retentate lyophilized and submitted to chemical hydrolysis with 2 M HCl (as described above).
Derivatization of hexosamine with AA
Lyophilized GlcN or GalN standard solutions or treated samples, in the presence of internal standard ribose, were dissolved in 50 µL 1% fresh sodium acetate and 50 µL of AA (30 mg) and sodium cyanoborohydride (20 mg) dissolved in 1 mL of methanol-acetate-borate solution (120 mg sodium acetate and 100 mg boric acid in 5 mL methanol) [14]. Tubes were heated at 80°C for 60 min. After cooling to room temperature, the samples were made up to 150 µL with doubly distilled water and analyzed by CE.
Capillary electrophoresis
Capillary electrophoresis was performed on a Beckman HPCE instrument (P/ACE system 5000) equipped with a UV detector set at 214 nm. Separation and analysis were performed on an uncoated fused-silica capillary tube (50 µm I.D., 85 cm total length and 65 cm from the injection point to the detector) at 25°C. The operating buffer was composed of 150 mM boric acid and 50 mM NaH2PO4 buffered at pH 7.0 with NaOH solution. The buffer was degassed by vacuum filtration through a 0.2 µm membrane filter, followed by agitation in an ultrasonic bath. Before each run, the capillary tube was washed with 0.1 M NaOH for 1 min, doubly distilled water for 5 min, and then conditioned with the operating buffer for 5 min. The samples to be analyzed were injected automatically, using the pressure injection mode, in which the sample is pressurised for 10 s. The injection volume can be calculated with the Poiseuille equation as proposed by the manufacturer, giving an estimated volume of 6 nl per second of injection time. Electrophoresis was performed at 15 kV (about 35 µA) using normal polarity. Peak areas were recorded and calculated using the Beckman software system Gold V810.
Validation of the analytical method
The quantitative CE/UV method validations were established according to the Guidance for Industry, Bioanalytical Method Validation from the U.S. Department of Health and Human Services, Food and Drug Administration, Center for Drug Evaluation and Research (CDER), Center for Veterinary Medicine (CVM) published in May 2001 [15], including specificity, linearity, detection (LOD) and quantification (LOQ) limit, precision, accuracy, recovery, and robustness tests. The detection limits were estimated as the quantity of GlcN and GalN producing a signal-to-noise ratio of 3:1 for LOD and 10:1 for LOQ. The specificity of the CE/UV technique was determined with migration time (MT) and peak area (PA) of the two hexosamine peaks through the precision analysis assay. The calibration curves were constructed from PA versus concentrations of GlcN/GalN standard. Linear regression analysis was used to calculate the slope, intercept and correlation coefficient (r2) of the calibration curve. The precision of the method was assessed by determination of hexosamines with five replicates (n = 5) of five different concentrations (from 240 to 2400 pg) of standard solutions. Intra- and inter-day precision, and accuracy of the method were estimated by relative standard deviation percentage (CV%) from the analysis of freshly prepared solutions on 3 separate days. For recovery of GlcN from Hep, GlcN standard was added to a sample of non-contaminated Hep, and for the recovery of GalN the standard was added to a sample of OSCS, as previously described. The solutions were spiked with GlcN/GalN standard at three concentration levels (120, 150, and 200% of the normal hexosamines concentration in the preparations) and then analyzed. The solutions were replicated three times each, and the GlcN/GalN amounts determined were compared to the theoretical amounts. The recovery ratio percentage (REC%) and their CV% were calculated. Robustness was assessed by analysis of the standards in different analytical conditions, in particular temperatures, voltage, and buffer composition no more and no less than 10% of the adopted values.
Results
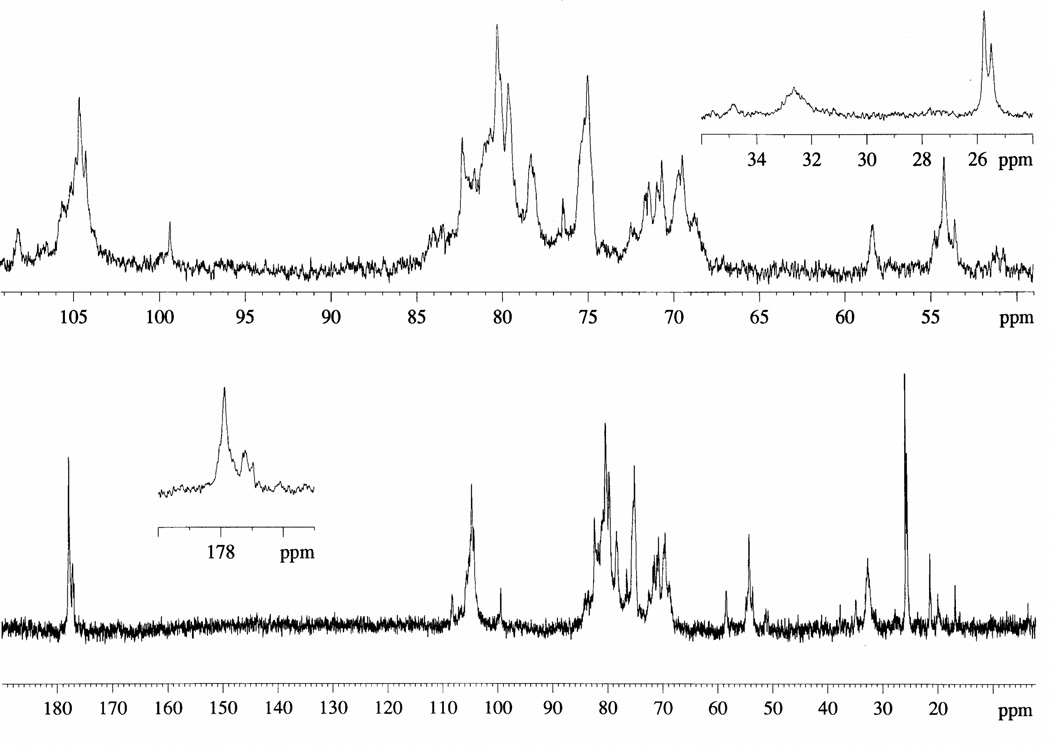
OSCS was prepared from CS according to a previous published procedures [8, 10, 13] (Figure 1) having a peak molecular weight (Mp, the molecular weight value on the top of the chromatographic peak) value of 10970, a number-average molecular weight (Mn) of 11090, a weight average molecular weight (Mw) of 16590, and a polydispersity index (p) of 1.496 as determined by high-performance size-exclusion liquid chromatography (HPSEC) [16]. These values are quite comparable to the molecular mass values of commercial Hep [10, 16]. OSCS and Hep samples were then subjected to the hydrolysis procedure to produce free hexosamines, GlcN or GalN, before their derivatization with AA and separation by CE. The hydrolysis process involves two acid-catalyzed steps, the hydrolysis of glycosidic linkage and the N-acetyl (and the N-sulfo in the case of Hep) groups (resulting in de-N-acetylation or de-N-sulfonation), with the formation of the hexosamines. OSCS and Hep hydrolysis procedure was carried out using HCl after evaluating both the effect of the acid concentration and the influence of the temperature and the incubation time on the hydrolysis reaction. Optimal conditions were found at 110°C using 2 M HCl for 60 min, affording a maximum percentage of hydrolysis. Lower temperatures or times were found to produce lower hexosamine percentages and stronger conditions shown to degrade GlcN and GalN. Other conditions have also been reported to be advantageous to produce free hexosamines from GAGs [17] by using high HCl concentration (7.5 N) and long reaction times (8 h) at low temperatures (80°C). However, these conditions are not useful for quality assurance in quality control laboratories, which need to process many samples in a short time.
Figure 1.
13C-NMR spectra of OSCS.
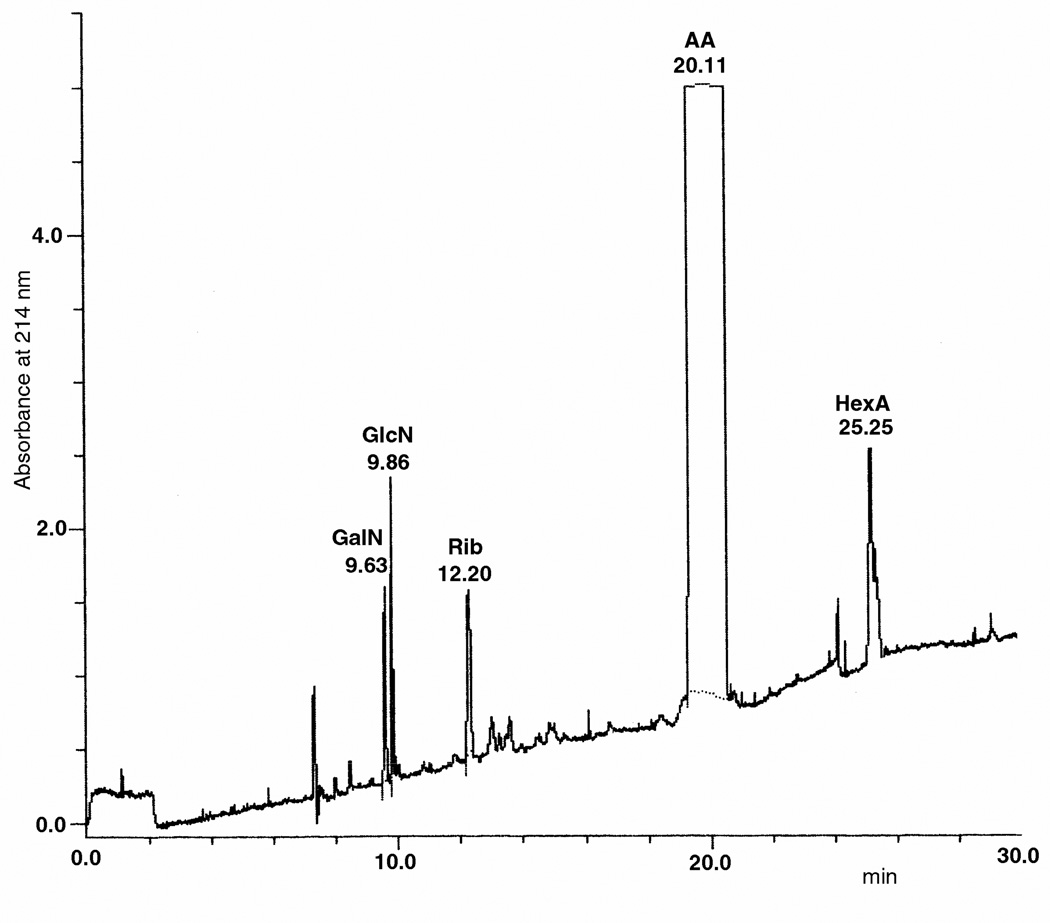
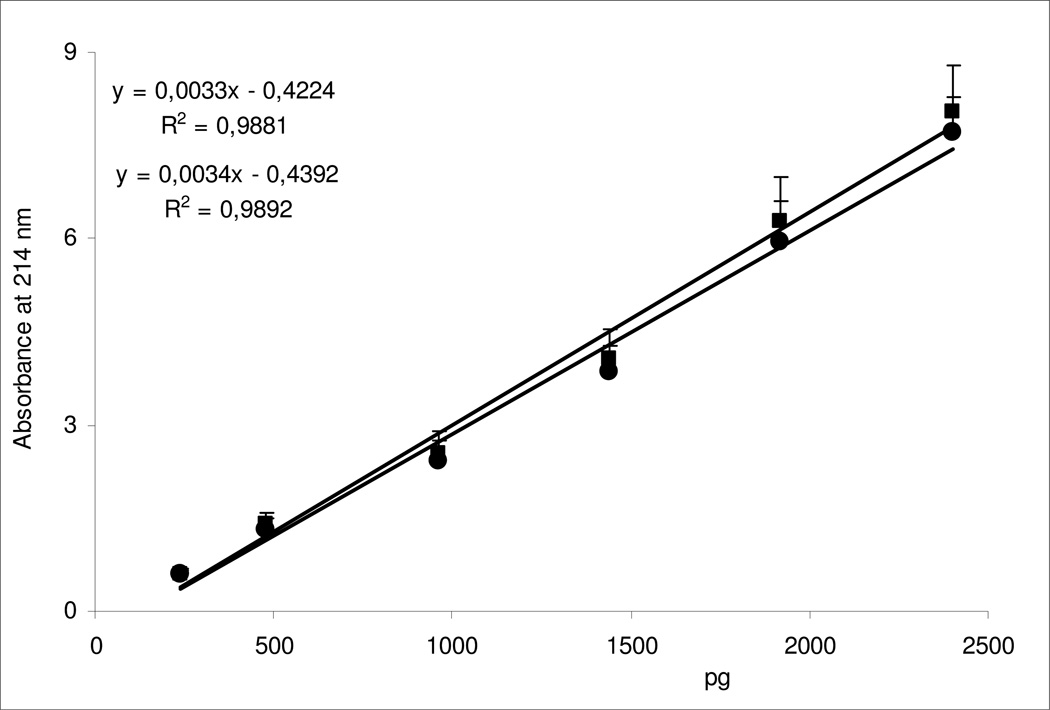
According to previous studies [14, 18, 19], GlcN and GalN (and other monosaccharides) are derivatized under optimum conditions with AA in methanol-acetate-borate reaction medium to produce derivatives capable of strong absorbance at UV 214 nm. After a very short time, 1 hour, required for the derivatization process, hexosamines are separated by CE in approx. 10 min (Figure 2) at a high sensitivity having a limit detection of approx. 200 pg (Figure 3). Furthermore, after derivatization with AA GlcN and GalN showed same calibration curves (Figure 3) with quite similar molar absorptivities, making this method useful for direct and simple quantification of OSCS in Hep samples (see below).
Figure 2.
CE electrophoregram of 500 pg GalN and GlcN derivatized with AA and detected at 214 nm. Hexuronic acids (HexA), i.e. glucuronic and iduronic acids, are also detected but not separated each other under the experimental conditions adopted. Ribose (Rib) is used as Internal Standard.
Figure 3.
Calibration curves of increasing amounts (pg = picograms) of GlcN and GalN derivatized with AA and detected at 214 nm. The equations and the correlation coefficients are reported.
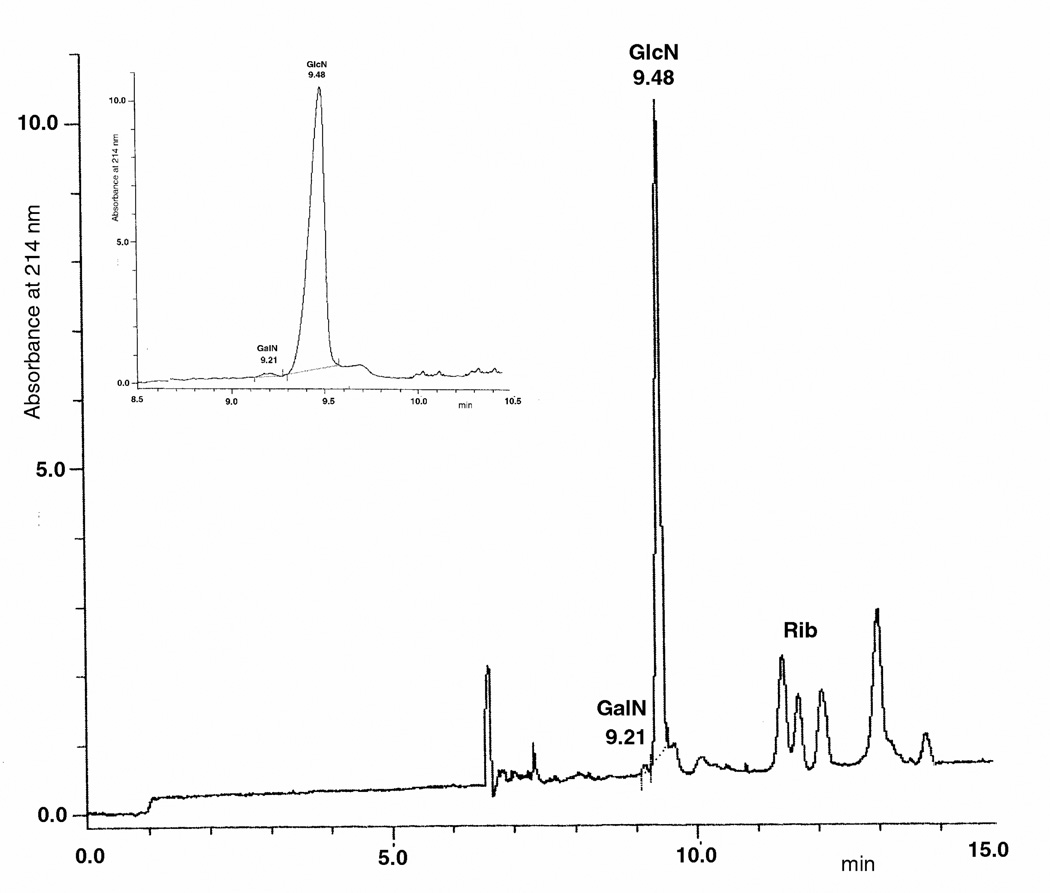
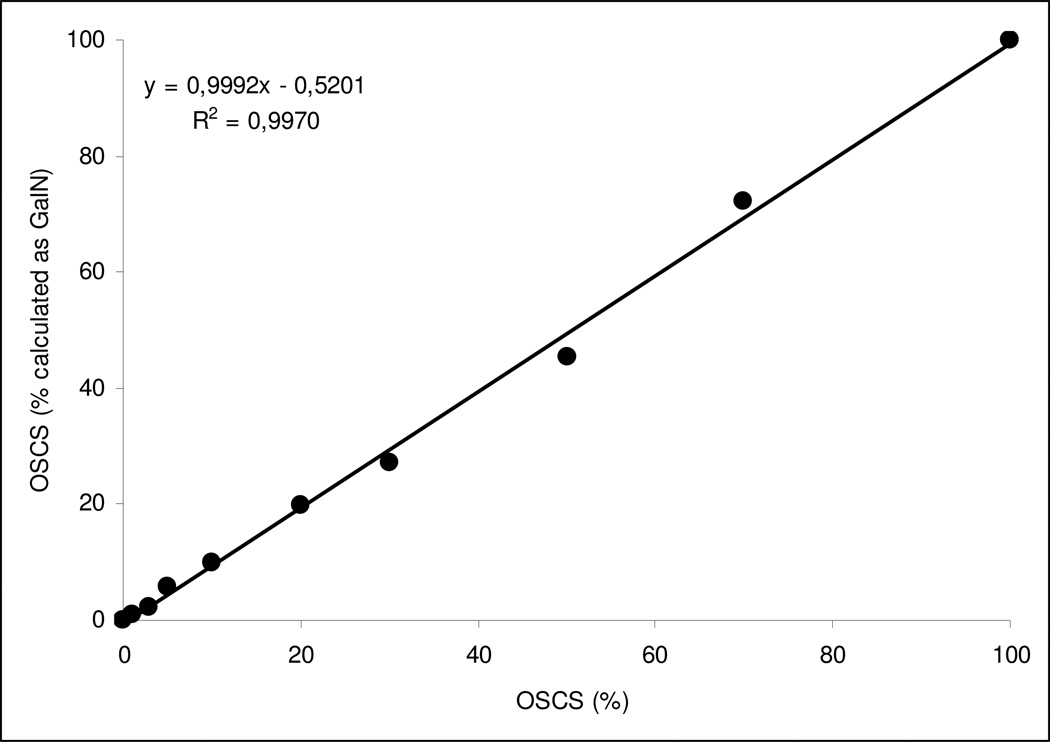
Mixtures with different absolute amounts of OSCS in Hep and various relative percentages of these two GAG species were prepared and analyzed by CE after hydrolysis procedure and derivatization with AA (see Figure 4 as an example). Due to the very high sensitivity of the CE method (Figure 3), we were able to observe as little as 1% OSCS contaminant in Hep sample (Figure 5) with a very good linear response, coefficient of regression greater than approx. 0.995 (Figure 6), between theoretic and analytically evaluated percentage values of OSCS in Hep.
Figure 4.
CE electrophoregrams of GlcN and GalN derivatized with AA and obtained after hydrolysis procedure of a mixture of OSCS (40%) in Hep (60%). Ribose (Rib) is used as Internal Standard.
Figure 5.
CE electrophoregrams of GlcN and GalN derivatized with AA and obtained after hydrolysis procedure of a mixture of OSCS (1%) in Hep (99%). Ribose (Rib) is used as Internal Standard.
Figure 6.
Correlation graph between OSCS percentages in Hep and obtained % OSCS as GalN amounts.
The intra- and inter-day variations (CV%) for the two hexosamines, under the experimental conditions adopted, were between 3.4 and 8.5 for MT, and between 2.5 and 5.8 for PA, respectively. The calibration curve showed good linearity for the examined concentration range, 240 – 2400 pg (40 µg/mL – 400 µg/mL), with an average correlation coefficient greater than 0.980 (Figure 3). The LOD and the LOQ of the method were approx. 200 and 500 pg, respectively, and the intra- and inter-day accuracy was estimated to range from 2.2% to 7.9%. The percent recoveries of hexosamines were calculated to be 92% for the three various concentrations tested in the Hep or OSCS preparations, and variations in temperatures, voltage, and buffer composition in comparison with adopted conditions within a 10% limit do not modify the electrophoresis results. Finally, GlcN and GalN showed to be stable in the hydrolysis conditions after 1 month at −20°C by comparison with the hexosamines in aqueous solution not submitted to hydrolysis procedure.
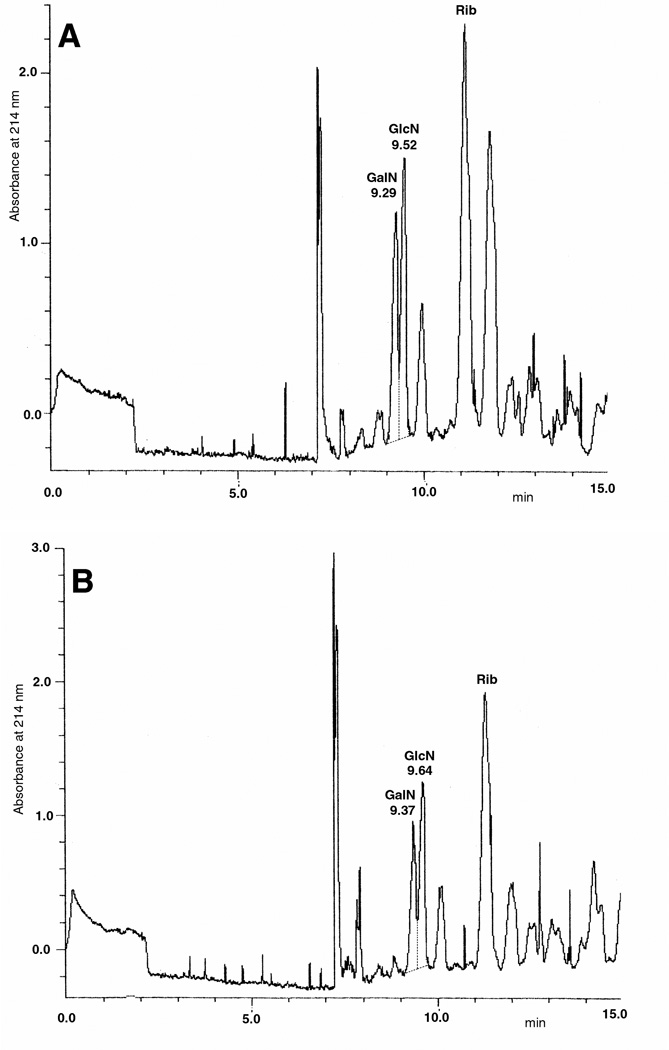
CE was applied for the determination of GalN (and GlcN) in several samples, CSA and CSC, DS, OSCS, non-contaminated Hep, contaminated raw Hep and a formulated contaminated Hep sample, in absence and in the presence of previous treatment with chondroitin ABC lyase (also considering that there are no known contaminants in Hep samples able to interfere with enzymatic digestion [11]). As expected, CS samples and DS were found to produce 100% GalN with no presence of GlcN, while quite no GalN was detected by CE after treatment with chondroitinase ABC due to the complete degradation of these GAGs by this lyase. In contrast, OSCS produced 100% GalN (with no GlcN) after acidic hydrolysis with no modification after the enzymatic treatment showing the incapacity of this lyase to act on this oversulfated semi-synthetic polymer, as already reported [8]. As expected, non-contaminated Hep produced quite 100% GlcN (with trace amounts of GalN) after HCl treatment irrespective of the enzymatic treatment (even if no GalN was evident after lyase treatment). Finally, contaminated raw Hep was found to contain 38.9% OSCS (as GalN%, Figure 7A) while the formulated contaminated Hep was calculated to have 39.7% OSCS (as GalN%, Figure 7B).
Figure 7.
CE electrophoregrams of GlcN and GalN derivatized with AA and obtained after hydrolysis procedure of (A) a contaminated raw Hep or (B) a formulated contaminated Hep sample. Ribose (Rib) is used as Internal Standard.
Discussion
AA (2-aminobenzoic acid) is well known for its utility in the determination with high sensitivity by means of HPLC or CE of the monosaccharide composition of glycoproteins [14, 19] and GAGs [20, 21] as such as GlcN in nutraceuticals [22]. This approach was also applied for the sensitive quantitative determination of OSCS in Hep raw material and formulations also in the presence of natural Hep contaminants, in particular DS [11], by performing a simple pre-treatment step with chondroitinase ABC able to degrade CS/DS (and hyaluronic acid) but unable to act on OSCS. Furthermore, GlcN and GalN showed same calibration curves with quite similar absorbance capacities after derivatization with AA useful for direct and simple quantification of OSCS in Hep samples by just considering their relative percentages. Finally, Hep samples for CE analysis are prepared in a short time after their lyophilization, 1 hour for acidic treatment and, after a further step of lyophilization, 1 hour for the derivatization step, suitable for the processing of several samples in a day also considering the rapid analysis enabled by CE, approx. 15 min. In the case of enzymatic pre-treatment, one day more is required. The lyophilization step is required after the acidic hydrolysis before derivatization to ensure the removal of all the possible water present in the products as it is well known that reductive amination of hexosamines is inhibited to a maximum of 30% at 50% water content [14].
OSCS also contaminated LMW-Heps obtained by enzymatic or different chemical depolymerization of Hep and the sensitivity of OSCS to various depolymerization processes similar to ones used in preparing commercial LMW-Heps has been reported [10]. In particular, a base catalyzed β-eliminative process and treatment in the presence of free radicals afford complex mixtures of LMW-Heps and OSCS having a reduced molecular mass that might mask the presence of this contaminant in certain assays and would be difficult to detect contaminated batches [10]. As a consequence, the illustrated analytical approach may be potentially applicable also to LMW-Hep preparations due to its capacity to detect and measure the two different hexosamine units forming Hep and OSCS. Finally, due to the fluorescence properties of AA, a more sensitive CE separation with LIF detection is expected for GalN and GlcN to evaluate the possible presence of OSCS contaminant in Hep preparations.
Abbreviations used
- AA
anthranilic acid, 2-aminobenzoic acid
- API
active pharmaceutical ingredient
- CE
Capillary electrophoresis
- CS
chondroitin sulfate
- CV%
standard deviation percentage
- DS
dermatan sulfate
- GAG(s)
glycosaminoglycan(s)
- GalN
Galactosamine, 2-amino-2-deoxy-d-galactose
- GlcN
Glucosamine, 2-amino-2-deoxy-d-glucose
- Hep
Heparin
- LIF
laser-induced fluorescence
- LMW-Hep
low-molecular-weight-Heparin
- LOD
detection limit
- LOQ
limit of quantification
- MT
migration time
- OSCS
oversulfated chondroitin sulfate
- PA
peak area
- REC%
recovery ratio percentage
- Rib
ribose
Footnotes
Publisher's Disclaimer: This is a PDF file of an unedited manuscript that has been accepted for publication. As a service to our customers we are providing this early version of the manuscript. The manuscript will undergo copyediting, typesetting, and review of the resulting proof before it is published in its final citable form. Please note that during the production process errors may be discovered which could affect the content, and all legal disclaimers that apply to the journal pertain.
References
- 1.Ofosu FA, Danishefsky I, Hirsh J. N.Y. Acad. Sci. Vol. 556. New York: 1989. Heparin and related polysaccharides. Structure and activities. [PubMed] [Google Scholar]
- 2.Petitou M, Casu B, Lindahl U. 1976–1983, a critical period in the history of heparin: the discovery of the antithrombin binding site. Biochimie. 2003;85:83–89. doi: 10.1016/s0300-9084(03)00078-6. [DOI] [PubMed] [Google Scholar]
- 3.Lindahl U. “Heparin” - from anticoagulant drug into the new biology. Glycoconj. J. 2000;17:597–605. doi: 10.1023/a:1011030711317. [DOI] [PubMed] [Google Scholar]
- 4.Unkle DW. Heparin-induced thrombocytopenia. Orthop. Nurs. 2007;26:383–385. doi: 10.1097/01.NOR.0000300952.80870.ce. [DOI] [PubMed] [Google Scholar]
- 5.Hassan Y, Awaisu A, Aziz NA, Aziz NH, Ismail O. Heparin-induced thrombocytopenia and recent advances in its therapy. J. Clin. Pharm. Ther. 2007;32:535–544. doi: 10.1111/j.1365-2710.2007.00865.x. [DOI] [PubMed] [Google Scholar]
- 6.Weitz JI. Low-molecular-weight heparins. N. Engl. J. Med. 1997;337:688–698. doi: 10.1056/NEJM199709043371007. [DOI] [PubMed] [Google Scholar]
- 7.Hirsh J, Levine MN. Low molecular weight heparin. Blood. 1992;79:1–17. [PubMed] [Google Scholar]
- 8.Guerrini M, Beccati D, Shriver Z, Naggi A, Viswanathan K, Bisio A, Capila I, Lansing JC, Guglieri S, Fraser B, Al-Hakim A, Gunay NS, Zhang Z, Robinson L, Buhse L, Nasr M, Woodcock J, Langer R, Venkataraman G, Linhardt RJ, Casu B, Torri G, Sasisekharan R. Oversulfated chondroitin sulfate is a contaminant in heparin associated with adverse clinical events. Nat. Biotechnol. 2008;26:669–675. doi: 10.1038/nbt1407. [DOI] [PMC free article] [PubMed] [Google Scholar]
- 9.Kishimoto TK, Viswanathan K, Ganguly T, Elankumaran S, Smith S, Pelzer K, Lansing JC, Sriranganathan N, Zhao G, Galcheva-Gargova Z, Al-Hakim A, Bailey GS, Fraser B, Roy S, Rogers-Cotrone T, Buhse L, Whary M, Fox J, Nasr M, Dal Pan GJ, Shriver Z, Langer RS, Venkataraman G, Austen KF, Woodcock J, Sasisekharan R. Contaminated heparin associated with adverse clinical events and activation of the contact system. N. Engl. J. Med. 2008;358:2457–2467. doi: 10.1056/NEJMoa0803200. [DOI] [PMC free article] [PubMed] [Google Scholar]
- 10.Zhang Z, Weïwer M, Li B, Kemp MM, Daman TH, Linhardt RJ. Oversulfated chondroitin sulfate: impact of a heparin impurity, associated with adverse clinical events, on low-molecular-weight heparin preparation. J. Med. Chem. 2008;51:5498–5501. doi: 10.1021/jm800785t. [DOI] [PMC free article] [PubMed] [Google Scholar]
- 11.Neville GA, Mori F, Holme KR, Perlin AS. Monitoring the purity of pharmaceutical heparin preparations by high-field 1H-nuclear magnetic resonance spectroscopy. J. Pharm. Sci. 1989;78:101–104. doi: 10.1002/jps.2600780205. [DOI] [PubMed] [Google Scholar]
- 12.Volpi N, Maccari F, Linhardt RJ. Capillary electrophoresis of complex natural polysaccharides. Electrophoresis. 2008;29:3095–3106. doi: 10.1002/elps.200800109. [DOI] [PMC free article] [PubMed] [Google Scholar]
- 13.Maruyama T, Toida T, Imanari T, Yu G, Linhardt RJ. Conformational changes and anticoagulant activity of chondroitin sulfate following its O-sulfonation. Carbohydr. Res. 1998;306:35–43. doi: 10.1016/s0008-6215(97)10060-x. [DOI] [PubMed] [Google Scholar]
- 14.Anumula KR. Quantitative determination of monosaccharides in glycoproteins by high-performance liquid chromatography with highly sensitive fluorescence detection. Anal. Biochem. 1994;220:275–283. doi: 10.1006/abio.1994.1338. [DOI] [PubMed] [Google Scholar]
- 15.Biopharmaceutics Coordinating Committee in the Center for Drug Evaluation and Research (CDER) in cooperation with the Center for Veterinary Medicine (CVM) at the Food and Drug Administration. Guidance for Industry. Bioanalytical Method Validation. 2001 May [Google Scholar]
- 16.Buzzega D, Maccari F, Volpi N. Fluorophore-assisted carbohydrate electrophoresis for the determination of molecular mass of heparins and low-molecular-weight (LMW) heparins. Electrophoresis. 2008;29:4192–4202. doi: 10.1002/elps.200800165. [DOI] [PubMed] [Google Scholar]
- 17.Ruiz-Calero V, Puignou L, Galceran MT. Analysis of glycosaminoglycan monosaccharides by capillary electrophoresis using indirect laser-induced fluorescence detection. J. Chromatogr. A. 2000;873:269–282. doi: 10.1016/s0021-9673(99)01283-2. [DOI] [PubMed] [Google Scholar]
- 18.Racaityte K, Kiessig S, Kálmán F. Application of capillary zone electrophoresis and reversed-phase high-performance liquid chromatography in the biopharmaceutical industry for the quantitative analysis of the monosaccharides released from a highly glycosylated therapeutic protein. J. Chromatogr. A. 2005;1079:354–365. doi: 10.1016/j.chroma.2005.03.080. [DOI] [PubMed] [Google Scholar]
- 19.Sato K, Sato K, Okubo A, Yamazaki S. Determination of monosaccharides derivatized with 2-aminobenzoic acid by capillary electrophoresis. Anal. Biochem. 1997;251:119–121. doi: 10.1006/abio.1997.2266. [DOI] [PubMed] [Google Scholar]
- 20.Sato K, Sato K, Okubo A, Yamazaki S. Separation of 2-aminobenzoic acid-derivatized glycosaminoglycans and asparagine-linked glycans by capillary electrophoresis. Anal. Sci. 2005;21:21–24. doi: 10.2116/analsci.21.21. [DOI] [PubMed] [Google Scholar]
- 21.Drummond KJ, Yates EA, Turnbull JE. Electrophoretic sequencing of heparin/heparan sulfate oligosaccharides using a highly sensitive fluorescent end label. Proteomics. 2001;1:304–310. doi: 10.1002/1615-9861(200102)1:2<304::AID-PROT304>3.0.CO;2-B. [DOI] [PubMed] [Google Scholar]
- 22.Volpi N. Capillary electrophoresis determination of glucosamine in nutraceutical formulations after labeling with anthranilic acid and UV detection. J. Pharm. Biomed. Anal. doi: 10.1016/j.jpba.2009.01.006. In Press. [DOI] [PubMed] [Google Scholar]


