Abstract.
We report the development of photoacoustic flowmetry assisted by high-intensity focused ultrasound (HIFU). This novel method employs HIFU to generate a heating impulse in the flow medium, followed by photoacoustic monitoring of the thermal decay process. Photoacoustic flowmetry in a continuous medium remains a challenge in the optical diffusive regime. Here, both the HIFU heating and photoacoustic detection can focus at depths beyond the optical diffusion limit ( in soft tissue). This method can be applied to a continuous medium, i.e., a medium without discrete scatterers or absorbers resolvable by photoacoustic imaging. Flow speeds up to have been experimentally measured in a blood phantom covered by 1.5-mm-thick tissue.
Keywords: photoacoustic microscopy, flow, thermal clearance, high-intensity focused ultrasound, deep imaging
1. Introduction
Photoacoustic imaging has many unique attributes, making it well suited for broad biomedical applications. Recently, photoacoustic sensing and imaging of blood flow have attracted growing interest.1–10 Compared with other flow measurement techniques, such as laser11 or ultrasound12 Doppler flowmetry, the photoacoustic approach has the following two advantages. First, photoacoustic flowmetry is 100% sensitive to optical absorption,13 rather than scattering, which potentially provides a high contrast-to-noise ratio for sensing blood in the visible and near-infrared spectral region. Second, photoacoustic flowmetry can be readily integrated with anatomical, functional, and metabolic photoacoustic imaging modes, providing naturally coregistered imaging of vasculature,14–16 hemoglobin concentration,17 oxygen saturation,18–22 and blood flow,21,22 as well as sensing of oxygen metabolic rate.23,24
Since optical-resolution photoacoustic microscopy (OR-PAM) has high spatial resolution to resolve single red blood cells (RBCs), the photoacoustic signal fluctuations induced by the RBCs flowing can be clearly sensed by OR-PAM. OR-PAM–based flowmetry has successfully demonstrated in vivo blood flow measurement in the ballistic and quasi-ballistic regimes.4,23 However, none of these methods have succeeded in quasi-diffusive and diffusive regimes, where photoacoustic imaging modalities provide acoustic spatial resolutions. Although ultrasound speckles can be used to measure blood flow, photoacoustic speckles are weak in images of whole blood.25,26 Thus, photoacoustic speckles have not been used to measure blood flow. Therefore, label-free photoacoustic flow sensing in deep tissue remains a challenge.
Recently, Sheinfeld and Eyal demonstrated a photoacoustic flow sensing method based on thermal clearance.9,27 In this method, modulated photothermal heating was used to induce temperature variation in the flow medium. Because flow accelerated thermal transfer, the flow speed was measured from the temperature-dependent photoacoustic signals. An advantage of this method is that, unlike Doppler flowmetry, the thermal clearance method does not require heterogeneity of the flow medium. However, because photothermal heating cannot be confined in deep tissue, it is difficult for this method to achieve high-resolution flow measurement at depths in the optical diffusive regime.
Here we present a new flow measurement method based on high-intensity focused ultrasound (HIFU) heating and pulsed photoacoustic imaging of thermal decay. An HIFU transducer applies a heating impulse to a volume of the flow medium. Temperature-dependent photoacoustic signals from the heated volume are measured by an acoustic-resolution photoacoustic microscope (AR-PAM) with a 2-kHz laser repetition rate. The flow speed is determined from the temporal profile of the photoacoustic signal. The combination of HIFU heating and pulsed photoacoustic detection provides several advantages to flow measurement. First, both the heating and the detection maintain tight acoustic focusing in deep flow sensing. Second, the photoacoustic signal is generated from optical absorption and thus has a clean background in blood flow measurement. Third, the photoacoustic effect is inherently sensitive to temperature. Fourth, this method does not rely on discrete scatterers or absorbers and can be potentially applied to homogeneous flow media. Fifth, the HIFU heating and photoacoustic detection can be potentially performed by a single piezoelectric transducer, producing naturally confocal acoustic heating and detection. Last, the pulsed mode of photoacoustic imaging provides axial resolution.
2. Method
The ultrasound-heated photoacoustic flow measurement starts with a focused HIFU heating impulse in a small volume of the flowing medium and then uses an AR-PAM28 to monitor the decay of the temperature-dependent photoacoustic signal. Here, we first describe the temperature decay process using a simplified heat transfer model; then we introduce the time-domain photoacoustic temperature sensing method.
2.1. Heat Transfer Model
With an HIFU heating impulse in a volume of mass, the local temperature increases from its baseline (the temperature before heating) by , where is the spatial coordinates, and is the time point when HIFU stops heating.
With the initial condition of , the thermal decay process can be described by the following equation:9,29
| (1) |
where time ; is the thermal diffusivity; and is the flow speed. The left hand side of Eq. (1) is the temporal variation of the temperature. The first term on the righthand side of Eq. (1) represents heat decay due to thermal conduction, and the second term describes heat convection due to flow. For simplicity, we neglect other heating effects that are not induced by HIFU, e.g., metabolic heating or environmental temperature change. Although the heating effect from photoacoustic laser excitation may be significant, it can be controlled via two approaches. One is to decrease excitation laser power. The other is to keep photoacoustic detection on for a long enough time period so that the flow medium reaches an equilibrium state before the flow measurements.
As in Ref. 9, we simplify Eq. (1) using a lumped model.9,30 A measurement-dependent weight function is employed to average the temperature within the measured volume. Applying a weighted spatial integration to Eq. (1), we obtain
| (2) |
where represents the measured volume, and . Here, we define as a weighted average temperature and use it to represent the temperature of the measured volume. Using the definition of , Eq. (2) can be rewritten as
| (3) |
Here, we assume is independent of time, which means a time-invariant relative temperature distribution within the measured volume. Then, the term in in Eq. (3) becomes a constant. Thus, the solution of Eq. (3) gives
| (4) |
| (5) |
| (6) |
The decay constant consists of two parts: is related to thermal diffusivity, and is associated with flow speed. If the thermal diffusivity and flow speed are assumed to be uniform within the measured volume, becomes proportional to the diffusivity and becomes proportional to the flow speed.
The assumptions of time-invariant relative temperature distribution and uniform flow speed can be experimentally validated by fitting the temperature decay to an elevated exponential curve (i.e., a baseline plus an exponential function). Nevertheless, these assumptions are more accurate for smaller measurement volumes.
2.2. Photoacoustic Temperature Sensing
Photoacoustic imaging has demonstrated high sensitivities and great imaging depths in temperature measurement.31,32 Here we use an AR-PAM to monitor the temperature decay curve following the HIFU heating.
When the laser excitation is in both thermal and stress confinements, the initial photoacoustic amplitude is governed by33
| (7) |
where is the detected photoacoustic amplitude, is a constant factor related to the system detection efficiency; is the Grueneisen parameter; is the percentage of absorbed light energy that is converted to heat; is the optical absorption coefficient, and is the local optical fluence. We assume all parameters on the righthand side of Eq. (7), except , are time invariant. The slow time here denotes the time of each photoacoustic measurement instead of the acoustic time of arrival (i.e., the fast time).
The Grueneisen parameter is temperature dependent and can be approximated with an empirical formula.
| (8) |
where and are constants. Substituting Eq. (8) into Eq. (7), we have
| (9) |
Here, we employ another weight function to integrate the photoacoustic signal over the measured volume, so that the integrated signal equals to the AR-PAM measurement , which is expressed as
| (10) |
Substituting Eq. (9) into Eq. (10), we have
| (11) |
Since we have assumed is time independent, the coefficient of on the right hand side of Eq. (11) is a constant. Substituting Eq. (4) into Eq. (11), we have
| (12) |
where and are constants. Therefore, fitting the temporal profile of the photoacoustic amplitude to Eq. (12) gives a decay constant that is linearly related to the flow speed if the thermal diffusivity is constant.
3. Experimental Setup
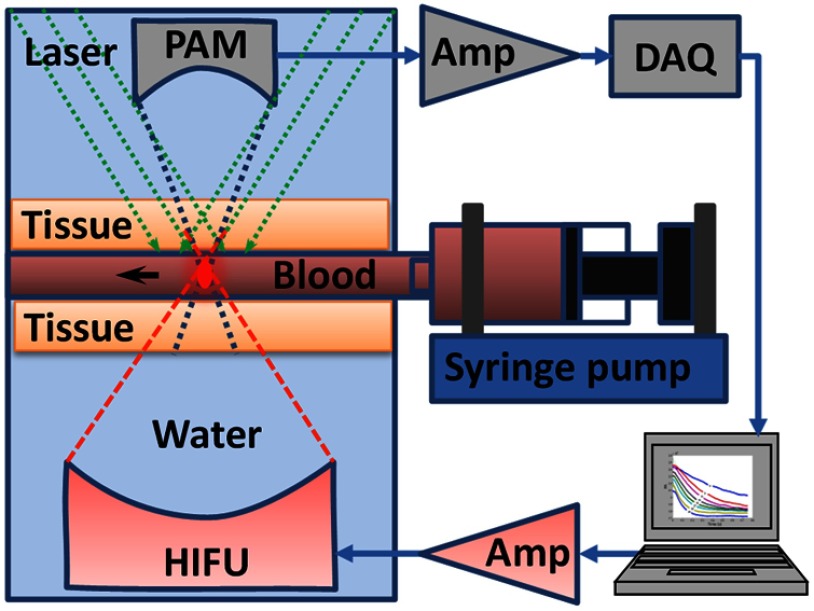
We measured lysed bovine blood (Quad Five, Ryegate, Montana) flowing in a silicone tube (0.5 mm inner diameter; Dow Corning, Midland, Michigan). As shown in Fig. 1, a syringe pump (BSP-99M; Braintree Scientific, Braintree, Massachusetts) was used to set different flow speeds in the tube. The tube was sandwiched by two pieces of 1.5-mm-thick chicken breast tissue. In each measurement, an HIFU transducer heated up a small volume of blood for 300 ms; then an AR-PAM started to acquire the temperature-dependent photoacoustic signals.
Fig. 1.
Schematic of the experimental setup of ultrasound-heated photoacoustic flow measurement. Amp, amplifier.
The HIFU transducer (Ferroperm Piezoceramic Inc.) was placed in water and focused on a small volume of blood in the tube. The transducer operated at a frequency of 7.44 MHz. The acoustic numerical aperture NA was 0.81. At room temperature (20°C), the HIFU heating area is estimated using an airy disk with a diameter of 300 μm [; , sound speed in water, ]. The input power of the HIFU transducer was 10 W. If the power conversion efficiency is 100%, the HIFU intensity at the focus was . Given a typical soft-tissue diffusivity of , the characteristic dimension of the heated region was estimated to be 197 μm.
The AR-PAM probe28 was deployed on the opposite side and focused coaxially and confocally with the HIFU transducer. A detailed description of the AR-PAM system can be found in Ref. 28. Here we briefly introduce several key parameters of the AR-PAM. A 523-nm pulsed laser (INNOSLAB; EdgeWave GmbH, Wurselen, Germany) was used to excite the blood and generate ultrasound waves. The laser had a typical pulse width of 5 ns and operated at 2-kHz pulse repetition rate. The laser energy delivered on the tissue surface was 60 μJ per pulse. The optical fluence on the tissue surface was , which was within the ANSI safety limit.34 Photoacoustic waves were detected by a 50-MHz broadband ultrasound transducer (V214 BC, Olympus NDT). The ultrasound lens had an NA of 0.5. The photoacoustic detection had an estimated focal area with a full-width-at-half-maximum diameter of 42 μm [; ; ; ). The raw photoacoustic signals were amplified by 48 dB and digitized at 500 MHz.
4. Results and Discussion
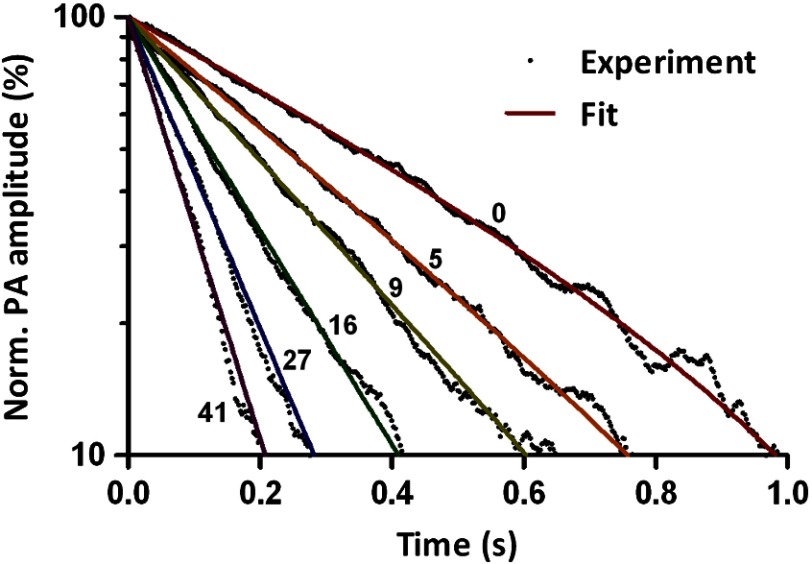
In order to validate Eq. (12), we measured thermal decay under blood flow speeds varied from 0 to . After each HIFU heating impulse, photoacoustic signals were acquired for 1 s. Upon each laser pulse, a time-resolved photoacoustic signal was recorded as an A-line. The peak-to-peak amplitude of each A-line was computed to quantify the thermal decay processes. To reduce noise, the peak-to-peak amplitudes of every five A-lines were averaged as one data point. Figure 2 shows several representative thermal decay curves at different flow speeds. Each curve in Fig. 2 was normalized to its maximum value and averaged over 10 measurements. Elevated-exponential fitting gives an average coefficient of determination () of 0.996 with a standard deviation of 0.004 ( curves). This result shows that Eq. (12) is an accurate model to describe the thermal decay process. Note that the 300-ms ultrasound heating is not an ideal impulse. However, even at a flow speed of , the experimental results in Fig. 2 agree well with the heat transfer model, which shows that the model is robust to the heating impulse time. If experimental data start to deviate from the model at higher flow speeds, a shorter heating pulse with higher power should be used.
Fig. 2.
Representative thermal decay curves acquired with different blood flow speeds.
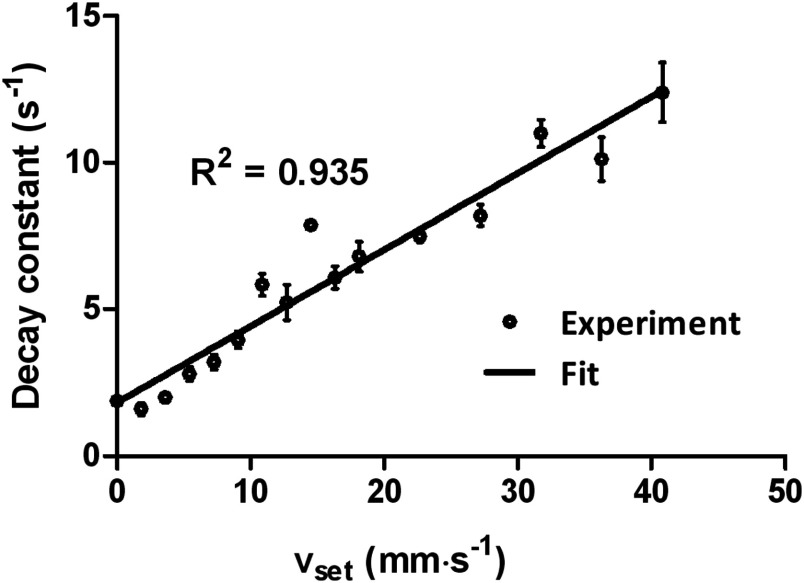
The decay constant at each flow speed was obtained from the elevated-exponential fitting. With the assumption of uniform flow within the measured volume, the decay constant is linearly related to the flow speed. Figure 3 plots a fitted linear regression model of
| (13) |
where and are system-dependent constants, and is also related to thermal diffusivity. If the system and the thermal diffusivity do not change with time, the linear model can be used to convert measured decay constants to flow speeds. The parameter is determined by the sizes of both the ultrasound heating spot and the photoacoustic detection voxel. Since the speed of sound remains relatively constant among soft tissues,35 the acoustic voxel size should not change significantly in different types of soft tissues. For in vivo flow measurements, the parameter can be calibrated for with a tissue-mimicking phantom at each depth of interest. The parameter may be either measured by temporarily stopping the blood flow when cuffing is applicable or estimated by ex vivo calibration.
Fig. 3.
Exponential decay constant versus set flow speed (). Error bars represent standard errors. The flow speeds are labeled on each curve with units of . Norm, normalized.
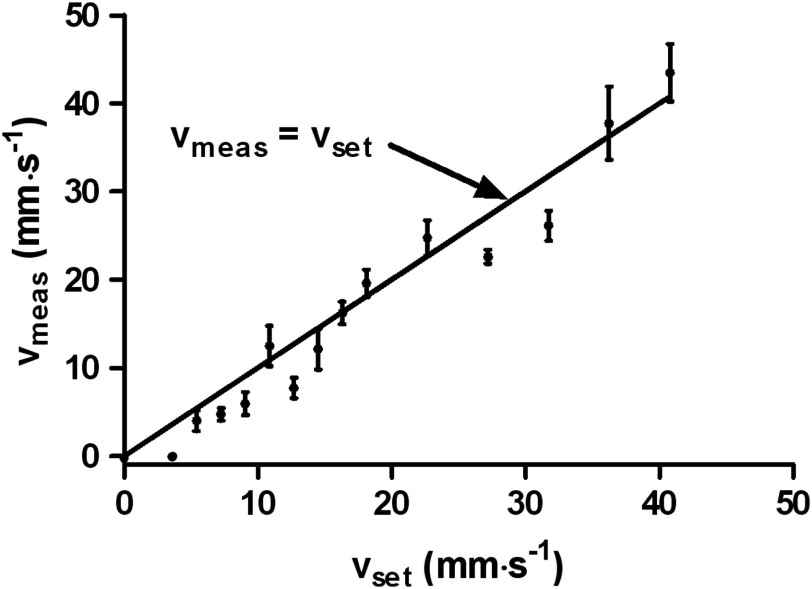
Another flow measurement was carried out with the same setup (Fig. 4). Using the linear regression model obtained from results shown in Fig. 3, we computed the flow speed from the fitted decay constant. A linear relationship clearly exists between the measured flow speed () and the set flow speed (). The flow measurement accuracy was quantified by the root-mean-square deviation of . This accuracy can be further improved by increasing either the single measurement signal-to-noise ratio or averaging.
Fig. 4.
Measured flow speed () versus set flow speed (). Error bars represent standard errors.
Note that the flow speed is measured from the thermal decay constant, which is related to the motion of all substances in the flow medium. For example, for whole blood, the measured flow speed is an average value from blood cells, plasma, and others. By contrast, optical or ultrasound Doppler flowmetry can only sense the flow speed of scatterers, e.g., blood cells.
Temperature rise due to HIFU heating was estimated from the photoacoustic signal increase. The peak temperature rise was 3.7°C at flow speed, and 7.6°C at zero flow speed.31,36,37 These temperature increases were almost an order of magnitude lower than that in HIFU therapy.38 In addition, after the HIFU heating impulse, the temperature rapidly recovered to its baseline. Therefore, the HIFU heating should be safe for in vivo measurements. If an even lower temperature rise is desired, the power of single HIFU heating can be further reduced, and more averages can be used to improve flow measurement accuracy. Another possibility is to employ modulated continuous HIFU heating, rather than heating impulse, which can further decrease the peak temperature.
To demonstrate the methodology, we employed the HIFU transducer and the AR-PAM in transmission mode. For in vivo flow sensing, it is preferred to implement HIFU heating and photoacoustic detection in reflection mode, which will be our future work.
The current system does not measure flow directions, which can be potentially addressed by slightly modifying the current method. For example, the heating beam can be fixed at one spot, and the photoacoustic detection beam can be placed either upstream or downstream with respect to the heating spot, so that the flow direction can be computed from the relationship between the two measurements.
Light at the wavelength of 523 nm is highly absorptive and has a limited penetration depth in blood. The measured flow speed is an average value within the optical penetration depth. Ideally, longer wavelengths around 700 nm can be used to provide deeper penetration into both scattering tissues and blood vessels for in vivo measurements. Nevertheless, the method remains the same.
5. Conclusion
To summarize, we present a new ultrasound-heated photoacoustic flow measurement method. An HIFU transducer provides localized heating impulse. AR-PAM detects the flow-related thermal decay constant. A theoretical relationship between the photoacoustic amplitude and flow speed is derived. Blood flow speeds up to were experimentally measured in a silicone tube covered by 1.5-mm-thick tissue. Experimental results agree well with the theoretical model and demonstrate the feasibility of deep flow sensing. Unlike ultrasound Doppler flowmetry, this method does not rely on signals from discrete scatterers or absorbers and, therefore, can be applied to homogeneous continuous media.
Acknowledgments
The authors appreciate Professor Sandra Matteucci’s help with editing the manuscript. This work was sponsored by National Institute of Health (NIH) grants R01 EB000712, R01 EB008085, R01 CA134539, U54 CA136398, R01 CA157277, R01 CA159959, and DP1 EB016986 (NIH Director’s Pioneer Award). Lihong Wang has a financial interest in Endra Inc., and Microphotoacoustics Inc., which did not support this work. Konstantin Maslov has a financial interest in Microphotoacoustics Inc., which did not support this work.
References
- 1.Chen-Wei W., et al. , “Photoacoustic flow measurements based on wash-in analysis of gold nanorods,” IEEE Trans. Ultrason., Ferroelectr., Freq. Control 54(6), 1131–1141 (2007). 10.1109/TUFFC.2007.367 [DOI] [PubMed] [Google Scholar]
- 2.Fang H., Maslov K., Wang L. V., “Photoacoustic Doppler effect from flowing small light-absorbing particles,” Phys. Rev. Lett. 99(18), 184501 (2007). 10.1103/PhysRevLett.99.184501 [DOI] [PubMed] [Google Scholar]
- 3.Sheinfeld A., Gilead S., Eyal A., “Simultaneous spatial and spectral mapping of flow using photoacoustic Doppler measurement,” J. Biomed. Opt. 15(6), 066010 (2010). 10.1117/1.3509113 [DOI] [PubMed] [Google Scholar]
- 4.Yao J., et al. , “In vivo photoacoustic imaging of transverse blood flow by using Doppler broadening of bandwidth,” Opt. Lett. 35(9), 1419–1421 (2010). 10.1364/OL.35.001419 [DOI] [PMC free article] [PubMed] [Google Scholar]
- 5.Sheinfeld A., Gilead S., Eyal A., “Photoacoustic Doppler measurement of flow using tone burst excitation,” Opt. Express 18(5), 4212–4221 (2010). 10.1364/OE.18.004212 [DOI] [PubMed] [Google Scholar]
- 6.Ma S., Yang S., Xing D., “Photoacoustic imaging velocimetry for flow-field measurement,” Opt. Express 18(10), 9991–10000 (2010). 10.1364/OE.18.009991 [DOI] [PubMed] [Google Scholar]
- 7.Brunker J., Beard P., “Pulsed photoacoustic Doppler flowmetry using a cross correlation method,” Proc. SPIE 7564, 756426 (2010). 10.1117/12.841760 [DOI] [PubMed] [Google Scholar]
- 8.Wang L., et al. , “Fast voice-coil scanning optical-resolution photoacoustic microscopy,” Opt. Lett. 36(2), 139–141 (2011). 10.1364/OL.36.000139 [DOI] [PMC free article] [PubMed] [Google Scholar]
- 9.Sheinfeld A., Eyal A., “Photoacoustic thermal diffusion flowmetry,” Biomed. Opt. Express 3(4), 800–813 (2012). 10.1364/BOE.3.000800 [DOI] [PMC free article] [PubMed] [Google Scholar]
- 10.Brunker J., Beard P., “Pulsed photoacoustic Doppler flowmetry using time-domain cross-correlation: accuracy, resolution and scalability,” J. Acoust. Soc. Am. 132(3), 1780–1791 (2012). 10.1121/1.4739458 [DOI] [PubMed] [Google Scholar]
- 11.Nilsson G. E., Tenland T., Oberg P. A., “Evaluation of a laser Doppler flowmeter for measurement of tissue blood flow,” IEEE Trans. Biomed. Eng. BME-27(10), 597–604 (1980). 10.1109/TBME.1980.326582 [DOI] [PubMed] [Google Scholar]
- 12.Franklin D. L., Schlegel W., Rushmer R. F., “Blood flow measured by Doppler frequency shift of back-scattered ultrasound,” Science 134(3478), 564–565 (1961). 10.1126/science.134.3478.564 [DOI] [PubMed] [Google Scholar]
- 13.Wang L. V., Hu S., “Photoacoustic tomography: in vivo imaging from organelles to organs,” Science 335(6075), 1458–1462 (2012). 10.1126/science.1216210 [DOI] [PMC free article] [PubMed] [Google Scholar]
- 14.Zhang E. Z., et al. , “In vivo high-resolution 3D photoacoustic imaging of superficial vascular anatomy,” Phys. Med. Biol. 54(4), 1035 (2009). 10.1088/0031-9155/54/4/014 [DOI] [PubMed] [Google Scholar]
- 15.Yao J., et al. , “Wide-field fast-scanning photoacoustic microscopy based on a water-immersible MEMS scanning mirror,” J. Biomed. Opt. 17(8), 080505 (2012). 10.1117/1.JBO.17.8.080505 [DOI] [PMC free article] [PubMed] [Google Scholar]
- 16.Xia J., et al. , “Whole-body ring-shaped confocal photoacoustic computed tomography of small animals in vivo,” J. Biomed. Opt. 17(5), 050506 (2012). 10.1117/1.JBO.17.5.050506 [DOI] [PMC free article] [PubMed] [Google Scholar]
- 17.Wang X., et al. , “Noninvasive laser-induced photoacoustic tomography for structural and functional in vivo imaging of the brain,” Nat. Biotechnol. 21(7), 803–806 (2003). 10.1038/nbt839 [DOI] [PubMed] [Google Scholar]
- 18.Laufer J., et al. , “In vitro measurements of absolute blood oxygen saturation using pulsed near-infrared photoacoustic spectroscopy: accuracy and resolution,” Phys. Med. Biol. 50(18), 4409 (2005). 10.1088/0031-9155/50/18/011 [DOI] [PubMed] [Google Scholar]
- 19.Zhang H. F., et al. , “Functional photoacoustic microscopy for high-resolution and noninvasive in vivo imaging,” Nat. Biotechnol. 24(7), 848–851 (2006). 10.1038/nbt1220 [DOI] [PubMed] [Google Scholar]
- 20.Bauer A. Q., et al. , “Quantitative photoacoustic imaging: correcting for heterogeneous light fluence distributions using diffuse optical tomography,” J. Biomed. Opt. 16(9), 096016 (2011). 10.1117/1.3626212 [DOI] [PMC free article] [PubMed] [Google Scholar]
- 21.Rowland K. J., et al. , “Immediate alterations in intestinal oxygen saturation and blood flow after massive small bowel resection as measured by photoacoustic microscopy,” J. Pediatr. Surg. 47(6), 1143–1149 (2012). 10.1016/j.jpedsurg.2012.03.020 [DOI] [PMC free article] [PubMed] [Google Scholar]
- 22.Krumholz A., et al. , “Functional photoacoustic microscopy of diabetic vasculature,” J. Biomed. Opt. 17(6), 060502 (2012). 10.1117/1.JBO.17.6.060502 [DOI] [PMC free article] [PubMed] [Google Scholar]
- 23.Yao J., et al. , “Label-free oxygen-metabolic photoacoustic microscopy in vivo,” J. Biomed. Opt. 16(7), 076003 (2011). 10.1117/1.3594786 [DOI] [PMC free article] [PubMed] [Google Scholar]
- 24.Liu T., et al. , “Combined photoacoustic microscopy and optical coherence tomography can measure metabolic rate of oxygen,” Biomed. Opt. Express 2(5), 1359–1365 (2011). 10.1364/BOE.2.001359 [DOI] [PMC free article] [PubMed] [Google Scholar]
- 25.Guo Z., Li L., Wang L. V., “On the speckle-free nature of photoacoustic tomography,” Med. Phys. 36(9), 4084–4088 (2009). 10.1118/1.3187231 [DOI] [PMC free article] [PubMed] [Google Scholar]
- 26.Guo Z., Xu Z., Wang L. V., “Dependence of photoacoustic speckles on boundary roughness,” J. Biomed. Opt. 17(4), 046009 (2012). 10.1117/1.JBO.17.4.046009 [DOI] [PMC free article] [PubMed] [Google Scholar]
- 27.Sheinfeld A., Eyal A., “Doppler photoacoustic and Doppler ultrasound in blood with optical contrast agent,” Proc. SPIE 8581, 85810S (2013). 10.1117/12.2000906 [DOI] [Google Scholar]
- 28.Maslov K., Stoica G., Wang L. V., “In vivo dark-field reflection-mode photoacoustic microscopy,” Opt. Lett. 30(6), 625–627 (2005). 10.1364/OL.30.000625 [DOI] [PubMed] [Google Scholar]
- 29.Datta A. K., “Governing equation and boundary conditions of heat transfer,” in Biological and Bioenvironmental Heat and Mass Transfer, pp. 235–266, CRC Press, New York, NY: (2002). [Google Scholar]
- 30.Holman J. P., Heat Transfer, 10th ed., pp. 205–253, McGraw Hill Higher Education, Boston, NY: (2010). [Google Scholar]
- 31.Shah J., et al. , “Photoacoustic imaging and temperature measurement for photothermal cancer therapy,” J. Biomed. Opt. 13(3), 034024 (2008). 10.1117/1.2940362 [DOI] [PMC free article] [PubMed] [Google Scholar]
- 32.Pramanik M., Wang L. V., “Thermoacoustic and photoacoustic sensing of temperature,” J. Biomed. Opt. 14(5), 054024 (2009). 10.1117/1.3247155 [DOI] [PMC free article] [PubMed] [Google Scholar]
- 33.Wang L. V., Wu H.-I., Biomedical Optics: Principles and Imaging, John Wiley & Sons Inc., New Jersey: (2007). [Google Scholar]
- 34.“American National Standard for the Safe Use of Lasers, ANSI Standard Z136.1,” American National Standards Institute, Inc., Washington, DC : (2000). [Google Scholar]
- 35.Nasoni R. L., et al. , “In vivo temperature dependence of ultrasound speed in tissue and its application to noninvasive temperature monitoring,” Ultrason. Imaging 1(1), 34–43 (1979). 10.1177/016173467900100103 [DOI] [PubMed] [Google Scholar]
- 36.Irina V. L., Kirill V. L., Rinat O. E., “Real-time optoacoustic monitoring of temperature in tissues,” J. Phys. D Appl. Phys. 38(15), 2633 (2005). 10.1088/0022-3727/38/15/015 [DOI] [Google Scholar]
- 37.Gao L., et al. , “Single-cell photoacoustic thermometry,” J. Biomed. Opt. 18(2), 026003 (2013). 10.1117/1.JBO.18.2.026003 [DOI] [PMC free article] [PubMed] [Google Scholar]
- 38.Ter G. R., et al. , “Trackless surgery using focused ultrasound: technique and case report,” Minim. Invasive Ther. Allied Technol. 1(1), 13–19 (1991). 10.3109/13645709109152791 [DOI] [Google Scholar]


