Abstract.
We have developed a reflection-based capability of the RetCam® platform, an FDA-cleared pediatric retinal-imaging instrument, for the purpose of measuring macular pigment levels as well as their spatial distributions in infants and children. Our modifications include narrow-band blue-wavelength excitation of the macular pigment absorption in combination with spectrally selective blue-wavelength readout of the reflection signals received by the instrument’s CCD detector array. Furthermore, an algorithm is developed that allows the computation of optical density maps for the macular pigment relative to peripheral retinal areas. This made it possible for the first time to directly measure macular pigment levels and their spatial features in the developing human retina. In contrast to adults, infants with measurable pigment levels had almost exclusively a narrow, circularly symmetric, pigment distribution. The described methodology holds promise for future investigations into the role of macular pigment in the developing human retina and the effect of dietary interventions in diseases resulting from a lack of normal carotenoid levels.
Keywords: macular pigment, carotenoids, reflection spectroscopy, retinal imaging, newborns
1. Introduction
The healthy adult human retina contains high concentrations of blue-light-absorbing carotenoid compounds in its macular region, which is the central tissue location concentrated with the cone photoreceptors that are responsible for high-acuity color vision. Known as macular pigment, MP, they are constituted of three carotenoid compounds: lutein, zeaxanthin, and meso-zeaxanthin, are located anterior to the photoreceptor outer segments and the retinal pigment epithelium (RPE),1,2 and are therefore thought to shield these vulnerable tissues from light-induced damage by effectively absorbing the photoionizing short wavelengths of ambient light otherwise reaching the deeper retinal layers. The MP carotenoids are also thought to directly protect the tissue cells in their immediate vicinity through their well-known function as antioxidants. Much research carried out over the last two decades has investigated the role of the macular carotenoids in the prevention of age-related macular degeneration (AMD),3–5 and more recently also their role in the improvement of visual acuity via reduction of deleterious glare effects is investigated.6
MP is very likely to play an important role also in early phases of foveal development, in the enhancement of infant visual acuity, and in the protection against light-induced oxidative damage,7 and it may be essential also for the development and/or maintenance of a normal distribution of RPE cells.8 Furthermore, the development of AMD in the elderly is potentially linked to phototoxic light exposure and oxidative stress accumulated over the lifetime, including the childhood years,9 in which oxidation-induced, potentially harmful, photosensitive compounds such as lipofuscin can already be generated in high concentrations.10 Without knowledge of normal MP levels and their spatial distributions in infants and children, further progress on their potentially beneficial roles cannot proceed. Motivated by this challenge, we have developed a novel reflection-based capability of the RetCam® platform, an FDA-cleared pediatric retinal-imaging instrument (Clarity Medical Systems, Pleasanton, California) widely used for the collection of fundus images of the infant retina for general tissue health diagnostics purposes, new for the purpose of measuring macular pigment levels as well as their spatial distributions in infants and children.
Several methodologies for optical MP assessment exist already for adults including the widely used psychophysical method of heterochromatic flicker photometry,11 and three quantitative imaging methods based on direct detection of the MP carotenoids via resonance Raman spectroscopy (RRS),12,13 indirect detection via lipofuscin fluorescence excitation spectroscopy, also known as “autofluorescence” spectroscopy,14,15 and detection via fundus reflection spectroscopy (FRS).16–18 A reflection-based imaging approach with blue-light excitation is implemented in a commercially available fundus camera (Visucam, Zeiss Meditec, Jena Germany).19 However, none of the described methodologies is applicable to infants, since besides the lack of FDA clearance for any of the corresponding platforms, infants are either not able to participate in the measurement or they would be exposed to risky high-laser light intensities in view of the anticipated low MP levels (RRS and laser-based FRS).
2. Reflection-Based Imaging with the RetCam®
The RetCam® is a fully integrated digital imaging system permitting the capture of wide-field, high-resolution, video streams of the infant retina, which facilitates optimum visualization of topographic retinal features. Importantly, it also offers the possibility to capture and store high-resolution still images. A useable RetCam® fundus image can be obtained within a few minutes in the anesthetized infant eye. The instrument is fiber-coupled to hand-held light delivery and collection modules that are brought in direct contact with the cornea of the infant. The contact module routes the excitation light in a peripheral, ring-shaped, illumination geometry to a detachable front lens and detects the reflected light with a centrally positioned CCD camera. An ophthalmic coupling gel is used to fill any remaining spatial gaps between the contact module’s front lens and the subject’s cornea. Front lenses with varying focal lengths exist to achieve, respectively, 30, 80, 120, or 130 deg fields-of-view of the retina. The CCD camera consists of a dispersive 3-chip configuration, “RGB triplet,” with each spatially separated array having enhanced sensitivity in either the red (“R-chip”), green (“G-chip”), or blue (“B-chip”) spectral range.20 Two optional light sources exist for excitation, a tungsten-halogen (“white-light source”) and a blue-filtered xenon arc lamps (“blue-light source”). The first one is typically used for general white-light fundus reflection imaging, and the latter, in combination with a blue-light suppressing barrier filter, for fluorescein angiography. The relatively high power levels for the continuous excitation light sources result in temporary bleaching of the vast majority of photoreceptor pigments.
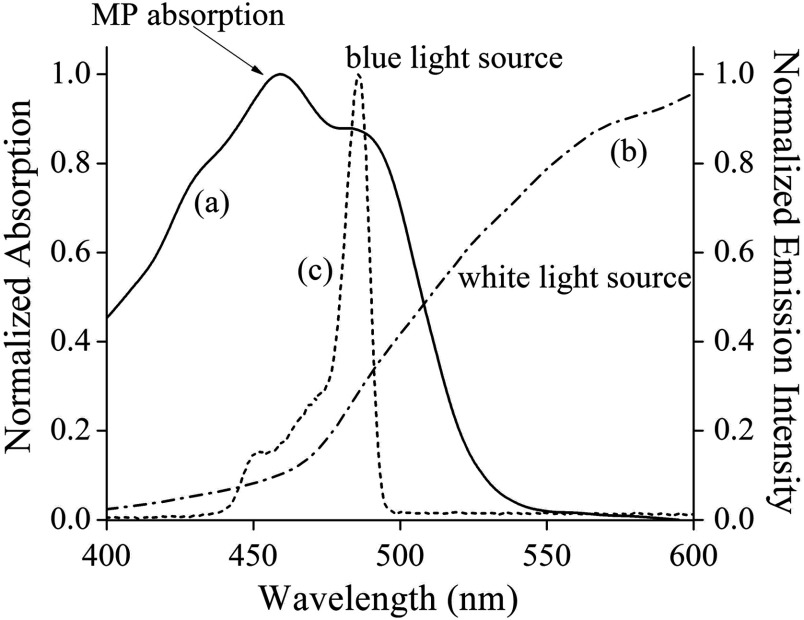
The emission spectra of the two light sources, measured with a high-resolution spectrograph, are shown in Fig. 1, along with the absorption spectrum of MP in excised retinal tissue. The emission spectrum of the blue-filtered continuous xenon arc lamp, peaking near 485 nm, has a high-spectral overlap with the MP absorption, which reaches maximum strength at but still has strong vibronic sidebands near 430 and 490 nm.2,12 Since the emission spectrum of the blue-light source is much narrower than the MP absorption band, it is well suited for highly wavelength-selective blue-light reflection imaging of MP in a detection scheme where the instrument’s fluorescein angiography blue barrier filter is simply removed.
Fig. 1.
Absorption spectrum of macular pigment (MP) and emission spectra of light sources provided in RetCam® platform. (a) Absorption spectrum of MP in excised retinal tissue, featuring characteristic maximum near 460 nm and vibronic sidebands near 430 and 490 nm; (b) unfiltered emission spectrum of halogen lamp “white-light source;” and (c) emission spectrum of blue-filtered continuous xenon arc lamp, peaking near 485 nm.
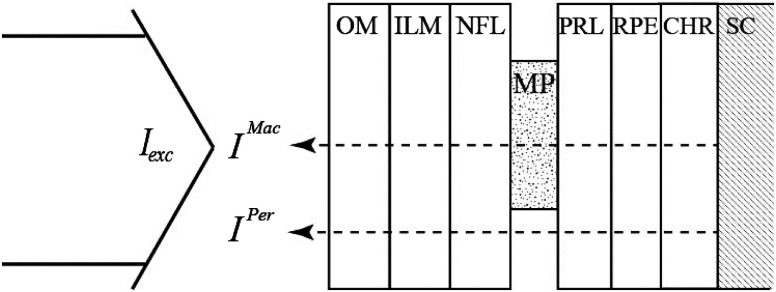
The MP detection concept is illustrated in Fig. 2. As customary in a simplified FRS scheme, we assume that the excitation light, , traverses all anterior ocular media and the retinal layer system toward the sclera, where it is reflected, and that it subsequently traverses all layers again in a 180-deg detection geometry. After traversing the MP-containing central region, the detected light intensity is, in general, given by
| (1) |
where the s are, respectively, the transmission of anterior optical media (OM), the MP-containing layer, the photoreceptor layer (PRL), the RPE, and the choroid (CHR). All the transmissions are squared due to the double-path light propagation. is the reflection at the sclera and is assumed to be constant across the sclera including macular and peripheral sclera regions. is the fluorescence intensity originating from the ocular media (mostly from the crystalline lens) at fluorescence wavelengths, , that are longer than the excitation wavelength, and the fluorescence intensities of chromophores in the RPE layers such as lipofuscin.
Fig. 2.
Schematic representation of the excitation and reflection light paths through the retinal layer system involved in our in vivo reflection-based measurements of MP in the infant retina. OM, ocular media; ILM, inner limiting membrane; NFL, nerve fiber layer; MP, macular pigment containing area; PRL, photoreceptor layer; RPE, retinal pigment epithelium; CHR, choroid; SC, sclera; , excitation light from blue-filtered xenon lamp; , light intensity reflected by sclera and traversing MP-containing retinal area (macula); , light intensity reflected by sclera and traversing the region outside the macula (peripheral retina).
Several simplifications of Eq. (1) are possible. First, we can assume that the white-light exposure of the retina, occurring during the fundus video-capturing mode of the measurement, which precedes the MP reflection imaging, will bleach the vast majority of photoreceptors, i.e., . We also know that the ocular media of infants and children are typically highly transparent, i.e., , and that the inner limiting membrane (ILM) and nerve fiber layer (NFL) are also highly transparent. Furthermore, from an inspection of all RGB triplet pixel intensities for wavelengths longer than the excitation wavelength, achieved with the help of a long-pass wavelength filter, we saw that the fluorescence of the ocular media and lipofuscin in the RPE was negligible in infants and children. With these assumptions, Eq. (1) can be reduced to
| (2) |
The excitation intensity, , and reflection coefficient, , cancel out by referencing the reflection detected from the macular region to the reflection detected from a peripheral retinal region. This yields a ratio
| (3) |
In this ratioing procedure, we have to assume that chromophores existing and absorbing in the deeper retinal layers are evenly distributed across its posterior pole. Mainly, this includes melanin in the RPE and blood in the CHR. Furthermore, we neglect reflections at internal retinal layer interfaces, which can be detected with high-sensitivity optical coherence tomography detection schemes, but are roughly one order of magnitude lower than the reflection at the sclera,21 and since as Fresnel reflections, they vary only weakly with wavelength over the visible/NIR region. For the processing of the raw reflection images, we followed basically the same procedure used previously in our autofluorescence-based imaging method for the measurements of MP in adults.15 Briefly, this involves selecting several small peripheral pixel areas in the raw images that exhibit uniform illumination, then calculating an average pixel intensity for these areas, and finally using this average as a reference for the intensity of a small macular “test” pixel area.
The transmission of the excitation light at wavelength can be expressed through the transmission at the peak of the MP absorption at 460 nm via
where is the extinction coefficient. With this expression, the right side of Eq. (3) reduces to . With the optical density (OD) equaling log (), the MP optical density (MPOD) difference between macula and periphery can be written as
| (4) |
i.e., this difference can be approximated as the log ratio between foveal and peripheral reflection intensities when recorded with the blue subset of the CCD camera pixel array. Since the blue-excitation light of the RetCam® peaks at 485 nm, it overlaps the MP absorption spectrum at only a slightly reduced extinction relative to the maximum absorption at 460 nm (see Fig. 2), resulting in a value of 1.15 for all MPOD calculations.
The imaging of an infant’s retina started with the recording of several fundus images under white-light exposure to find the proper alignment of the macula relative to the camera’s light delivery and collection modules. Subsequently, the blue-light source was quickly fiber-coupled into the contact module, and several still images were recorded. The instrument’s 80-deg front lens was found to be optimal for our purposes, since due to its relatively high field-of-view and resulting high contrast of retinal features, it facilitated “finding” the macula, which in the infant eye generally has only weakly distinguished topological features compared with the peripheral retina. The blue-light excitation disk size resulting with this lens had a diameter of at the cornea. The light power was in these measurements. Typical total measurement times were several minutes including excitation with white light for about 1 to 2 min in order to “find” the macula, and subsequent excitation with blue light for a fraction of a minute to generate the reflection image of interest. These light exposures are well below the 5-min safety limit for the RetCam’s blue-light source.20 The highest quality reflection images (sharp focus and uniform background illumination) were selected from all recorded blue-light excitation, B-chip readout, still images, and saved in uncompressed files for data/image processing. In this process, each image was split up into its R, G, and B subfiles, R and G files were checked for absence of any significant pixel intensities, the B file was converted to an 8-bit grayscale image file, and in the last step, processed for MPOD calculations via selected peripheral and macular pixel areas, as described previously.15
3. MP Reflection Image Features and Clinical Results
To develop the reflection method for clinical use and to survey the main MP properties in infants and children, we enrolled 51 subjects ranging in age from prematurity up to age 6. Parental consent was obtained in all cases under an IRB-approved protocol that complied with the Declaration of Helsinki. Subjects were imaged with pupil dilation according to the standard of care for their age. Preterm infants were imaged at the same time they were scheduled for retinopathy of prematurity screening, all others during examinations scheduled for other medical reasons. At the time of enrollments, all demographic information was collected including age, sex, race, and ethnicity.
In Figs. 3 and 4, we compare fundus images for a 4-month-old infant obtained, respectively, with white-light and blue-light excitations and differing color readouts of the CCD arrays. As can be seen from the white-light color fundus image of Fig. 3, recorded with full RGB readout of the three CCD arrays, the macular region is only vaguely discernible, since distinguishing topological features such as a foveal depression do not yet exist, and color changes due to yellow MP, expected in the macular region, are largely washed out. Basically, only blood vessels appear with high contrast in this operation mode, as desired for the intended routine fundus-imaging modes of the RetCam®. To enhance MP features, we derived 8-bit grayscale reflection and corresponding absorption images via selective B, G, and R-chip readouts, respectively. For better visual appearance of the images, illumination nonuniformities were removed from the raw images via fast Fourier transform (FFT) filtering (ImageJ software, NIH). All processed image results are shown in Figs. 3 and 4, clearly revealing enhanced visualization of the macular region.
Fig. 3.
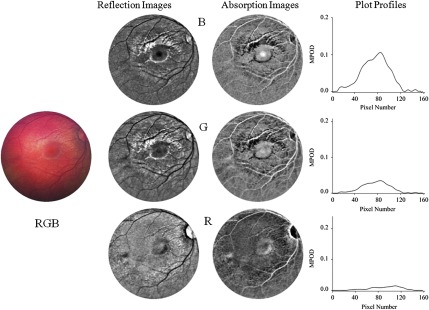
Fundus imaging of 4-month-old infant with white-light excitation. Left: raw image obtained with combined RGB-chip readouts of CCD detector array. First column: reflection images derived from raw image via selective B, G, and R-chip readouts, respectively. Second column: B, G, and R absorption images derived from reflection images. For better visual appearance, all B, G, and R images were FFT filtered (intensity variations removed in small structures up to three pixels, and in large structures averaged over 40 pixel increments). Right column: MP optical density (MPOD) line profiles obtained from raw image B, G, and R chip intensities, respectively, along meridians running horizontally through the center of the macula.
Fig. 4.
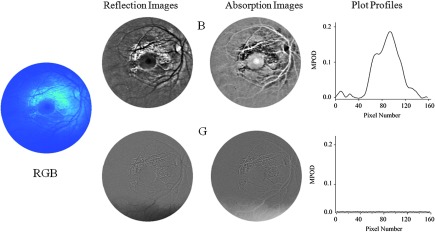
Fundus imaging of infant of Fig. 3 with blue-light excitation. Left: raw image obtained with combined RGB chip readouts of CCD detector array. First column: reflection images derived from raw image via selective B- and G-chip readouts, respectively, and subsequent FFT filtering (same settings as for Fig. 3). Second column: B and G absorption images derived from reflection images. Right column: MPOD line profiles obtained along meridians running horizontally through the center of the macula. Note that the MPOD level of in the center of the MP distribution is about twice as high as the level obtained with white-light excitation (shown in Fig. 3).
Calculating apparent MPOD levels along the horizontal meridian through the macula, the highest level of is obtainable from the B-chip absorption image and 0.03 from the G-chip absorption image, roughly corresponding in relative strengths to the absorption behavior of macular pigment, which is stronger in the blue versus green. The R-chip image reveals absorption, too, most likely due to melanin. In principle, this would be a confounding factor in the measurement, but fortunately the OD is very low (smaller than about 0.01). Assuming that the melanin absorption is about a factor of 2 higher in the blue relative to the red wavelength region,22 the percentage melanin contribution to the MPOD would be at most for this subject.
When using blue-light imaging in combination with selective B-chip readout only, as shown in Fig. 4, a dim blue image with central dark MP disk results. The absence of blood vessel features demonstrates the selective sensitivity of the B-chip image to the yellow carotenoid chromophores. After carrying out identical image processing as described above, the MP-containing macular region reveals an MPOD density of in the B-chip image, which is about double the OD level obtainable with the white-light imaging of Fig. 3. The G- and R-chip images revealed no absorption, in agreement with the absence of excitation intensity in those wavelength regions.
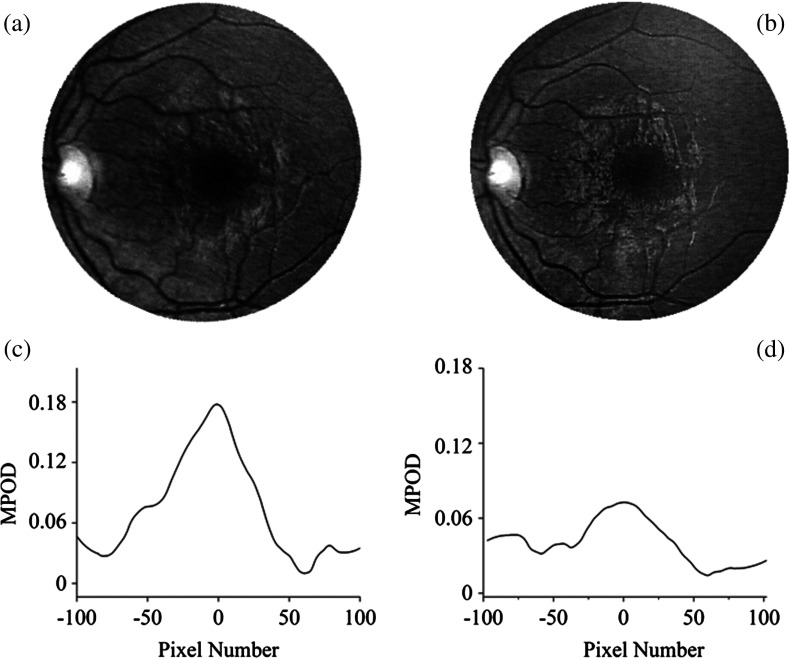
Measurements of several dozen subjects showed that the MPOD imaging improved significantly with this approach with the percentage increases of MPOD levels relative to white-light imaging ranging from about 20% to 100%. Interestingly, the exact increase in MPOD levels is not a constant factor, but rather depends on the alignment of the contact module during the initial white-light imaging phase of the measurement. This effect is shown in Fig. 5, where two B-chip images and the corresponding line plots along the horizontal meridian through the center of the macula are compared for the same subject for white-light excitation. The apparent peak MPOD levels are in one case and in the other, thus differing by more than a factor of 2 and indicating a strong directional dependence of the contact module alignment on the apparent MPOD results. This directional sensitivity also manifests itself as a color change in the RGB chip images under white-light imaging, where the fundus images change from a normal orange/red color at optimum alignment (i.e., macula exactly centered in the image) to a yellowish/orange color for off-center locations. The described alignment effects are noticeable even if the macula is not too far off-center.
Fig. 5.
Sensitivity of RetCam® imaging to subject’s eye alignment in white-light excitation mode. Examples of gray-scaled B-chip images for slightly different positioning of macula within fundus image (top) and the corresponding line plots along meridians through macula (bottom). Depending on alignment, apparent MPOD results differ by more than a factor or 2 ( versus ).
In most infants, all white- and blue-light reflection images also revealed a narrow, ring-shaped, high-intensity reflection feature surrounding the macula at a larger distance. Probably, this feature originates from spatial irregularities of the ILM or deeper retinal layers and is typically seen also in images of adult subjects.17 In the processing of the images for MPOD calculations, these highly reflecting areas were excluded.
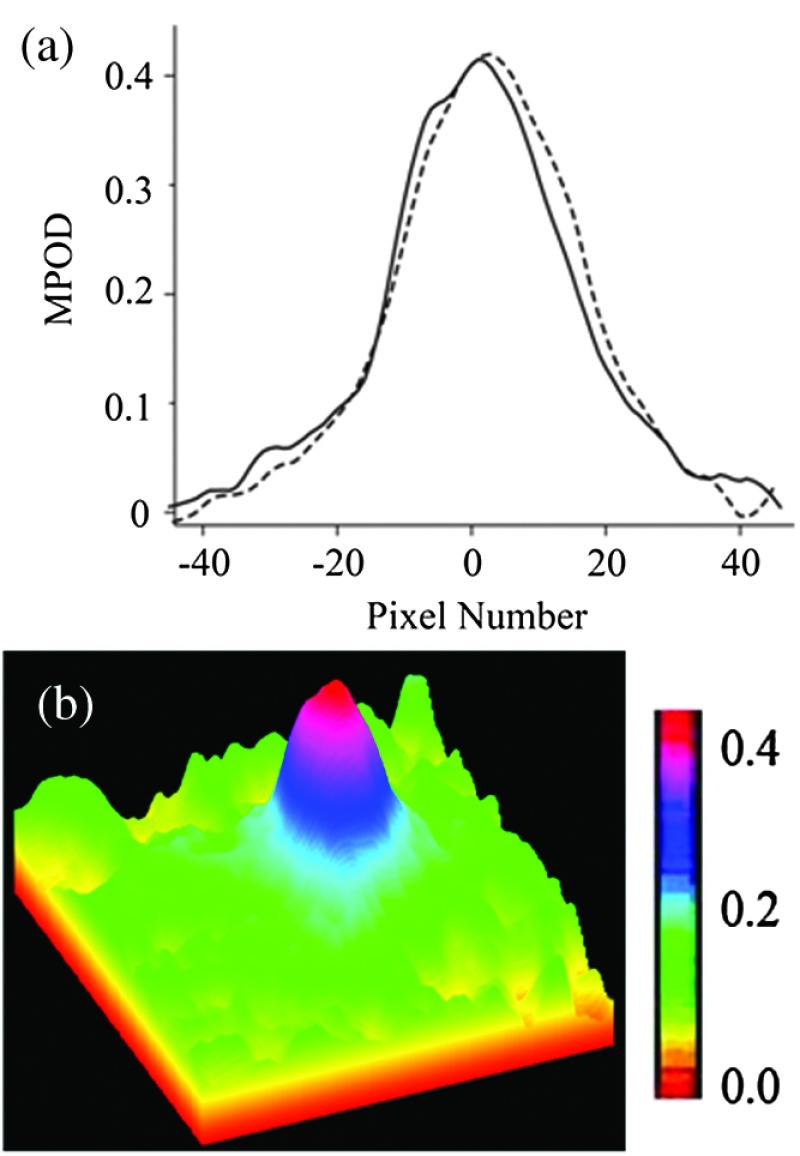
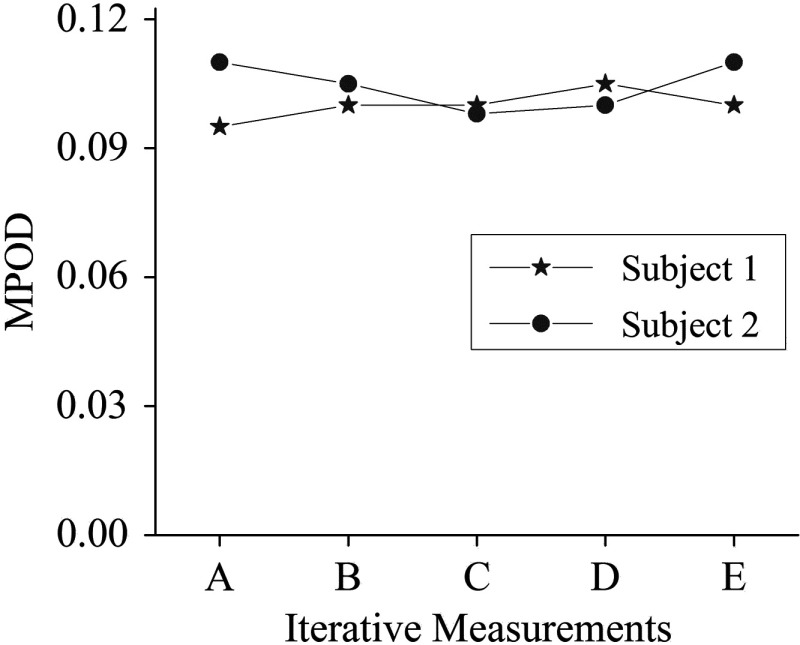
Visualization of the spatial MP features is further facilitated by line plots along multiple meridians and by pseudocolor displays of the pixel intensities, as illustrated in Fig. 6, showing a peak MPOD level of in a particular subject with a nearly circularly symmetric MP distribution. Iterative measurements of MPOD levels for two subjects demonstrated a satisfactory high repeatability of our methodology, as shown in Fig. 7, for the peak MPOD levels of the MP distributions in these two subjects. The standard deviation for each series was .
Fig. 6.
Spatial features of MP distributions obtained via processing of two-dimensional grayscale raw image pixel intensity maps: (a) MP profiles along the nasal–temporal (solid curve) and inferior–superior meridians (dashed curve); and (b) pseudocolor-scaled three-dimensional MP distribution with corresponding scale bar.
Fig. 7.
Comparison of MPOD levels for two subjects in sequence of iterative measurements, demonstrating a high repeatability of our methodology with approximate standard deviation of approximately 5%.
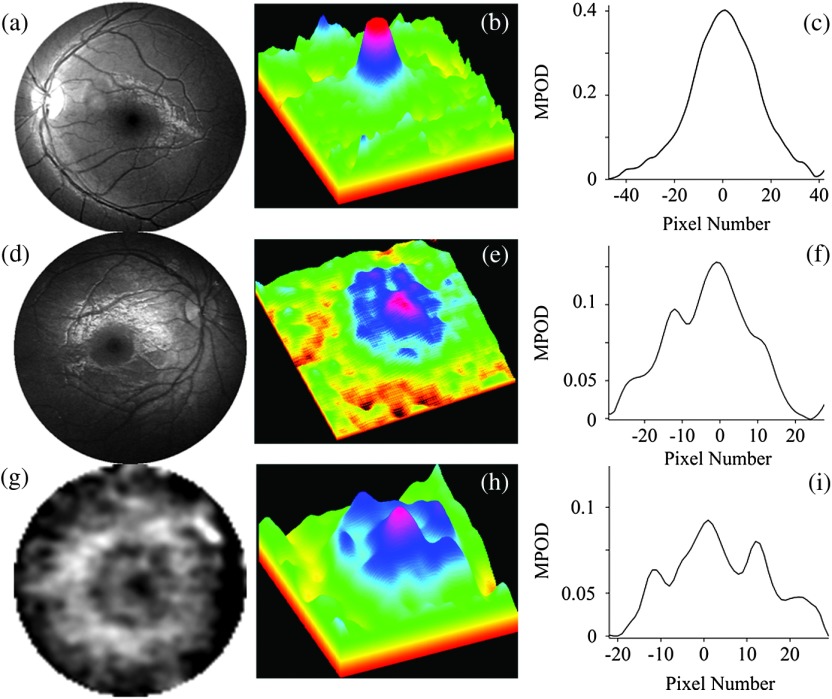
The main MP image features for the measured population are illustrated in Fig. 8, displaying representative grayscaled and processed images for three infants aged 3, 0.5, and 0.6 years, respectively. Centered on the macula in each case, two images show nearly circularly symmetric MP distributions with different central levels, and one shows a nonsymmetrical distribution characterized by a strong central peak surrounded by a concentric ring of lower MP levels. Peak MP levels varied between 0 and 0.4 OD units in the measured subject population, with the highest levels reaching MP levels in adults.15 Out of 39 subjects with measurable MP levels, 37 had a relatively narrow, centrally peaked distribution, and only two subjects had a ring-shaped distribution. This behavior is different from about five distinguishable MP distribution patterns observable in healthy adults13,15 and AMD patients.23
Fig. 8.
Reflection-based MP images for three infants and their corresponding spatial MP distributions. Gray-scaled images centered on the macula in each case for infants aged 3 (a), 0.5 (d) and 0.6 (g) years, respectively. Corresponding pseudocolor-scaled, three-dimensional MP distributions (b), (e), and (h). Corresponding spatial MPOD plot profiles along the nasal–temporal axes (c), (f) and (i). Most subjects participating in this study revealed narrow, nearly circularly symmetric MP distributions similar to (a), (b, (c), but they differed generally in peak MP levels. Two subjects revealed MP distributions similar to (g), (h), (i), characterized by a strong MP peak in the fovea surrounded by lower MP levels over a concentric ring. Image (g) is enlarged about 5 times relative to images (a) and (b).
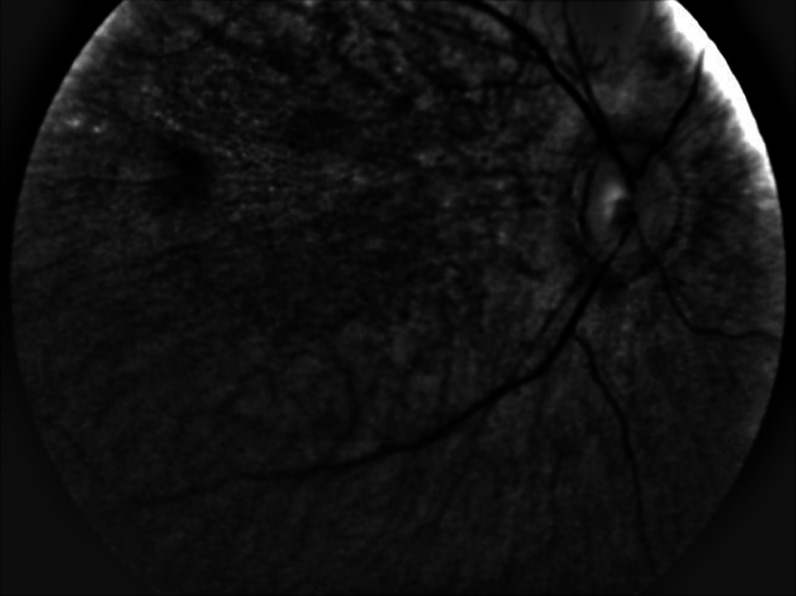
In all nine prematurely born infants, MP was found to be absent. In all these cases, a distinguished macular region could not be detected, as seen from a representative B-chip image in Fig. 9. Instead of any MP-resembling feature, usually only one, and sometimes two small, gray-shaded, retinal areas were seen for each subject, at roughly constant distances from the optical disk, but in locations with eccentricities too large for the normal macular location of an infant (too large by at least a factor of 2). Supporting the conclusion that these spots are not associated with yellow MP chromophores is our finding that these spots remain visible also when imaging with white-light excitation and selectively reading out only the G- and R-chip arrays. Such a spectral behavior would be consistent with a broadly absorbing chromophore, such as melanin, but its nature remains unclear at this time.
Fig. 9.
Reflection-based fundus image of prematurely born infant. A distinguishable macula is not yet developed; measurable MP levels are absent. The dark spot in the upper left of the image indicates the presence of a chromophore, but its eccentricity from the optical disk is at least twice as high as for a normal infant macula, and its spectral characteristics are not consistent with a yellow chromophores such as MP.
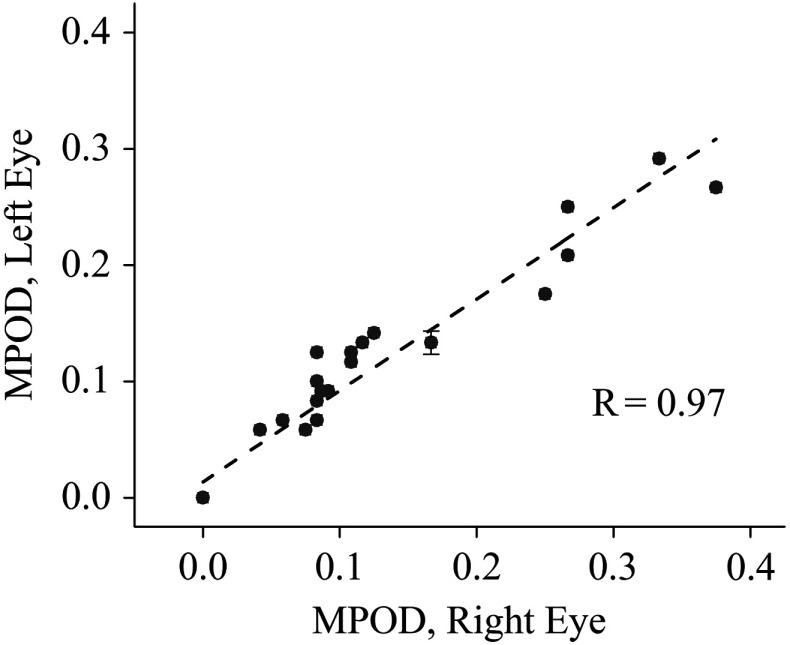
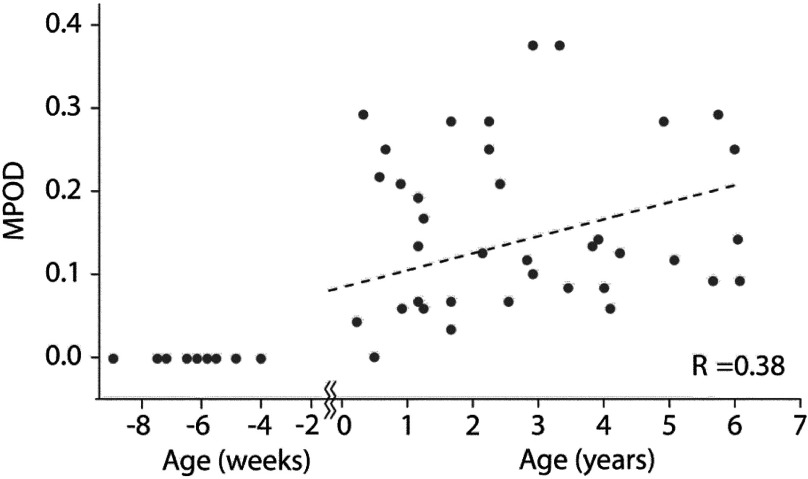
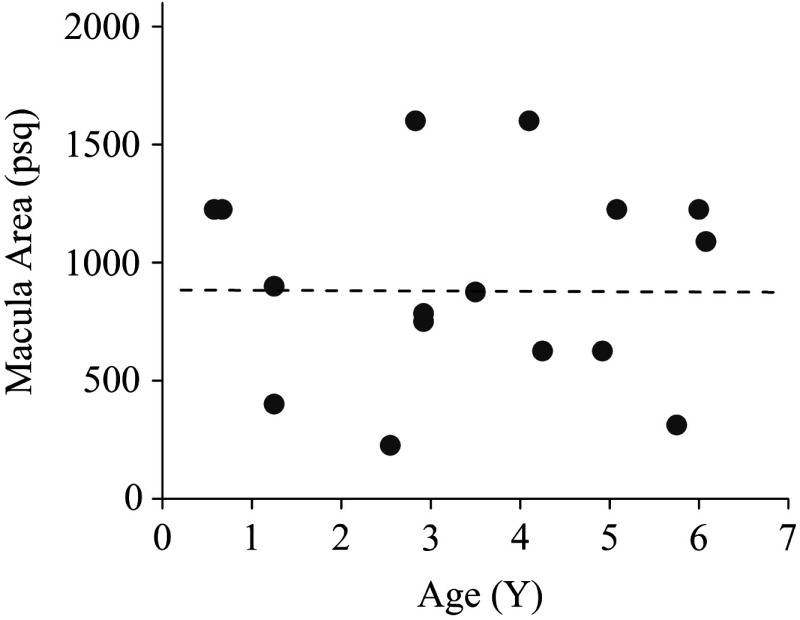
For all subjects with measurable MPOD levels in both eyes, the values for right and left eyes correlated strongly (; ) over a wide range of levels, as shown in Fig. 10, for the peak MPOD levels of the distribution in each case. The behavior is similar to the respective correlation in adult eyes.13,15,23 While at any particular age, the peak MPOD levels can differ by about one order of magnitude between subjects, there is on average a steady linear increase of MPOD levels over the first 6 years of life, as shown in Fig. 11. We did not find any significant correlation between the MP-containing macula, measured in square pixels, versus the age of the infant, as seen from Fig. 12, i.e., the width of the MP distribution appears constant on average over this age range. A more comprehensive description of the clinical MP results along with their correlations to skin carotenoid levels, which can be measured via RRS in a quantitative noninvasive fashion in adults,24–26 and with a recently developed sensitivity-enhanced instrument configuration also in infants and children27 is published elsewhere.28
Fig. 10.
Correlation of MPOD levels between right and left eyes (; ).
Fig. 11.
Correlation between MPOD levels and age for 46 infants and children. Subjects ranged in age from preterm (negative age) to 6 years (; ).
Fig. 12.
MP-containing retinal area, measured in image pixels squared, versus age of infants. Discounting one outlier with an MP distribution of unusually large width, the width of the pigment distribution appears constant on average for all subjects.
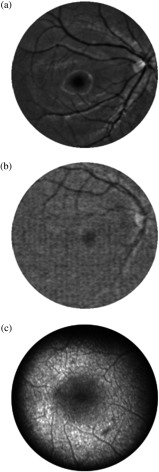
Our RetCam®-based MP detection methodology can be easily applied also for MP imaging of adult subjects. We measured six adult volunteer subjects for comparison purposes. As demonstrated in Fig. 13, representative grayscale images from a 1-year-old infant and a 46-year-old adult reveal a much higher image quality in the infant compared with the adult. Apparently, this is due to much higher scattering contributions of the anterior ocular media in the adult eye and potentially also due to higher melanin levels, washing out the image contrast obtainable for all blood vessels and the optical disk as well as the MP. This degree of scattering can be expected to increase with age. As a measure for the image degradation, we can use the contrast of the darkest blood vessels in the two images, which is about 0.10 for the adult and 0.25 for the infant. Clearly, the RetCam® platform would be inferior for MP imaging in adults, since the required double-path blue-light propagation through all anterior ocular media and deeper retinal layers is strongly confounded by scattering and absorption. This observation is consistent with macular pigment reflection imaging of adults with a standard fundus camera, where images with acceptable quality could only be obtained in relatively young subjects ranging in age from 18 to 24.29
Fig. 13.
Comparison of blue-light reflection images recorded from an infant (a) and adult subject (b), and comparison of the obtainable MP distribution image quality for the adult subject measured with the reflection method (b) versus an autofluorescence-imaging (AFI) method (c). Reflection image quality is higher in the infant relative to the adult; for the adult, the autofluorescence image quality is higher relative to the reflection image.
It is interesting here to compare the merits of reflection-based imaging of MP in adults with other applicable imaging methodologies, such as our previously described autofluorescence-imaging (AFI) method.15 This method makes use of the spectral properties of lipofuscin, which is located posteriorly to the macular pigment in the RPE.30 Lipofuscin absorbs over a broadband in the blue/green spectral region, essentially in the same region as the macular pigment, and features a strong fluorescence over a broadband peaking at 620 nm.30 MPOD levels and their spatial distributions are obtained in this method by exciting the lipofuscin chromophore in its blue absorption region and comparing the unattenuated lipofuscin fluorescence intensity in the peripheral region with the MP attenuated fluorescence intensity in the macular region.
Comparing reflection and AFI images obtained for the same adult, the AFI image features a much higher image quality relative to the reflection image, as shown in Fig. 13. This effect is consistent with the different light–tissue interaction scenarios in the reflection versus the AFI method. Compared with the double-path blue-light propagation through all ocular layers in the reflection method, which includes the strongly absorbing CHR, the AFI method uses blue-light propagation only in a single path and only up to the retinal pigment epithelial layer, thus avoiding the CHR. Furthermore, the fluorescence signals of the return path occur at far-red/near-infrared wavelengths, which are much less severely affected by scattering relative to blue-light wavelengths.
4. Conclusion
We developed a novel capability of the RetCam® for the rapid quantitative measurement of MP levels and their spatial distributions in infants and children and surveyed for the first time the main MP features in the developing human retina. Comparing white-light with blue-light imaging, the latter clearly results in improved MPOD imaging with higher image contrast in the macular region, as evidenced by significantly higher MPOD levels. It is conceivable that white-light excitation generates stronger scattering contributions from shorter excitation wavelengths into peripheral areas relative to narrow-band blue-light excitation or that the convolution of the white-light excitation spectrum with the spectral sensitivity of the blue camera channel peaks at a longer wavelength relative to the blue excitation, thus degrading the image contrast between macula and periphery or decreasing the MP absorption, respectively, and making it less accurate.
Measuring MPOD levels in a clinical population of 51 infants ranging in age between preterm to age 6, we find that MP levels are absent in all measured preterm infants and that they increased on average with age in all other subjects. In the oldest measured infants of about age 6, the peak MP-approached MP levels seen in adults. In contrast to adults, where widely varying spatial distribution patterns are seen, infants with measureable MP had almost exclusively only circularly symmetric MP distributions. The described methodology holds promise for future investigations into the role of MP in the development of the human retina and in combination with intravenous feeding and/or dietary interventions could potentially help improve the health of infants lacking normal carotenoid levels.
Acknowledgments
The authors acknowledge the clinical measurements of Robert A. Hoffman and financial support from the National Eye Institute Grant EY-11600, Research to Prevent Blindness, Abbott Nutrition (Columbus, Ohio), and Image Technologies (Salt Lake City, Utah).
References
- 1.Snodderly D. M., et al. , “The macular pigment. I. Absorbance spectra, localization, and discrimination from other yellow pigments in primate retinas,” Invest. Ophthalmol. Visual Sci. 25(6), 660–673 (1984). [PubMed] [Google Scholar]
- 2.Snodderly D. M., Auran J. D., Delori F. C., “The macular pigment. II. Spatial distribution in primate retinas,” Invest. Ophthalmol. Visual Sci. 25(6), 674–685 (1984). [PubMed] [Google Scholar]
- 3.SanGiovanni J. P., Neuringer M., “The putative role of lutein and zeaxanthin as protective agents against age-related macular degeneration: promise of molecular genetics for guiding mechanistic and translational research in the field,” Am. J. Clin. Nutr. 96(5), 1223Sx (2012). 10.3945/ajcn.112.038240 [DOI] [PMC free article] [PubMed] [Google Scholar]
- 4.Ma L., et al. , “Lutein and zeaxanthin intake and the risk of age-related macular degeneration: a systematic review and meta-analysis,” Br. J. Nutr. 107(3), 350–359 (2012). 10.1017/S0007114511004260 [DOI] [PubMed] [Google Scholar]
- 5.Loane E., et al. , “Transport and retinal capture of lutein and zeaxanthin with reference to age-related macular degeneration,” Surv. Ophthalmol. 53(1), 68–81 (2008). 10.1016/j.survophthal.2007.10.008 [DOI] [PubMed] [Google Scholar]
- 6.Stringham J. M., et al. , “Macular pigment and visual performance in glare: benefits for photostress recovery, disability glare, and visual discomfort,” Invest. Ophthalmol. Visual Sci. 52(10), 7406–7415 (2011). 10.1167/iovs.10-6699 [DOI] [PubMed] [Google Scholar]
- 7.Hammond B. R., “The dietary carotenoids lutein and zeaxanthin in pre-and-postnatal development,” Funct. Food Rev. 4(3), 130–137 (2012). [Google Scholar]
- 8.Leung I. Y., et al. , “Nutritional manipulation of primate retinas, II: effects of age, n-3 fatty acids, lutein, and zeaxanthin on retinal pigment epithelium,” Invest. Ophthalmol. Visual Sci. 45(9), 3244–3256 (2004). 10.1167/iovs.02-1233 [DOI] [PubMed] [Google Scholar]
- 9.Zimmer J. P., Hammond B. R., Jr., “Possible influences of lutein and zeaxanthin on the developing retina,” Clin. Ophthalmol. 1(1), 25–35 (2007). [PMC free article] [PubMed] [Google Scholar]
- 10.Wing G. L., Blanchard G. C., Weiter J. J., “The topography and age relationship of lipofuscin concentration in the retinal pigment epithelium,” Invest. Ophthalmol. Visual Sci. 17(7), 601–607 (1978). [PubMed] [Google Scholar]
- 11.Bone R. A., Landrum J. T., “Heterochromatic flicker photometry,” Arch. Biochem. Biophys. 430(2), 137–142 (2004). 10.1016/j.abb.2004.04.003 [DOI] [PubMed] [Google Scholar]
- 12.Gellermann W., et al. , “In vivo resonant Raman measurement of macular carotenoid pigments in the young and the aging human retina,” J. Opt. Soc. Am. 19(6), 1172–1186 (2002). 10.1364/JOSAA.19.001172 [DOI] [PubMed] [Google Scholar]
- 13.Sharifzadeh M., et al. , “Resonance Raman imaging of macular pigment distributions in the human retina,” J. Opt. Soc. Am. 25(4), 947–957 (2008). 10.1364/JOSAA.25.000947 [DOI] [PMC free article] [PubMed] [Google Scholar]
- 14.Delori F. C., “Autofluorescence method to measure macular pigment optical densities fluorometry and autofluorescence imaging,” Arch. Biochem. Biophys. 430(2), 156–162 (2004). 10.1016/j.abb.2004.05.016 [DOI] [PubMed] [Google Scholar]
- 15.Sharifzadeh M., Bernstein P. S., Gellermann W., “Nonmydriatic fluorescence-based quantitative imaging of human macular pigment distributions,” J. Opt. Soc. Am. 23(10), 2373–2387 (2006). 10.1364/JOSAA.23.002373 [DOI] [PMC free article] [PubMed] [Google Scholar]
- 16.Delori F. C., Pflibsen K. P., “Spectral reflection of the human ocular fundus,” Appl. Opt. 28(6), 1061–1077 (1989). 10.1364/AO.28.001061 [DOI] [PubMed] [Google Scholar]
- 17.Berendschot T. T., van Norren D., “Objective determination of the macular pigment optical density using fundus reflection spectroscopy,” Arch. Biochem. Biophys. 430(2), 149–155 (2004). 10.1016/j.abb.2004.04.029 [DOI] [PubMed] [Google Scholar]
- 18.Hammer M., Schweitzer D., “Quantitative reflection spectroscopy at the human ocular fundus,” Phys. Med. Biol. 47(2), 179–191 (2002). 10.1088/0031-9155/47/2/301 [DOI] [PubMed] [Google Scholar]
- 19.Schweitzer D., et al. , “Simple and objective method for routine detection of the macular pigment xanthophyll,” J. Biomed. Opt. 15(6), 061714 (2010). 10.1117/1.3526358 [DOI] [PubMed] [Google Scholar]
- 20.Clarity Medical Systems, RetCam3 User Manual, PN 21–100277 Rev. C., pp. 53–56 (2008).
- 21.van Norren D., Tiemeijer L. F., “Spectral reflectance of the human eye,” Vision Res. 26(2), 313–320 (1986). 10.1016/0042-6989(86)90028-3 [DOI] [PubMed] [Google Scholar]
- 22.Van de Kraats J., Berendschot T. T. J. M., van Norren D., “The pathways of light measured in fundus reflectometry,” Vision Res. 36(15), 2229–2247 (1996). 10.1016/0042-6989(96)00001-6 [DOI] [PubMed] [Google Scholar]
- 23.Bernstein P. S., et al. , “Macular pigment imaging in AREDS2 participants: an ancillary study of AREDS2 subjects enrolled at the Moran Eye Center,” Invest. Ophthalmol. Visual Sci. 53(10), 6178–6186 (2012). 10.1167/iovs.12-10275 [DOI] [PMC free article] [PubMed] [Google Scholar]
- 24.Ermakov I. V., et al. , “Resonance Raman detection of carotenoid antioxidants in living human tissues,” Opt. Lett. 26(15), 1179–1181 (2001). 10.1364/OL.26.001179 [DOI] [PubMed] [Google Scholar]
- 25.Ermakov I. V., et al. , “Application of resonance Raman spectroscopy to the detection of carotenoids,” Chapter 6 in Carotenoids—Physical, Chemical, and Biological Functions, and Properties, Landrum J. T., Ed., pp. 87–109, CRC Press, Atlanta, Georgia: (2009). [Google Scholar]
- 26.Mayne S. T., et al. , “Noninvasive assessment of dermal carotenoids as a biomarker of fruit and vegetable intake,” Am. J. Clin. Nutr. 92(4) 794–800 (2010). 10.3945/ajcn.2010.29707 [DOI] [PMC free article] [PubMed] [Google Scholar]
- 27.Ermakov I. V., et al. , “Resonance Raman based skin carotenoid measurements in newborns and infants,” J. Biophotonics 6(10), 793–802 (2012). 10.1002/jbio.201200195 [DOI] [PMC free article] [PubMed] [Google Scholar]
- 28.Bernstein P. S., et al. , “Blue-light reflectance imaging of macular pigment in infants and children,” Invest. Opthalmol. Visual Sci. 54(6), 4034–4040 (2013). 10.1167/iovs.13-11891 [DOI] [PMC free article] [PubMed] [Google Scholar]
- 29.Bone R. A., Brener B., Gibert J. C., “Macular pigment, photopigments, and melanin: distributions in young subjects determined by four-wavelength reflectometry,” Vision Res. 47(26), 3259–3268 (2007). 10.1016/j.visres.2007.09.002 [DOI] [PMC free article] [PubMed] [Google Scholar]
- 30.Delori F. C., “Spectrometer for noninvasive measurement of intrinsic fluorescence and reflectance of ocular fundus,” Appl. Opt. 33(31), 7439–7452 (1994). 10.1364/AO.33.007439 [DOI] [PubMed] [Google Scholar]


