Abstract.
There is currently a need for a safe and effective way to detect and diagnose early stages of childhood caries. A multimodal optical clinical prototype for diagnosing caries demineralization in vivo has been developed. The device can be used to quickly image and screen for any signs of demineralized enamel by obtaining high-resolution and high-contrast surface images using a 405-nm laser as the illumination source, as well as obtaining autofluorescence and bacterial fluorescence images. When a suspicious region of demineralization is located, the device also performs dual laser fluorescence spectroscopy using 405- and 532-nm laser excitation. An autofluorescence ratio of the two excitation lasers is computed and used to quantitatively diagnose enamel health. The device was tested on five patients in vivo as well as on 28 extracted teeth with clinically diagnosed carious lesions. The device was able to provide detailed images that highlighted the lesions identified by the clinicians. The autofluorescence spectroscopic ratios obtained from the extracted teeth successfully quantitatively discriminated between sound and demineralized enamel.
Keywords: caries detection, multimodal device, clinical prototype, autofluorescence, laser-induced fluorescence, near-ultraviolet, light scattering, scanning fiber endoscope
1. Introduction
Childhood caries is one of the most common preventable diseases and is on the rise worldwide.1,2 Caries is a dynamic disease process that is caused by conversion of carbohydrates in the mouth by oral bacteria. A byproduct of the metabolism is acid, which, if left untreated, will cause demineralization of the enamel surface and subsurface, ultimately leading to deep structural damage of the enamel and the more porous dentin.3 Advanced stages of demineralization may be detected on x-ray or by visual inspection using conventional illumination sources such as fluorescent or incandescent lamps. However, x-ray and conventional visual inspection often lack the sensitivity to detect lesions at an early enough stage before permanent damage has occurred and remineralization is possible.4 Additionally, due to the health hazards associated with ionizing radiation, there is incentive to move away from x-rays, particularly in children.5,6
It has been previously reported that the use of short-wavelength 405-nm laser illumination with a scanning fiber endoscope (SFE) modified for dental imaging provides the highest contrast and resolution images of the tooth surface compared to other visible wavelength illumination sources.7,8 The enhanced contrast and resolution of the SFE device allows the clinician to easily visualize the entirety of the mouth to quickly screen for regions of suspicious activity. More recently, we have developed a quantitative fluorescence spectroscopic technique that employs two laser wavelengths in order to quantitatively distinguish between sound and demineralized enamel.9,10
In this study, we developed a multimodal clinical prototype device for testing in the clinic. The device allows the user to quickly and easily screen all teeth by first imaging using 405-nm reflectance, autofluorescence (AF), and bacterial fluorescence. Once a suspicious region in a tooth is identified, the user can temporarily halt the imaging to obtain detailed fluorescence spectroscopic data. The obtained spectra are analyzed and an AF ratio is computed, which can be used to quantitatively diagnose enamel health.
The development of the device and initial testing are described below. Extracted teeth with clinically diagnosed carious lesions are examined using the device. Histology is also performed on the examined teeth using polarized light microscopy (PLM). To test the operating capabilities of the clinical prototype device in a clinical patient setting, the device is also tested on five patients in vivo, with one case reported for a detailed description.
2. Materials and Methods
The multimodal device is a clinical prototype that is capable of capturing and displaying, in real time, three imaging modes. These modalities are short-wavelength laser reflectance images, AF, and bacterial fluorescence images. Additionally, the device is capable of capturing AF spectra to compute a metric that may be used to determine enamel health. The device and its different modules are first presented. Then, the use of the device on both extracted and in vivo teeth is described. Histology was performed to validate findings.
2.1. Device Design
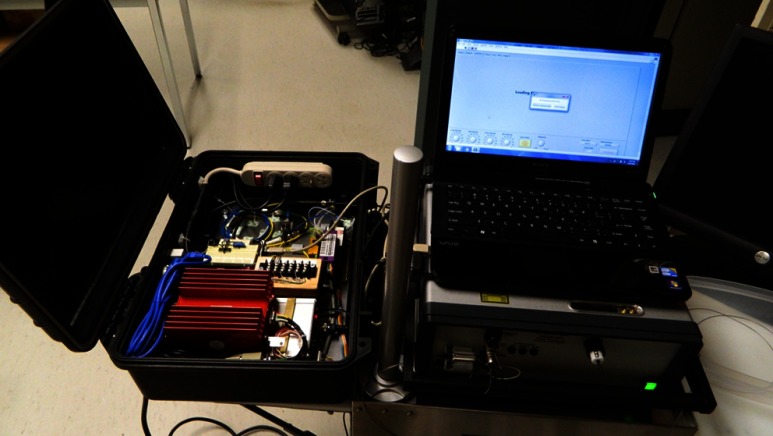
The clinical prototype device is an optical device capable of different modes of operation (Fig. 1). These modes include 405-nm reflectance imaging, 405-nm induced AF imaging, bacteria fluorescence imaging, and dual laser fluorescence spectroscopy. These modes of operation can be performed separately or simultaneously.
Fig. 1.
The multimodal caries detection clinical prototype device. The scanning fiber endoscope imaging module in the photo is beneath the laptop computer. Live video images are sent in real time to a display monitor (not shown). The spectrometer module, which also houses the two lasers, is packaged into a mobile case. The spectrometer case is open in the photo but may be closed during clinical examinations.
The multimodal optical device for early caries detection can be separated into two major functions, imaging and spectroscopy. For the real-time imaging of the teeth, the device utilizes the SFE engine. For dual laser spectroscopy, the device utilizes a fiber-optic coupled miniature spectrometer. A detailed description of the device is presented below.
2.2. Imaging Modality
The SFE developed in our laboratory is a miniature fiber endoscope that can be used to capture live video, high-quality images with wide field of view (FOV) by active scanning of a laser light beam instead of the conventional passive imaging method using diffuse light illumination.11 The laser beam is scanned in an expanding circular pattern (up to 100 deg FOV) at the distal tip of the probe by a piezoelectric actuator, which is sealed with a lens assembly. Diffuse reflected light from the target area is collected by a concentric ring of stationary multimode fibers around the central laser beam scanning fiber. The light from the collection fibers is focused onto two color separating (dichroic) beam splitters and directed at three photomultiplier tubes (PMT). Specialized software maps the synchronized PMT signals and the instantaneous location of the spiral scanning fiber to produce a two-dimensional (2-D) image. Specular reflections in the image are evidenced by bright spots; however, by virtue of the configuration of the single, narrow beam illumination fiber and ring of collecting fibers, there are relatively few spatial points meeting the specular criteria of equal angles of incidence and reflection. Hence the SFE operates without the need for crossed polarizers that reduce light collection efficiency. By utilizing this coaxial design of a single moving optical fiber with a ring of stationary collection fibers to produce 2-D images, an ultrathin endoscope can be fabricated. For this study, a 1.6-mm-diameter SFE probe was used. In normal “white light” imaging operation, red (635 nm), green (532 nm), and blue (442 nm) laser light are launched at the proximal end of the SFE and transmitted to the distal end using a single-mode optical fiber. However, in the present multimodal optical device, a violet (405 nm) laser replaces the red and blue illumination laser in order to obtain high-resolution and high-contrast surface reflection images as well as fluorescence images.7,8
Since the SFE is a three-channel system originally designed for RGB imaging, reflected violet light was isolated by a short-wavelength dichroic beam splitter (Edmunds Optics Quik Mod additive dichroic filter, M52-531) and passed into the blue channel. The 405-nm excited AF channel consisted of light transmitted through the blue channel filter and reflected by a green dichroic beam splitter (Edmunds Optics Quik Mod additive dichroic filter, M52-534). Finally, the 405-nm excited bacterial fluorescence is captured in the red channel.12 Table 1 summarizes the different imaging modalities and their clinical use.
Table 1.
Different imaging modalities and their use. Each modality is separated into either the blue, green, or red color channels after passing through the dichroic mirrors.
| Imaging Modality | Light Source | Captured Wavelengths | Clinical Use |
|---|---|---|---|
| 405 nm Reflectance | 405 nm | High resolution and high contrast surface imaging for initial survillance | |
| 405 nm induced Autofluorescence | 405 nm | 460–550 nm | Confirmation/screening for potential caries lesions |
| 405 nm induced bacterial Fluorescence | 405 nm | Presence of plaque/bacterial activity |
2.3. Spectroscopy Modality
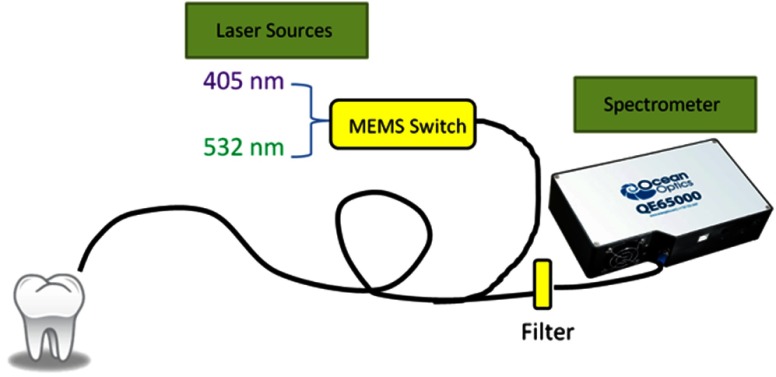
A laser-induced AF spectroscopy module was incorporated into the multimodal device and is shown in Fig. 2 and the left side of Fig. 1. The system uses a fiber coupled diode laser unit (FTEC2, Blue Sky Research, Milpitas, California) containing a 405-nm laser diode component (NDV4313, Nichia Corp., Tokushima, Japan) and a 532-nm fiber coupled diode laser unit (FTEC2, Blue Sky Research). Emission spectra were recorded using a commercially available miniature fiber optic spectrometer (QE65000 FL, Ocean Optics Inc., Dunedin, Florida). A 1.6-mm-diameter fiber bundle was assembled in our laboratory to guide the light from the lasers to the test specimens and collect the AF. A universal serial bus connected the spectrometer to a computer for data processing.
Fig. 2.
Schematic diagram of the dual laser spectroscopy module. A flexible fiber illuminated the teeth with either 405- or 532-nm laser. Switching between the lasers was controlled by an MEMS switch. The collected fluorescence was directed through an in-line filter to remove the excitation laser wavelengths before entering the spectrometer. The spectra were saved on a computer and analyzed.
Continuous wave output power was measured at 0.33 mW for the 405-nm laser and 0.64 mW for the 532-nm laser using an optical power meter (Model 1835-C, Newport Corp., Irvine, California). A 435-nm in-line long-pass filter (GG 435, Schott North America Inc., Elmsford, New York) and a 532-nm in-line notch filter (NF01-532U-25-D, Semrock, Rochester, New York) were placed in series to attenuate both 405- and 532-nm excitation laser light at the spectrometer entrance aperture. An MEMS optical switch (Sercalo Microtechnology, Switzerland) was used to switch between 405- and 532-nm excitation of the tooth specimen.
2.4. System Integration
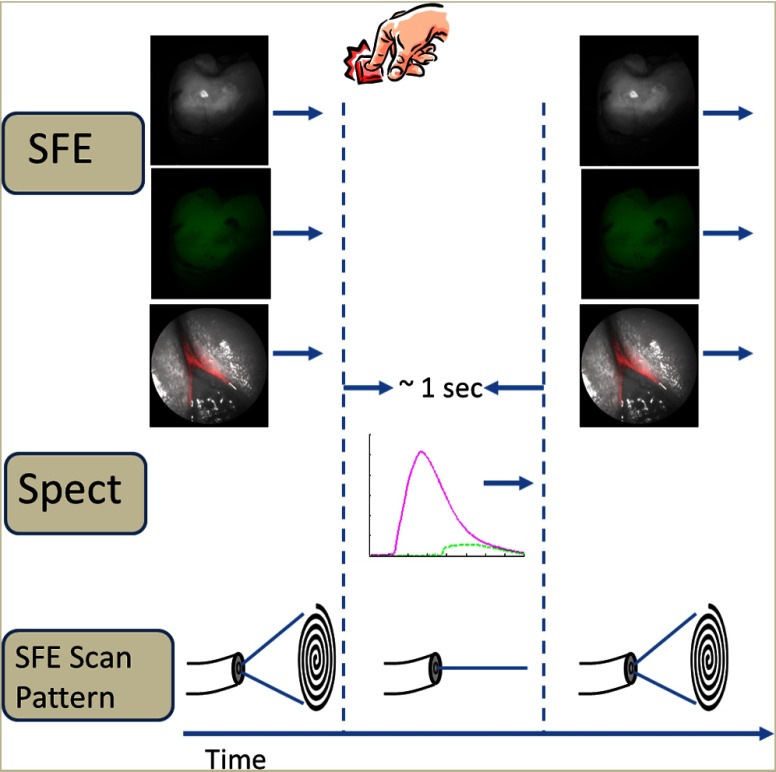
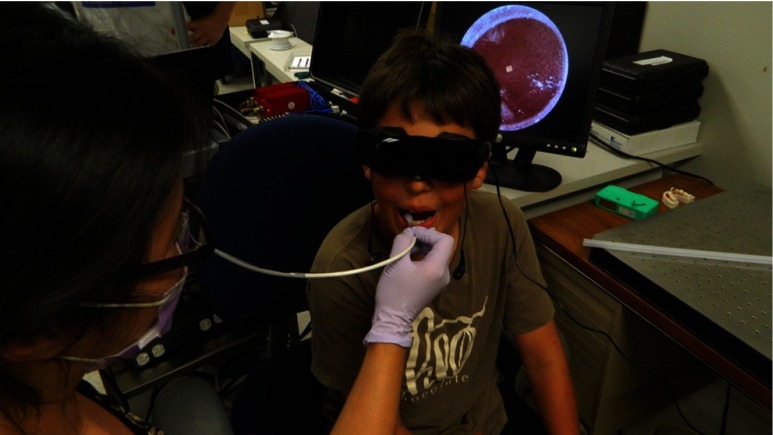
The prototype device was controlled using LabVIEW (National Instruments, Austin, Texas) with C language dynamic-linked libraries. Figure 3 shows the operational flow chart of the multimodal optical device. When operating in the imaging modality, the 405-nm single-mode laser serves as the illumination source. Reflectance images are captured from the blue channel, while AF images are obtained from the green channel. Last, bacterial fluorescence images are captured from the red channel. Since the channels operate independently of one another, the user may choose to display any combination of channels in order to obtain simultaneous multimodal images by choosing which channels are displayed in the output monitor. Images are in spatial registration since the scanning and collection optics are identical for all imaging modes. Figure 4 shows the use of the device on a patient.
Fig. 3.
The operational flow of the device. The system begins in imaging mode, which captures reflectance, AF, and bacterial fluorescence images. When the clinicians notice a suspicious area, they will center the image over the area and push a software icon button to temporarily disable the imaging mode and begin collecting spectroscopic data. Approximately 1 s later, numerical spectroscopic results are displayed and the system resumes imaging.
Fig. 4.
Use of the prototype device in vivo. The small size and flexibility of the fiber-optic-based probe is ideally suited for use in children. Note the display of the video image in the background. The image displayed on the screen is of the patient’s tongue.
AF spectra are captured at the center of the image FOV. To obtain dual laser spectroscopy, the laser beam scanning fiber is temporarily halted. Then, the AF emission from 405-nm laser light is collected by the device’s spectrometer. After obtaining the AF emission spectra from 405-nm excitation, the fiber optic MEMS switch selects the 532-nm laser. The AF emission spectrum from 532-nm excitation is then collected by the spectrometer. After acquiring both emission spectra, the software once again switches to the imaging mode. For a typical spectroscopic reading with 100 ms integration time per laser, interruption between live imaging frames occurs.
2.5. Spectroscopic Analysis
AF spectra excited by 405- and 532-nm lasers were obtained by alternating excitation of each individual laser on each specimen in the areas with signs of early-stage caries. Additionally, AF from healthy enamel regions on each tooth was also recorded to obtain an intraspecimen baseline. The spectrometer integration time was set to 100 ms to reduce system noise. All emission spectra were filtered with a 13-point (corresponding to a spectral width of 4.94 nm) median filter to further remove electronic noise, followed by a 13-point Gaussian smoothing filter.
The AF spectra from 405- and 532-nm excitation were obtained from different regions on the specimens that corresponded to different stages of enamel health. Area-under-the-curve values were obtained from the AF spectra. The area of the 405-nm spectrum was then divided by the area of the 532-nm spectrum to obtain the dual laser fluorescence ratio metric.9
2.6. Test Subjects and Specimen Preparation
2.6.1. Extracted specimens
The institutional approved study used extracted human molars and premolars () with sound and early-stage natural caries regions. The teeth specimens were classified using the diagnostic criteria shown in Table 2. All regions with visual signs of early-stage caries were noted.
Table 2.
Criteria for clinical enamel classification.
| Category | Clinical Criteria |
|---|---|
| Sound | Normal texture of enamel |
| Early Caries Lesion | Opaque or slightly opaque, with loss of luster and rough, intact surface. Typically located in region of tooth with high percentage of lesion development (e.g. interproximal contact point) |
The teeth were cleaned and fixed in formalin (10% neutral pH formalin, Sigma-Aldrich, St. Louis, Missouri); the specimens were then stored in a 0.1% thymol (Sigma-Aldrich) solution at room temperature.
2.6.2. In vivo patient study
In order to examine the ability of the prototype device to function in a clinical setting, the system was tested on five patients at a pediatric dental clinic (The Center for Pediatric Dentistry, Seattle, Washington, Human Subjects Approval #42412). The participants were between 4 and 11 years of age, with at least one primary molar presenting an occlusal noncavitated carious site as diagnosed according to standard of care methods. We report one case study of a 4-year-old patient for detailed description here. This patient presented with an occlusal noncavitated caries lesion and was also scheduled for a restoration visit. Examinations began with the device operating in 405-nm reflectance mode to provide the user with high-resolution and high-contrast video images of all teeth within the mouth. This served as a screening method to identify and locate the suspicious region. The device was then switched to the fluorescence imaging modality. This served to further confirm the suspicious region. If the suspicious region appeared dark compared to the background, and/or had bacterial red fluorescence signal, then it was highly likely that a caries lesion was found.
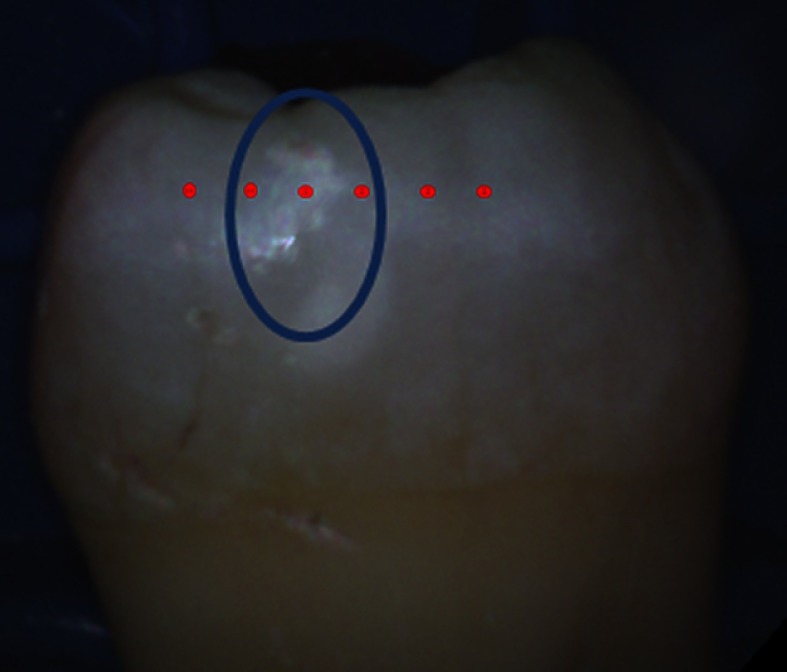
To quantitatively determine the health of the enamel, the imaging mode was temporarily interrupted so that dual laser AF spectra could be obtained. If an area of demineralization is suspected, a baseline AF spectra is recorded from a healthy region of the tooth. Then, additional AF readings are sampled along in a linear fashion, which passes through both sound enamel and the suspected lesion (Fig. 5). After recording the fluorescence spectra, the device resumed imaging. Total exam time was .
Fig. 5.
Protocol for obtaining dual laser fluorescence from a tooth. The blue oval indicates a suspicious region to be measured. AF spectra are obtained at intervals of along the dashed line, which spans through both sound enamel and the suspected carious lesion. The baseline reading is taken to be in a sound enamel region furthest away from the lesion and the lesion measurement is taken to be the centermost reading within the lesion area.
2.6.3. Histology
After obtaining fluorescence spectroscopic data, 13 of the extracted specimens were selected at random for histology. Each specimen was placed in epoxy (EpoxySet, Allied High Tech Products Inc., California). Then, 250-μm-thick sections were cut from the specimen using a microtome saw (Leica SP1600, Leica Microsystems Inc., Illinois). The sectioned samples were then imaged with a polarized transmission microscope (Olympus BX51 optical microscope) with a quarter-wave-plate inserted. Lesion depth was determined from the PLM images and then compared to the fluorescence ratio obtained from the prototype device.
3. Results
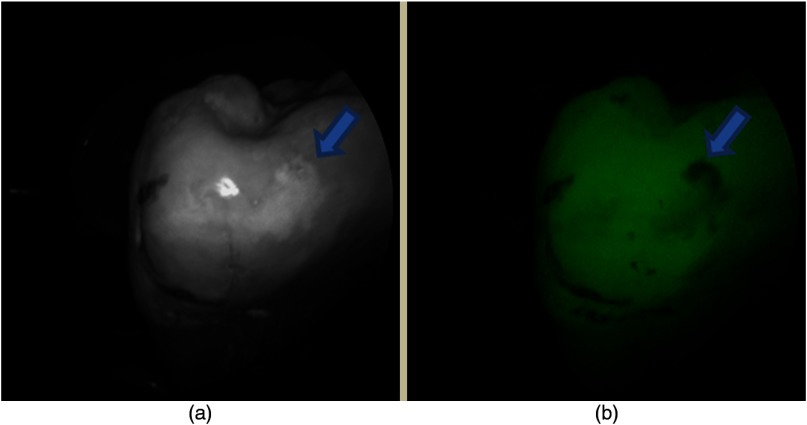
Figure 6 shows a set of extracted tooth images obtained from the prototype device. The left image in Fig. 6 shows a 405-nm reflectance image of an extracted tooth. The right image is a concurrently obtained AF image of the same tooth.
Fig. 6.
Images obtained from the multimodal clinical device. (a) a 405-nm reflectance image with high resolution and contrast of the enamel surface. (b) The AF image of the same tooth obtained concurrently with the reflectance image. The arrows indicate a region with early caries.
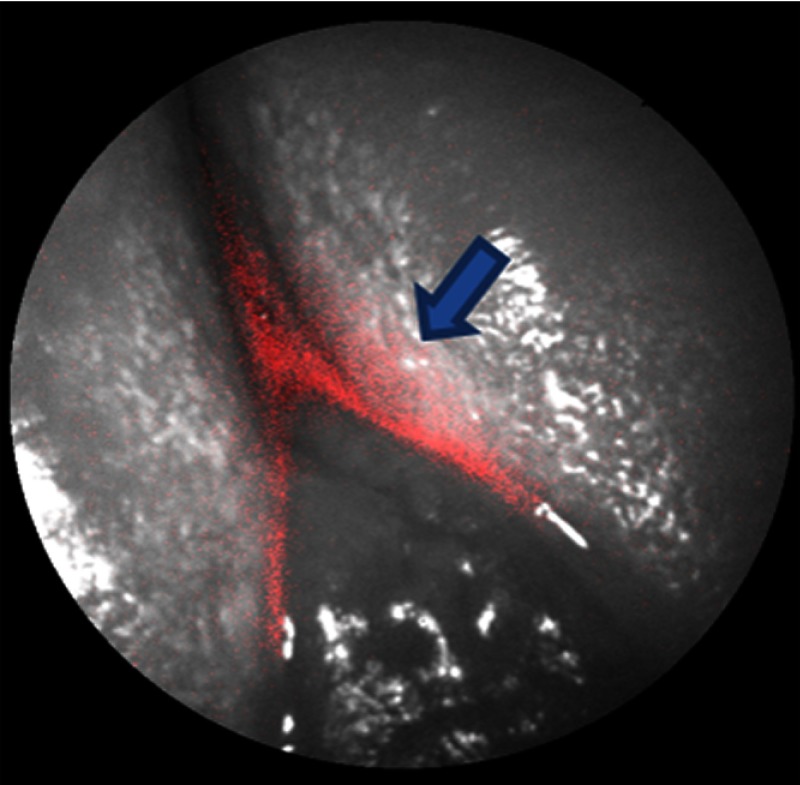
Figure 7 shows an in vivo 405-nm image of the lower front incisor at the gum line with bacterial red fluorescence overlaid. Presence of plaque is evident from the reflectance image (blue arrow) and is further supported by the presence of red bacterial fluorescence.
Fig. 7.
A mixed-mode SFE image of a lower incisor viewed from the buccal facing near the gum line. The image consists of reflectance (grayscale) data with bacterial fluorescence overlaid.
AF spectra were obtained for all specimens using 405- and 532-nm excitation. Figure 8 shows typical AF emission spectra recorded from a healthy (left) and diseased (right) tooth specimen in vivo, which matched the expected behavior of AF described in previous studies.7,8,10 The AF spectrum from 405-nm excitation has a broad emission curve centered around 480 nm and gradually tapers off toward longer wavelengths. The 532-nm emission curve is similar in shape to the 405-nm emission curve. However, it is weaker in intensity and is shifted toward the red with the peak centered around 580 nm.9,13–15 Note the increased fluorescence contribution in the 635-nm region for the diseased specimen (arrows in the right plot). This red fluorescence indicates the presence of bacterial byproducts such as protoporphyrin IX. Since the 532-nm emission curve is shifted further out toward red compared to the 405-nm emission curve, and since the bacterial fluorescence is centered around 635 nm, the superposition of the 532-nm curve with the bacterial fluorescence curve leads to a very strong peak from to 650 nm.
Fig. 8.
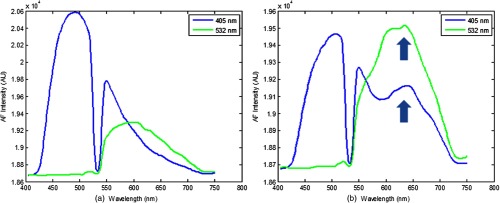
Typical AF emission spectra recorded from sound (a) and demineralized (b) enamel. The valley on the 405-nm emission curve at 532 nm is a result of the in-line 532-nm rejection filter. In (b), there is increased contribution from the bacterial fluorescence, which manifests as a hump-like feature centered around 635 nm in the 405-nm excited AF. The 532-nm emission curve is shifted further out toward red compared to the 405-nm emission curve. Since the bacterial fluorescence is centered around 635 nm, the superposition of the 532-nm curve with the bacterial fluorescence curve leads to stronger fluorescence from the 532-nm emission curve compared to the 405-nm emission curve from to 650 nm.
Sound 405/532-nm AF ratios were obtained from a healthy region (baseline) on a tooth, as well as from a region suspected to be a carious lesion. Shown in Fig. 9 is a plot that shows the obtained AF ratios from sound and demineralized enamel for each extracted specimen. Tooth-to-tooth variation in AF ratios is also seen. However, changing the metric to a ratio percent change (RPC), the variation is minimized [Eq. (1)]:
| (1) |
Fig. 9.
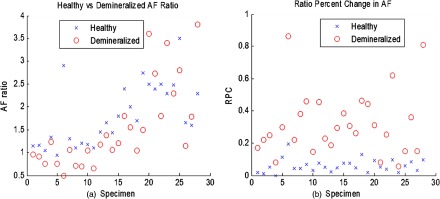
(a) 405/532-nm AF ratios obtained from both healthy and demineralized regions for each specimen. In all cases, healthy enamel exhibited higher AF ratio than demineralized ratios. However, significant interspecimen variations are seen. When changed to RPC in AF ratio compared to a baseline AF ratio for each tooth (b), the delineation between healthy and demineralized enamel becomes more distinct.
In the equation, baseline AF is measured from a known sound enamel region, and measured AF is acquired from the area of interest. Using RPC, it is possible to set a threshold value that can be used to discriminate between sound and demineralized enamel. The right side of Fig. 9 is the plot of RPC for sound and demineralized enamel for each extracted specimen. There was statistical significance between sound enamel and demineralized enamel using two-tailed Student’s tests for two samples with unequal variance at a 5% significance level.
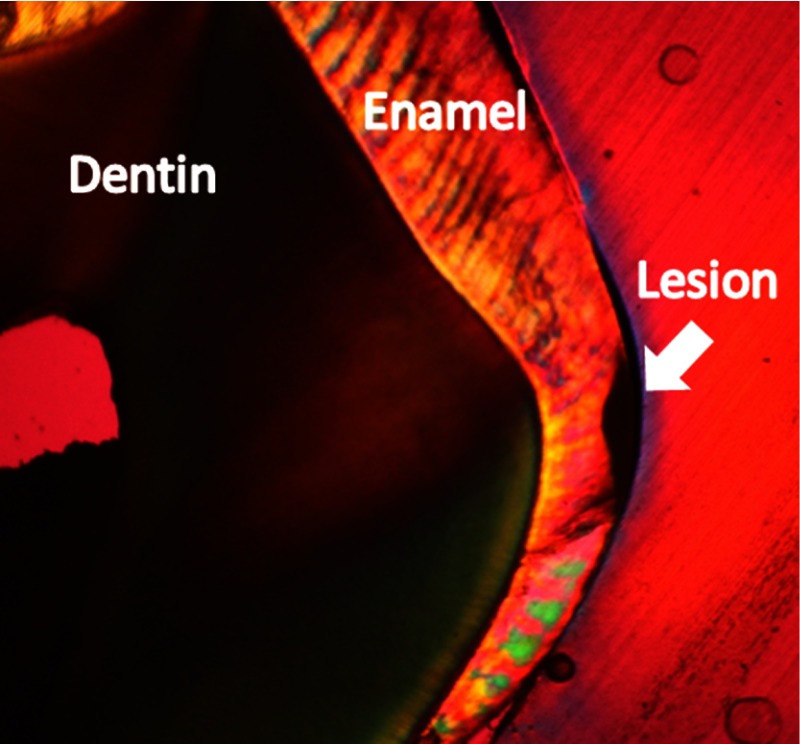
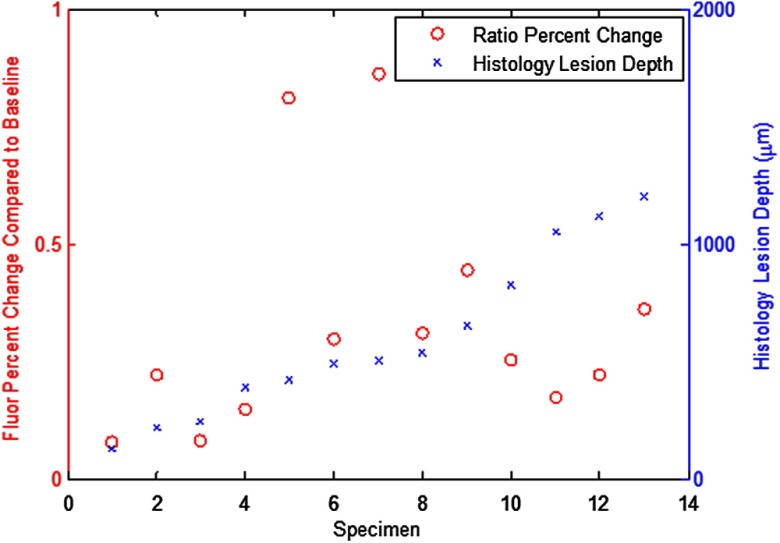
Histology via PLM confirmed presence of natural carious lesions in all 13 tested tooth specimens. Figure 10 shows a representative PLM image of a sectioned tooth with a demineralized region in the enamel at the interproximal location. The presence of an intact surface zone is visible on the surface of the enamel. A range of lesion severities from 130 to 1200 μm were measured from the PLM images. Figure 11 shows a comparison plot with lesion depth as measured from PLM for each specimen and its corresponding AF ratio change measured using the dual laser fluorescence technique.
Fig. 10.
Polarized light microscopy used to measure depth of natural carious lesions. Shown here is an interproximal lesion, which appears dark in the image. The depth of the lesion is 220 μm.
Fig. 11.
Comparison plot of PLM-measured lesion depth in blue (axis on right) and the corresponding RPC in AF ratio in red (axis on left).
We report here a case study of a young patient (4 years of age) for the evaluation of the device’s capability to work in a clinical in vivo setting. The device captured videos/images, and spectroscopic data for the patient. The small size and flexibility of the probe allowed for easy access to occlusal molar surfaces. Real-time imaging and concurrent acquisition of multiple modalities allowed the device to rapidly screen for suspicious areas of tooth decay. Figure 12 shows a 405-nm reflectance image obtained with the prototype device of the young patient with a suspected occlusal caries. The lesion was located in the occlusal groove on the occlusal surface of tooth A. The lesion reflectance appears bright compared to the surrounding healthy enamel, matching the results from the ex vivo experiments as well as previous studies.7,8 Presence of a brown spot is observed near the center of the white spot. Dual laser spectroscopy measurements were made from the surrounding healthy enamel, white spot lesion, and brown spot lesion. An RPC value of 41% was computed for the white spot lesion, and an RPC value of 70% was computed for the brown spot lesion. When interrogating both the white spot and brown spot lesions, bacterial fluorescence was evident from the characteristic hump at 635 nm. After data capture from the multimodal device, a clinician determined the clinical depth of the lesion by excavation. It was determined by the dentist that the clinical depth of the lesion reached just to the dentin–enamel junction.
Fig. 12.
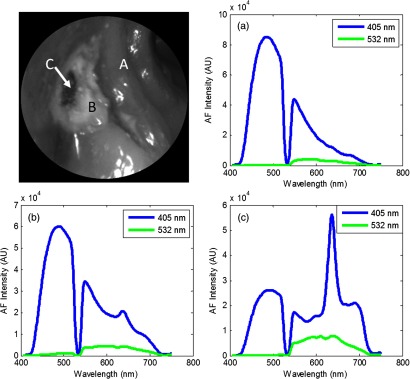
Top left: 405-nm reflectance images of an upper-left premolar of a 4-year-old patient with an occlusal lesion. The white spot lesion (B) is evident by the increased reflectance leading to a brighter appearance compared to the surrounding enamel (A). A more severe portion of the lesion (C) is evidenced by the dark spot near the center of the lesion. Top right: AF spectra from a sound region on the tooth (a). Bottom left: AF spectra from the white spot lesion (b). An RPC value of 41% is observed between sound (a) and white spot (b) enamel. Bottom right: AF spectra from the brown spot (c). An RPC value of 70% is observed between sound (a) and lesion (c). Presence of bacterial red fluorescence as evidenced by the spectral feature near 635 nm in both bottom spectra.
4. Discussion
The multimodal device was able to obtain high-contrast and high-resolution reflection images of teeth in vivo. The main factors that determine the clarity of the images are the penetration depth of the 405-nm illumination laser into the enamel and the scattering properties within the enamel. When compared to other visible wavelength illumination sources, the relatively shallow penetration depth of the 405-nm laser leads to reduced backscattering originating at greater depths in the enamel.7 Backscattering from larger depths at longer wavelengths, as with conventional white light sources, is integrated and produces a composite image that often diminishes the resolution of surface details.
Fluorescence techniques have been widely investigated for dental caries.12,15–17 However, prior techniques have attempted to detect either fluorescence from bacterial byproducts or the absence of fluorescence due to increases in optical scattering when enamel is demineralized.12 For example, the VistaProof camera system (Dürr Dental, Bietigheim-Bissingen, Germany) works by detecting loss in AF from carious lesions as well as exogenous fluorescent byproducts of bacterial action. The present device is capable of all previously investigated optical techniques of dental caries detection, while also providing higher surface resolution and contrast reflectance mode images using 405-nm illumination and also utilizing the new 405/532-nm AF ratio technique. Since two lasers traveling the same path are used, changes in tooth topography and distance from the enamel surface to the probe tip or angle of the enamel surface with respect to the probe tip will be mitigated by the ratiometric algorithm. Thus, fluorescence intensity effects due to tooth topography are minimized. Therefore, the dual laser approach additionally serves as an internal calibration technique to minimize these possible confounders. Moreover, bacterial red fluorescence, which can be detected from both the imaging as well as the spectroscopic modes, further indicates likelihood and spatial location of caries. Additionally, the imaging capabilities of the prototype device allow for the user to quickly highlight areas for quantitative spectroscopic analysis.
Standard AF techniques look for changes in fluorescence intensity as a result of changes in either optical scattering or fluorophore concentration.12,18 However, the proposed dual laser AF ratio technique works under a different hypothesis. Since demineralization of enamel preferentially affects different regions in the enamel, i.e., the enamel prisms, it is highly likely that certain fluorophore populations will be preferentially affected and will lead to differences in relative AF. It is this change in relative AF intensity that the dual laser technique detects.10
Histology via PLM confirmed the presence of enamel demineralization in extracted specimens. The PLM technique involves cutting thin sections in thickness from each specimen embedded in epoxy. Thus, the measurements made from PLM are sampled in a line of finite thickness across the lesion. Additionally, since the shape of the lesion that develops is often irregular, the PLM images obtained are only samples of a particular 250-μm-thick section through part of the lesion. Therefore, it is possible that the obtained measurements of lesion depth are not wholly representative of the volume and severity of the entire lesion.
Similar to the limitation of the PLM, the dual laser AF ratio method uses a linear sampling of sound and suspected demineralized enamel. Therefore, it is possible that the obtained measurements are accurate only for the interrogated region, but may have missed the most demineralized area. Future refinements may include a protocol to scan in a 2-D pattern.
The dual laser AF ratio method was able to distinguish between sound and demineralized enamel with statistical significance. However, the magnitude of the percent change in AF ratio did not follow closely with the depth of lesions measured from PLM histology. One of the reasons may be the linear sampling issue described in the previous paragraphs. Also, since short-wavelength light attenuates rapidly in the enamel, it is plausible that lesions of greater depth exceeded the maximum effective penetration depth of the 405-nm laser. Therefore, as lesion depth severity increased, the detection sensitivity of the dual laser system decreased.7,8 Another factor that may confound the present study’s results may be that since a strong portion of teeth AF is emitted from the dentin–enamel junction, thickness of the enamel and thus distance to the junction may affect the spectroscopic measurements. Another potential limiting factor is the need to obtain a baseline reading from a sound enamel region. While this step allows for an internal calibration standard, which is necessary since fluorescence can change from person-to-person as well as tooth-to-tooth, it is possible that developmental defects and patients with severe diffuse caries may lack suitable regions for baseline acquisition. However, in cases with such severe demineralization, techniques that look for early caries are often not needed as the demineralization should be easily seen with direct visual inspection.
Another drawback of the study is the small sample size of teeth with caries in vivo. While ex vivo experiments with extracted carious teeth yielded significant differences in AF ratios compared to sound enamel, additional studies are required to obtain more in vivo AF spectroscopic evidence of demineralized enamel. The in vivo study is ongoing and more patient data are continuously being obtained.
Acknowledgments
The authors would like to thank Camille Baltuck for her assistance on the clinical aspect of this study. They would also like to thank Dr. Daniel Fried and Kenneth Chan for their immense help in acquiring PLM images of the section specimens. The authors would also like to thank Stephanie Tran for her assistance in specimen collection and preparation. The study was partially funded by the Ocean Optics Blue Ocean Grant program, University of Washington’s Center for Commercialization, Washington Research Foundation, NIH RO1 (EB008119, PI Seibel) for image-guided laser-induced fluorescence diagnosis, and the Washington State Life Sciences Discovery Fund.
References
- 1.Bagramian R., Garcia-Godoy F., Volpe A., “The global increase in dental caries. A pending public health crisis,” Am. J. Dent. 21(1), 3–8 (2009). [PubMed] [Google Scholar]
- 2.Parisotto T., et al. , “Relationship among microbiological composition and presence of dental plaque, sugar exposure, social factors and different stages of early childhood caries,” Arch. Oral Biol. 55(5), 365–373 (2010). 10.1016/j.archoralbio.2010.03.005 [DOI] [PubMed] [Google Scholar]
- 3.Hannig H., Hannig C., “Nanomaterials in preventative dentistry,” Nat. Nanotechnol. 5(8), 565–569 (2010). 10.1038/nnano.2010.83 [DOI] [PubMed] [Google Scholar]
- 4.Virajsilp V., et al. , “Comparison of proximal caries detection in primary teeth between laser fluorescence and bitewing radiography,” Pediatr. Dent. 27(6), 493–499 (2005). [PubMed] [Google Scholar]
- 5.Arends J., Ruben J. L., Inaba D., “Major topics in quantitative microradiography of enamel and dentin: R parameter, mineral distribution visualization, and hyper-remineralization,” Adv. Dent. Res. 11(4), 403–414 (1997). 10.1177/08959374970110040501 [DOI] [PubMed] [Google Scholar]
- 6.Ganss C., Lussi A., Klimek J., “Comparison of calcium/phosphorus analysis, longitudinal microradiography and profilometry for the quantitative assessment of erosive demineralisation,” Caries Res. 39(3), 178–184 (2005). 10.1159/000084795 [DOI] [PubMed] [Google Scholar]
- 7.Zhang L., Nelson L. Y., Seibel E. J., “Spectrally enhanced imaging of occlusal surfaces and artificial shallow enamel erosions with a scanning fiber endoscope,” J. Biomed. Opt. 17(7), 076019 (2012). 10.1117/1.JBO.17.7.076019 [DOI] [PMC free article] [PubMed] [Google Scholar]
- 8.Zhang L., et al. , “Spectrally enhanced image resolution of tooth enamel surfaces,” Proc. SPIE 8208, 82080F (2012). 10.1117/12.914273 [DOI] [Google Scholar]
- 9.Zhang L., et al. , “Optical measure of enamel health,” in Global Humanitarian Technology Conference (GHTC), pp. 345–349, IEEE; (2012). [Google Scholar]
- 10.Zhang L., Nelson L. Y., Seibel E. J., “Red shifted fluorescence of dental hard tissue,” J. Biomed. Opt. 16(7), 071411 (2011). 10.1117/1.3606572 [DOI] [PubMed] [Google Scholar]
- 11.Lee C. M., et al. , “Scanning fiber endoscopy with highly flexible, 1 mm catheterscopes for wide-field, full-color imaging,” J. Biophoton. 3(5–6), 385–407 (2010). 10.1002/jbio.v3:5/6 [DOI] [PMC free article] [PubMed] [Google Scholar]
- 12.Pretty I., Edgar W., Higham S., “The validation of quantitative light-induced fluorescence to quantify acid erosion of human enamel,” Arch. Oral Biol. 49(4), 285–294 (2004). 10.1016/j.archoralbio.2003.11.008 [DOI] [PubMed] [Google Scholar]
- 13.Spitzer D., ten Bosch J. J., “Luminescence quantum yields of sound and carious dental enamel,” Calcif. Tiss. Res. 24(3), 249–251 (1977). 10.1007/BF02223324 [DOI] [PubMed] [Google Scholar]
- 14.Alfano R. R., Yao S. S., “Human teeth with and without dental caries studied by visible luminescent spectroscopy,” J. Dent. Res. 60(2), 120–122 (1981). 10.1177/00220345810600020401 [DOI] [PubMed] [Google Scholar]
- 15.Buchalla W., “Comparative fluorescence spectroscopy shows differences in noncavitated enamel lesions,” Caries Res. 39(2), 150–156 (2005). 10.1159/000083162 [DOI] [PubMed] [Google Scholar]
- 16.Zandoná A., Zero D., “Diagnostic tools for early caries detection,” JADA 137(8), 1675–1684 (2006). [DOI] [PubMed] [Google Scholar]
- 17.Thomas S., et al. , “Clinical trial for detection of dental caries using laser-induced fluorescence ratio reference standard,” J. Biomed. Opt. 15(2), 027001 (2010). 10.1117/1.3365945 [DOI] [PubMed] [Google Scholar]
- 18.Zezell D. M., “Characterization of natural caries lesions by fluorescence spectroscopy at 405-nm excitation wavelength,” J. Biomed. Opt. 12(6), 064013 (2007). 10.1117/1.2821192 [DOI] [PubMed] [Google Scholar]


