

Abstract
Objective
Regulatory bodies and insurers evaluate hospital quality using obstetrical outcomes, however meaningful comparisons should take pre-existing patient characteristics into account. Furthermore, if risk-adjusted outcomes are consistent within a hospital, fewer measures and resources would be needed to assess obstetrical quality. Our objective was to establish risk-adjusted models for five obstetric outcomes and assess hospital performance across these outcomes.
Study Design
A cohort study of 115,502 women and their neonates born in 25 hospitals in the United States between March 2008 and February 2011. Hospitals were ranked according to their unadjusted and risk-adjusted frequency of venous thromboembolism, postpartum hemorrhage, peripartum infection, severe perineal laceration, and a composite neonatal adverse outcome. Correlations between hospital risk-adjusted outcome frequencies were assessed.
Results
Venous thromboembolism occurred too infrequently (0.03%, 95% CI 0.02% – 0.04%) for meaningful assessment. Other outcomes occurred frequently enough for assessment (postpartum hemorrhage 2.29% (95% CI 2.20–2.38), peripartum infection 5.06% (95% CI 4.93–5.19), severe perineal laceration at spontaneous vaginal delivery 2.16% (95% CI 2.06–2.27), neonatal composite 2.73% (95% CI 2.63–2.84)). Although there was high concordance between unadjusted and adjusted hospital rankings, several individual hospitals had an adjusted rank that was substantially different (as much as 12 rank tiers) than their unadjusted rank. None of the correlations between hospital adjusted outcome frequencies was significant. For example, the hospital with the lowest adjusted frequency of peripartum infection had the highest adjusted frequency of severe perineal laceration.
Conclusions
Evaluations based on a single risk-adjusted outcome cannot be generalized to overall hospital obstetric performance.
Keywords: Quality, risk-adjustment, obstetrics, performance improvement
Admission for delivery constitutes the most common indication for hospitalization in the United States.1 The sheer volume of deliveries, as well as the fact that each admission has the potential to affect the short and long term health of at least two individuals (a mother and her newborn), underscores the importance of achieving high quality delivery care.
Correspondingly, measuring these outcomes should be an important component of quality improvement.1–3 Yet, because outcomes may be dependent upon pre-existing patient characteristics, simply measuring health outcomes may not provide insight into quality of care or allow valid comparisons among institutions. To overcome this limitation, risk adjustment has been widely employed in clinical disciplines such as cardiothoracic surgery to assess outcomes for procedures such as lung resection or coronary artery bypass grafting (CABG). 4–6 Such risk adjustment, however, has been used inconsistently in evaluation of obstetric outcomes. 7
Moreover, as quality measurement increases, so does the need to do such measurement parsimoniously. Many consumers and providers tend to think of hospitals as having consistent quality within a given discipline, in which case measures should be highly correlated and fewer aspects of care would need to be assessed. Conversely, if measures are not correlated, multiple measures would need to be collected to enable an accurate assessment of performance.
Our objective was thus to establish risk adjustment models for use in obstetrics that adjust for pre-existing patient characteristics and, using these models, assess the consistency of hospital performance across commonly measured obstetrical outcomes.
METHODS
Study Design
Between 2008 and 2011, we performed a cohort study at all 25 hospitals of the Eunice Kennedy Shriver National Institute of Child Health and Human Development Maternal-Fetal Medicine Units (MFMU) Network. The Assessment of Perinatal EXcellence (APEX) study was designed to develop quality measures for intrapartum obstetrical care. This study was approved by the Institutional Review Board at each participating institution under a waiver of informed consent.
Patients eligible for data collection were those who delivered within the institution, were at least 23 weeks of gestation, and had a live fetus on admission. Data were collected on eligible patients if they delivered during the 24-hour period of selected days during a three-year period (March 2008 to February 2011). Days were chosen via computer-generated random selection. To avoid overrepresentation of patients from larger hospitals, we selected one-third of days at hospitals with annual delivery volumes from 2,000 to 7,000 and up to one-sixth of days at hospitals with annual deliveries > 7,000. The randomization scheme was stratified by weekdays, weekends and holidays and generated separately for each hospital. On selected days, the labor and delivery logbook at each participating center was screened to identify all eligible women. The medical records of all eligible women and their newborns were abstracted by trained and certified research personnel at the hospital and entered into a web-based data entry system. Data recorded included demographic characteristics, details of the medical and obstetrical history, information about intrapartum and postpartum events and patients’ race and ethnicity as reported in the chart. Maternal data were collected until discharge and neonatal data were collected up until discharge or until 120 days of age.
Feasibility and quality of data collection were ensured by several mechanisms. First, prior to selecting final data fields and forms, a two-week pilot study took place to evaluate the data collection process, quality of the data and frequency of missing data. Based on the information gathered during this pilot phase, final data fields were selected and forms revised. All data were subjected to ongoing data edits to ensure accuracy.
Primary Outcomes
An initial determination of the primary obstetric outcomes of interest was made via expert consensus, obtained during meetings of members of the MFMU Steering Committee and an external advisory committee convened specifically for this project (Acknowledgments). Based on input from these committees, five primary outcomes were chosen because they represented different domains of obstetric complications, were clinically meaningful, could be affected by differences in clinical care, were ascertainable from medical records, and potentially occurred with sufficient frequency to allow valid institutional comparisons: venous thromboembolism, postpartum hemorrhage, peripartum infection, severe perineal laceration, and a composite neonatal adverse outcome.8–12 Venous thromboembolism was defined as occurrence of either a deep venous thrombosis diagnosed by Duplex Doppler or a pulmonary embolism diagnosed by computed tomography or ventilation-perfusion lung scan. Postpartum hemorrhage was defined as occurrence of any of the following: an estimated blood loss ≥ 1500cc at delivery or the immediate postpartum period, a blood transfusion, or a hysterectomy for hemorrhage, placenta accreta or atony. Peripartum infection was defined as occurrence of any of the following: chorioamnionitis, endometritis, wound cellulitis requiring antibiotics, wound re-opened for fluid collection or infection, or wound dehiscence during the delivery hospitalization. Severe perineal laceration was defined as the occurrence of a 3rd or 4th degree perineal laceration, was restricted to women with vaginal singleton deliveries with no shoulder dystocia or placenta previa, and was stratified by spontaneous, vacuum, or forceps delivery. The composite neonatal adverse outcome was defined as occurrence of any of the following restricted to term (≥ 37 weeks of gestation), non-anomalous singleton infants: neonatal stay longer than maternal stay by 3 or more calendar days, 5 minute Apgar score < 4, skeletal fracture other than of the clavicle, facial nerve palsy, brachial plexus palsy, subgaleal hemorrhage, ventilator support, hypoxic ischemic encephalopathy, stillbirth after hospital admission or neonatal death. Additional details regarding the definitions of these outcomes and relevant denominators can be found online in eTable 1.
Statistical Analyses
At each institution, the unadjusted frequencies of adverse outcomes, with 95% confidence intervals, were calculated and were compared using the chi-square test. The analysis was then directed at assessing which patient characteristics were significantly associated with the chosen outcomes. Patient characteristics eligible for multivariable models were selected a priori based on whether they could plausibly be associated with the outcome. Prior to multivariable analysis, the possibility of collinearity among patient characteristics was assessed. Continuous variables were first assessed to determine whether their association with each outcome was linear, by assessing the linearity of the log(odds), using a locally weighted scatterplot smoothing technique (LOESS). When there was evidence of non-linearity, we included both linear and quadratic terms. Model selection was based on creating derivation and validation data sets using a k-fold cross-validation approach in which the cohort was randomly divided into 10 equal parts and logistic regression models, using backward selection, were generated utilizing every possible combination of 9 of the 10 sets.13 Variables with P<0.05 were retained, and each of the 10 subsamples was used for validation. The C statistic was computed to assess each model’s predictive ability (discrimination). Only those variables that were present in the logistic regression model with the highest C statistic and also were present in at least 8 of the 10 k-fold logistic regression models were chosen for the final multivariable model that included the entire data set. Because assessment of the Hosmer-Lemeshow test statistic (p-value) is not recommended for data sets as large as ours,14 model fit was assessed from graphical displays of the observed and expected number of patients within each partition of the Hosmer-Lemeshow test.
The final multivariable models were then used to estimate hospitals’ expected outcome frequencies. To estimate a hospital’s expected outcome frequency, which is the hospital’s outcome frequency that would be expected given the characteristics of their patients, the predicted outcome probability was estimated for each patient and then all patient probabilities within the same hospital were averaged (online eStatistics text). These expected outcome frequencies were used to calculate an observed (unadjusted) to expected ratio (OER).15 Bootstrapping was performed on 1000 samples with replacement to estimate 99% confidence intervals around the OER and identify the hospitals that were significantly different from an OER of 1.0. OERs can be interpreted as such: if the ratio is < 1.0 the hospital has fewer adverse outcomes than expected; if the ratio = 1.0 the hospital has as many adverse outcomes as expected; and if the ratio is > 1.0 the hospital has more adverse outcomes than expected. Because we were estimating individual hospital frequencies, the primary models did not adjust for hospital; however, regressions accounting for patient clustering within a hospital (i.e., adding hospital as a fixed effect to the logistic model or as a random effect to a hierarchical model) were performed to evaluate whether either adjustment altered the strength and precision of the estimated odds ratios for the patient characteristics.
For each outcome, hospitals were ranked according to their unadjusted frequency and re-ranked according to their adjusted frequency, and Kendall’s coefficient of concordance was used to assess the degree to which these rankings were similar. Correlations of hospital adjusted frequencies for each pair of outcomes were tested using Spearman’s rank correlation.
SAS software (SAS Institute, Cary, NC) was used for the analyses. All tests were two-tailed. P<0.01 was used to define statistical significance and 99% CIs were estimated when directly testing a hypothesis, i.e., correlations between outcomes, concordance between unadjusted and adjusted ranks, and to identify hospital outliers. P<0.05 and 95%CIs were estimated for model building and more descriptive analyses.
RESULTS
During the study period, data were collected on 115,502 women and their neonates at 25 hospitals. The majority of hospitals were teaching hospitals (22/25, 88%). Most also had round-the-clock availability of a maternal-fetal medicine specialist (21/25, 84%), in-house obstetric attending (21/25, 84%), neonatologist (20/25, 80%), and dedicated obstetric anesthesiologist (22/25, 88%). The median number of deliveries at the study hospitals was 4252. Over forty percent of women were nulliparous, 2.4% had a multiple gestation, and 27.4% of multiparous women had previously undergone cesarean delivery (Table 1; online eTable 1 for definitions); 94.1% of newborns were vertex at delivery, 13.1% were preterm (< 37 weeks’ gestation at delivery), and 10.6% weighed less than 2500 grams at birth.
Table 1.
Maternal (N = 115,502) and Neonatal (N = 118,422)
Characteristics of the Study Population
| Maternal Characteristics | No. (%) |
|---|---|
| Age, y | |
| < 20 | 10187 (8.8) |
| 20–24.9 | 24299 (21.0) |
| 25–29.9 | 31101 (26.9) |
| 30–34.9 | 30570 (26.5) |
| ≥ 35 | 19345 (16.8) |
| Race/ethnicitya | |
| Non-Hispanic White | 52040 (45.1) |
| Non-Hispanic Black | 23878 (20.7) |
| Non-Hispanic Asian | 5999 (5.2) |
| Hispanic | 27291 (23.6) |
| Other | 5083 (4.4) |
| Not Documented | 1211 (1.1) |
| Body mass index at delivery, kg/m2b | |
| < 25 | 14242 (12.6) |
| 25–29.9 | 41268 (36.5) |
| 30–34.9 | 32088 (28.4) |
| 35–39.9 | 15088 (13.3) |
| ≥ 40 | 10481 (9.3) |
| Cigarette use during pregnancy | 11370 (9.9) |
| Cocaine or methamphetamine use during pregnancy | 830 (0.7) |
| Insurance status | |
| Uninsured/self-pay | 11989 (10.5) |
| Government-assisted | 45125 (39.4) |
| Private | 57462 (50.2) |
| Prenatal careb | 107510 (97.9) |
| Obstetric history | |
| Nulliparous | 46773 (40.5) |
| Prior vaginal delivery only | 49865 (43.2) |
| Prior cesarean only | 8872 (7.7) |
| Prior cesarean and vaginal | 9963 (8.6) |
| Any hypertension | 13272 (11.5) |
| Diabetes mellitus | |
| None | 106706 (92.4) |
| Gestational | 6999 (6.1) |
| Pre-gestational | 1734 (1.5) |
| Anticoagulant use during pregnancy | 920 (0.8) |
| Multiple gestation | 2815 (2.4) |
| Polyhydramnios | 940 (0.8) |
| Oligohydramnios | 4700 (4.1) |
| Placenta previa | 467 (0.4) |
| Placenta accreta | 162 (0.1) |
| Placental abruption | 930 (0.8) |
| PROM/PPROMb | 6004 (5.3) |
| GBS status | |
| Negative | 68918 (59.7) |
| Positive | 24390 (21.1) |
| Unknown | 22194 (19.2) |
| Neonatal Characteristics | |
| Presentation at delivery | |
| Vertex | 111174 (94.1) |
| Breech | 6010 (5.1) |
| Non breech malpresentation | 931 (0.8) |
| Gestational age at delivery, weeks | |
| 230through276 | 1256 (1.1) |
| 280 through336 | 4282 (3.6) |
| 340 through366 | 10024 (8.5) |
| 370 through376 | 10914 (9.2) |
| 380 through386 | 20723 (17.5) |
| 390 through396 | 37695 (31.8) |
| 400 through406 | 23876 (20.2) |
| 410 through416 | 8998 (7.6) |
| ≥ 420 | 654 (0.6) |
| Birthweight, g | |
| < 2500 | 12498 (10.6) |
| 2500–3999 | 96708 (81.7) |
| ≥ 4000 | 9186 (7.8) |
| Size for gestational age | |
| Small | 11530 (9.7) |
| Appropriate | 97774 (82.6) |
| Large | 9088 (7.7) |
Abbreviations: PROM/PPROM = premature rupture of the membranes or preterm premature rupture of the membranes; GBS = group B streptococcus.
Race/ethnicity was reported in the chart.
N = 113,167 with body mass index data; N = 109,773 with prenatal care visit data; N = 113,446 with PROM/PPROM data.
Given the infrequency of venous thromboembolism it was excluded from further analysis. The frequencies of the other chosen outcomes were more common and differed significantly across hospitals (Table 2; P<0.001 for all).
Table 2.
Observed Hospital Frequencies of Obstetric Outcomes
| Outcome | Number of outcomes | Denominator size for each outcome | Frequency Percent (95% CI) | Lowest Frequency Percent | Median Frequency Percent | Highest Frequency Percent |
|---|---|---|---|---|---|---|
| Venous thromboembolisma | 31 | 115,499 | 0.03 (0.02–0.04) | 0.00 | 0.02 | 0.07 |
| Postpartum hemorrhageb | 2425 | 105,987 | 2.29 (2.20–2.38) | 0.82 | 2.09 | 4.86 |
| Peripartum Infectionb | 5581 | 110,205 | 5.06 (4.93–5.19) | 2.19 | 5.34 | 9.69 |
| Severe perineal laceration at SVDc | 1475 | 68,144 | 2.16 (2.06–2.27) | 1.01 | 2.00 | 4.89 |
| Severe perineal laceration at FVDc | 523 | 1,898 | 27.56 (25.54–29.57) | 8.00 | 32.56 | 48.15 |
| Severe perineal laceration at VVDc | 510 | 3,515 | 14.51 (13.34–15.67) | 3.73 | 13.99 | 48.15 |
| Composite neonatal adverse outcomed | 2440 | 89,279 | 2.73 (2.63–2.84) | 0.96 | 2.61 | 5.91 |
Abbreviations: SVD = spontaneous vaginal delivery; FVD = forceps-assisted vaginal delivery; VVD = vacuum-assisted vaginal delivery.
Among all women with complete outcome data.
Among all women with complete outcome and covariable data.
Among women with singleton delivery and no shoulder dystocia or placenta previa and complete outcome and covariable data.
Among women with term, non-anomalous singleton infants and complete outcome and covariable data.
The variables retained in the final multivariable model for each outcome are listed in Table 3 (online eTable 2 for a full list of variables assessed; online eTables 3–8 for the parameter estimates, odds ratios and 95% confidence intervals). A core group of patient-specific factors (maternal age, body mass index, insurance status, gestational age or birth weight, obstetric history, diabetes mellitus, and smoking) was significantly associated with multiple outcomes. The C statistic for each model, which ranged from 0.68 – 0.79 with lower bounds of the 95% CIs all greater than 0.50 (Table 3), demonstrate that in all cases patient factors were at least somewhat, but not fully predictive of outcomes. Model calibration showed good model fit of the observed and expected number of patients within each partition of the Hosmer-Lemeshow test with or without each outcome (online eFigures 1–6). Model fit was similar whether continuous variables were entered into the model as categorical variables based on clinically relevant cut-points, and confirmed as appropriate from the LOESS plots, or as linear (and quadratic when appropriate) terms; for ease of interpretation the models with categorical variables are presented online in eTables 3–8. Overall, the odds ratios and 95% confidence intervals associated with each patient characteristic were not substantially altered after accounting for patient clustering within a hospital in either logistic or hierarchical regression models (online eTables 3–8).
Table 3.
Final Multivariable Model for Each Obstetric Outcome
| Postpartum hemorrhagea | Peripartum infectiona | Severe perineal laceration at SVDb | Severe perineal laceration at FVDbc | Severe perineal laceration at VVDbc | Composite neonatal adverse outcomed | |
|---|---|---|---|---|---|---|
| Denominator size | 105,987 | 110,205 | 68,144 | 1,898 | 3,515 | 89,279 |
| Maternal characteristics | ||||||
| Age | • | • | • | • | • | |
| Body mass index at delivery | • | • | • | • | • | |
| Cigarette use during pregnancy | • | • | • | • | • | |
| Cocaine or methamphetamine use during pregnancy | • | |||||
| Insurance status | • | • | • | • | • | • |
| Prenatal care | • | • | ||||
| Obstetric history | • | • | • | • | • | • |
| Any hypertension | • | • | ||||
| Diabetes mellitus (gestational, pre-gestational) | • | • | • | |||
| Anticoagulant use during pregnancy | • | |||||
| Multiple gestation | • | |||||
| Placenta previa | • | |||||
| Placenta accreta | • | |||||
| Placental abruption | • | |||||
| PROM/PPROM | • | • | ||||
| GBS status | • | |||||
| Neonatal characteristics | ||||||
| Gestational age at delivery | • | |||||
| Birthweight | • | • | • | • | ||
| Size for gestational age | • | |||||
| C statistic (95% CI) | 0.74 (0.73–0.75) | 0.75 (0.74–0.75) | 0.79 (0.78–0.80) | 0.68 (0.65–0.70) | 0.69 (0.67–0.72) | 0.68 (0.67–0.69) |
Dots signify that the variables in the final multivariable model.
Abbreviations: SVD = spontaneous vaginal delivery; FVD = forceps-assisted vaginal delivery; VVD = vacuum-assisted vaginal delivery; PROM/PPROM = premature rupture of the membranes or preterm premature rupture of the membranes; GBS = group B streptococcus.
Among all women with complete outcome and covariable data.
Among women with singleton delivery and no shoulder dystocia or placenta previa and complete outcome and covariable data.
Final model based on the k-fold analysis for the outcome of severe perineal laceration at SVD.
Among women with term, non-anomalous singleton infants and complete outcome and covariable data.
The graphs of the hospital ranks based on unadjusted frequencies compared with the ranks based on adjusted frequencies are presented in Figures 1a–1f. Statistically there was a relatively high concordance between the unadjusted and adjusted ranks (Kendell’s coefficient of concordance 0.86–0.98; online eTable 9). However, there were hospitals where their rank based on their adjusted frequency differed substantially (as much as 12 rank tiers) from their rank based on their unadjusted frequency.
Figure 1.


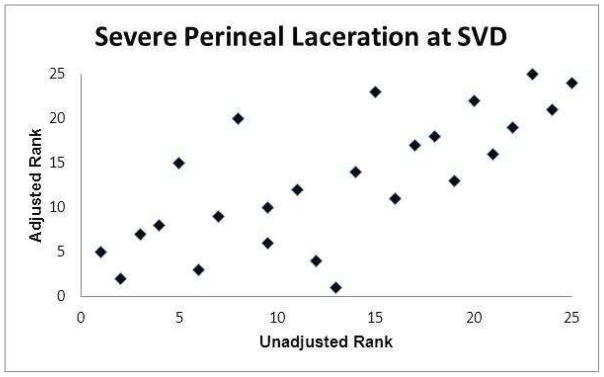


Association between hospital ranks based on observed (unadjusted) outcome frequencies and hospital ranks based on adjusted outcome frequencies.
(a) Postpartum hemorrhage
(b) Peripartum infection
(c) Severe perineal laceration at spontaneous vaginal delivery (SVD)
(d) Severe perineal laceration at forceps-assisted vaginal delivery (FVD)
(e) Severe perineal laceration at vacuum-assisted vaginal delivery (VVD)
(f) Composite neonatal adverse outcome
None of the comparisons of hospital risk-adjusted frequencies between outcomes was significantly correlated: hemorrhage vs. neonatal (rho = −0.05, P=0.83), hemorrhage vs. infection (rho = 0.26, P=0.21), hemorrhage vs. laceration (rho = −0.29, P=0.16), infection vs. laceration (rho = −0.23, P=0.26), infection vs. neonatal (rho = 0.02, P=0.93), and laceration vs. neonatal (rho = −0.13, P=0.52).
For each outcome, several hospitals were noted to have OERs that were significantly different from 1, a fact which indicates that they were achieving outcome frequencies that were significantly different (better or worse) than expected based on their population of patients (Table 4). When hospitals were ranked according to their OERs and characterized by outlier status for each outcome (Table 4, color green indicating upper bound of the O/E 99% CI < 1.0; color red indicating lower bound of the O/E 99% CI > 1.0), there was no evidence that particular hospitals consistently performed either better or worse than expected across the outcomes.
Table 4.
Hospital Rankings by OER
| Postpartum hemorrhagea | Peripartum infectiona | Severe perineal laceration at SVDb | Composite neonatal adverse outcomec | |
|---|---|---|---|---|
| Denominator size for each outcome | 105,987 | 110,205 | 68,144 | 89,279 |
| Hospital | ||||
| A | 17 | 20 | 24 | 2 |
| B | 18 | 17 | 3 | 7 |
| C | 15 | 23 | 11 | 4 |
| D | 16 | 21 | 1 | 22 |
| E | 6 | 2 | 21 | 1 |
| F | 12 | 3 | 9 | 6 |
| G | 21 | 12 | 6 | 5 |
| H | 20 | 4 | 22 | 8 |
| I | 3 | 16 | 20 | 16 |
| J | 22 | 19 | 5 | 9 |
| K | 2 | 11 | 13 | 23 |
| L | 8 | 1 | 25 | 21 |
| M | 13 | 18 | 7 | 25 |
| N | 24 | 10 | 4 | 18 |
| O | 5 | 14 | 14 | 10 |
| P | 1 | 7 | 18 | 17 |
| Q | 9 | 9 | 2 | 13 |
| R | 7 | 24 | 17 | 14 |
| S | 19 | 25 | 10 | 15 |
| T | 25 | 22 | 23 | 12 |
| U | 4 | 13 | 19 | 3 |
| V | 14 | 6 | 12 | 19 |
| W | 23 | 8 | 15 | 24 |
| X | 11 | 15 | 8 | 11 |
| Y | 10 | 5 | 16 | 20 |
Abbreviations: OER = observed (unadjusted) to expected ratio SVD = spontaneous vaginal delivery.
Green indicates upper bound of the O/E 99% CI < 1.0; red indicates lower bound of the O/E 99% CI > 1.0; white indicates O/E 99% CI includes 1.0.
Among all women with complete outcome and covariable data.
Among women with singleton delivery and no shoulder dystocia or placenta previa and complete outcome and covariable data.
Among women with term, non-anomalous singleton infants and complete outcome and covariable data.
COMMENTS
In this study, we developed and applied risk-adjustment models for clinically meaningful obstetric outcomes. Of the five outcomes that were chosen a priori, four (postpartum hemorrhage, peripartum infection, severe perineal laceration, and the composite neonatal adverse outcome) were found both to be frequent enough and to vary sufficiently among hospitals that they could serve as useful outcome measures. However, these outcomes are significantly related to multiple patient characteristics, and we believe that risk adjustment is preferable if such outcomes are used to reflect institutional quality of care. Furthermore, these risk adjustment models reveal that the rankings according to obstetric outcomes are poorly correlated with one another. Thus, performance assessment based on a single outcome measure cannot be generalized to characterize overall quality of obstetric care. Instead, multiple markers of quality need to be assessed and reported in order to gain insight into the obstetrical quality profile of a hospital.
The APEX study represents a significant contribution in the examination of obstetric outcomes among hospitals as the data are not derived from an administrative dataset but through chart review by trained abstractors. We optimized data quality by employing a data abstraction approach, described by Pronovost et al,16 in that we used explicit definitions for data fields, standardized data collection tools, and pilot testing of data collection methods. Additionally, there were ongoing data edits.
Our analysis reveals that multiple patient factors are associated with our chosen outcomes. The C statistics are consistent with those associated with other accepted risk-adjustment models, such as those used for CABG-related mortality. 4,6,17 While the overall concordance between institutions’ observed (unadjusted) and adjusted ranks was high, individual institutions may appear quite differently in terms of rank order if their adjusted, as opposed to their observed frequencies, are considered. Also, although two institutions may have observed frequencies that are quite similar, one may be performing significantly better than expected, while the other is performing significantly worse than expected, once patient characteristics are considered. The change in rank order has potential implications for benchmarking as well as economic implications in the context of pay-for-performance.18 In addition, case-mix adjustment removes the incentive for hospitals to limit access to patients at greater risk of complications in order to lessen the frequency of observed morbidity.
Limitations of this work should be noted. Patients in this study were from hospitals that are affiliated with academic institutions, and as such may not be representative of patients throughout the country. However, the general characteristics of the patients illustrate that the population is similar across many dimensions (e.g., body mass index, multiple gestations) to a more general American obstetric population. Also, the risk-adjustment models incorporate data that, at present, would not be readily available from administrative databases, and thus could not be easily introduced into widespread use. Yet, the variables in the models could be captured from electronic medical records, which are increasing in prevalence and sophistication.
In summary, we believe risk-adjustment is necessary if obstetrical outcomes are to be compared meaningfully between institutions. However, the intra-institutional risk-adjusted probabilities of different obstetric outcomes are poorly correlated and thus performance based on a single outcome cannot be generalized to overall obstetrical performance. Furthermore, use of up to four risk-adjusted outcomes did not allow for a summary assessment of overall hospital obstetric quality. These findings underscore the complexity of quality measurement and that the current methods of summarizing hospital performance in obstetrics should be reappraised.
Acknowledgments
The authors thank the subcommittee members who participated in protocol development and coordination between clinical research centers (Cynthia Milluzzi, R.N. and Joan Moss, R.N.C., M.S.N.), protocol/data management and statistical analysis (Elizabeth Thom, Ph.D.), and protocol development and oversight (Brian M. Mercer, M.D.).
The project described was supported by grants from the Eunice Kennedy Shriver National Institute of Child Health and Human Development (NICHD) [HD21410, HD27869, HD27915, HD27917, HD34116, HD34208, HD36801, HD40500, HD40512, HD40544, HD40545, HD40560, HD40485, HD53097, HD53118] and the National Center for Research Resources [UL1 RR024989; 5UL1 RR025764] and its contents do not necessarily represent the official views of the NICHD, NCRR, or NIH.
In addition to the authors, other members of the Eunice Kennedy Shriver National Institute of Child Health and Human Development Maternal-Fetal Medicine Units Network are as follows:
Case Western Reserve University-MetroHealth Medical Center, Cleveland, OH – B. Mercer, C. Milluzzi, W. Dalton, T. Dotson, P. McDonald, C. Brezine, A. McGrail
Northwestern University, Chicago, IL – G. Mallett, M. Ramos-Brinson, A. Roy, L. Stein, P. Campbell, C. Collins, N. Jackson, M. Dinsmoor (NorthShore University HealthSystem), J. Senka (NorthShore University HealthSystem), K. Paychek (NorthShore University HealthSystem), A. Peaceman
Columbia University, New York, NY – M.Talucci, M. Zylfijaj, Z. Reid (Drexel U.), R. Leed (Drexel U.), J. Benson (Christiana H.), S. Forester (Christiana H.), C. Kitto (Christiana H.), S. Davis (St. Peter’s UH.), M. Falk (St. Peter’s UH.), C. Perez (St. Peter’s UH.)
University of Utah Health Sciences Center, Salt Lake City, UT – K. Hill, A. Sowles, J. Postma (LDS Hospital), S. Alexander (LDS Hospital), G. Andersen (LDS Hospital), V. Scott (McKay-Dee), V. Morby (McKay-Dee), K. Jolley (UVRMC), J. Miller (UVRMC), B. Berg (UVRMC)
University of North Carolina at Chapel Hill, Chapel Hill, NC – K. Dorman, J. Mitchell, E. Kaluta, K. Clark (WakeMed), K. Spicer (WakeMed), S. Timlin (Rex), K. Wilson (Rex)
University of Texas Southwestern Medical Center, Dallas, TX – L. Moseley, M. Santillan, J. Price, K. Buentipo, V. Bludau, T. Thomas, L. Fay, C. Melton, J. Kingsbery, R. Benezue
University of Pittsburgh, Pittsburgh, PA – H. Simhan, M. Bickus, D. Fischer, T. Kamon (deceased), D. DeAngelis
The Ohio State University, Columbus, OH – C. Latimer, L. Guzzo (St. Ann’s), F. Johnson, L. Gerwig (St. Ann’s), S. Fyffe, D. Loux (St. Ann’s), S. Frantz, D. Cline, S. Wylie, J. Iams
University of Alabama at Birmingham, Birmingham, AL – M. Wallace, A. Northen, J. Grant, C. Colquitt, D. Rouse, W. Andrews
University of Texas Medical Branch, Galveston, TX – J. Moss, A. Salazar, A. Acosta, G. Hankins
Wayne State University, Detroit, MI – N. Hauff, L. Palmer, P. Lockhart, D. Driscoll, L. Wynn, C. Sudz, D. Dengate, C. Girard, S. Field
Brown University, Providence, RI – P. Breault, F. Smith, N. Annunziata, D. Allard, J. Silva, M. Gamage, J. Hunt, J. Tillinghast, N. Corcoran, M. Jimenez
The University of Texas Health Science Center at Houston-Children’s Memorial Hermann Hospital, Houston, TX – F. Ortiz, P. Givens, B. Rech, C. Moran, M. Hutchinson, Z. Spears, C. Carreno, B. Heaps, G. Zamora
Oregon Health & Science University, Portland, OR – J. Seguin, M. Rincon, J. Snyder, C. Farrar, E. Lairson, C. Bonino, W. Smith (Kaiser Permanente), K. Beach (Kaiser Permanente), S. Van Dyke (Kaiser Permanente), S. Butcher (Kaiser Permanente)
The George Washington University Biostatistics Center – E. Thom, Y. Zhao, P. McGee, V. Momirova, R. Palugod, B. Reamer, M. Larsen
Eunice Kennedy Shriver National Institute of Child Health and Human Development, Bethesda, MD – S. Tolivaisa
Members of the external advisory committee: The following experts contributed to choice of outcome measures, without compensation: Peter G. Goldschmidt, M.D., Dr.P.H., Health Improvement Institute, Bethesda, MD; Jeffrey B. Gould, M.D., M.P.H., Stanford University, Palo Alto, CA; Bill Munier, M.D., Agency for Healthcare Research and Quality, Rockville, MD; Elliott K. Main, M.D., California Pacific Medical Center, San Francisco, CA; Patrick S. Romano, M.D., M.P.H., University of California, Davis, Sacramento, CA; Kimberly Gregory, M.D., M.P.H., Cedars-Sinai Medical Center, Los Angeles, CA; Gary Hankins, M.D., University of Texas Medical Branch, Galveston, TX; George A. Macones, M.D., Washington University, St. Louis, MO; Jeanne-Marie M. Guise, M.D., Oregon Health & Science University, Portland, OR.
Footnotes
This study was presented at the 32nd Annual meeting of the Society for Maternal-Fetal Medicine in Dallas, TX on February 9, 2012
The authors report no conflicts of interest
Publisher's Disclaimer: This is a PDF file of an unedited manuscript that has been accepted for publication. As a service to our customers we are providing this early version of the manuscript. The manuscript will undergo copyediting, typesetting, and review of the resulting proof before it is published in its final citable form. Please note that during the production process errors may be discovered which could affect the content, and all legal disclaimers that apply to the journal pertain.
References
- 1.Chassin MR, Loeb JM, Schmaltz SP, Wachter RM. Accountability measures--using measurement to promote quality improvement. N Engl J Med. 2010;363:683–8. doi: 10.1056/NEJMsb1002320. [DOI] [PubMed] [Google Scholar]
- 2.Burstin HR, Conn A, Setnik G, et al. Benchmarking and quality improvement: the Harvard Emergency Department Quality Study. Am J Med. 1999;107:437–49. doi: 10.1016/s0002-9343(99)00269-7. [DOI] [PubMed] [Google Scholar]
- 3.Draycott T, Sibanda T, Laxton C, Winter C, Mahmood T, Fox R. Quality improvement demands quality measurement. BJOG. 2010;117:1571–4. doi: 10.1111/j.1471-0528.2010.02734.x. [DOI] [PubMed] [Google Scholar]
- 4.Shroyer AL, Plomondon ME, Grover FL, Edwards FH. The 1996 coronary artery bypass risk model: the Society of Thoracic Surgeons Adult Cardiac National Database. Ann Thorac Surg. 1999;67:1205–8. doi: 10.1016/s0003-4975(99)00206-4. [DOI] [PubMed] [Google Scholar]
- 5.Kozower BD, Sheng S, O’Brien SM, et al. STS database risk models: predictors of mortality and major morbidity for lung cancer resection. Ann Thorac Surg. 2010;90:875–81. doi: 10.1016/j.athoracsur.2010.03.115. discussion 81–3. [DOI] [PubMed] [Google Scholar]
- 6.Novick RJ, Fox SA, Stitt LW, Forbes TL, Steiner S. Direct comparison of risk-adjusted and non-risk-adjusted CUSUM analyses of coronary artery bypass surgery outcomes. J Thorac Cardiovasc Surg. 2006;132:386–91. doi: 10.1016/j.jtcvs.2006.02.053. [DOI] [PubMed] [Google Scholar]
- 7.Grobman WAFJ, Murthy S. Are the Agency for Healthcare Research and Quality obstetric trauma indicators valid measures of hospital safety? American Journal of Obstetrics & Gynecology. 2006;195:868–74. doi: 10.1016/j.ajog.2006.06.020. [DOI] [PubMed] [Google Scholar]
- 8.Landy HJ, Laughon SK, Bailit JL, et al. Characteristics associated with severe perineal and cervical lacerations during vaginal delivery. Obstet Gynecol. 2011;117:627–35. doi: 10.1097/AOG.0b013e31820afaf2. [DOI] [PMC free article] [PubMed] [Google Scholar]
- 9.Ross-Adjie G, McAllister H, Bradshaw S. Graduated compression stockings for the prevention of postoperative venous thromboembolism in obstetric patients: a best practice implementation project. Int J Evid Based Healthc. 2012;10:77–81. doi: 10.1111/j.1744-1609.2011.00249.x. [DOI] [PubMed] [Google Scholar]
- 10.Dupont CD-TC, Touzet S, Colin C, Bouvier-Colle MH, Lansac J, Thevenet S, Boberie-Moyrand C, Piccin G, Fernandez MP, Rudigoz RC, Group P. Clinical audit: a useful tool for reducing severe postpartum haemorrhages? Int J Qual Health Care. 2011;23:583–9. doi: 10.1093/intqhc/mzr042. [DOI] [PMC free article] [PubMed] [Google Scholar]
- 11.Weed S, Bastek JA, Sammel MD, Beshara M, Hoffman S, Srinivas SK. Comparing postcesarean infectious complication rates using two different skin preparations. Obstet Gynecol. 2011;117:1123–9. doi: 10.1097/AOG.0b013e3182118e98. [DOI] [PubMed] [Google Scholar]
- 12.Tita AT, Landon MB, Spong CY, et al. Timing of elective repeat cesarean delivery at term and neonatal outcomes. New England Journal of Medicine. 2009;360:111–20. doi: 10.1056/NEJMoa0803267. [DOI] [PMC free article] [PubMed] [Google Scholar]
- 13.Kohavi R. A study of cross-validation and bootstrap for accuracy estimation and model selection. IJCAI’95 Proceedings of the 14th international joint conference on Artificial intelligence; San Francisco, CA: Morgan Kaufmann Publishers Inc; 1995. [Google Scholar]
- 14.Paul P, Pennell M, Lemeshow S. Standardizing the power of the Hosmer-Lemeshow goodness of fit test in large data sets. Stat Med. 2013;32:67–80. doi: 10.1002/sim.5525. [DOI] [PubMed] [Google Scholar]
- 15.Ash ASSM, Peköz EA. Comparing Outcomes Across Providers. In: Iezzoni L, editor. Risk adjustment for Measuring Health Care Outcomes. Chicago, IL: Health Administration Press; 2003. [Google Scholar]
- 16.Pronovost PJ, Berenholtz SM, Ngo K, et al. Developing and pilot testing quality indicators in the intensive care unit. Journal of Critical Care. 2003;18:145–55. doi: 10.1016/j.jcrc.2003.08.003. [DOI] [PubMed] [Google Scholar]
- 17.Shahian DM, O’Brien SM, Filardo G, et al. The Society of Thoracic Surgeons 2008 cardiac surgery risk models: part 3--valve plus coronary artery bypass grafting surgery. Ann Thorac Surg. 2009;88:S43–62. doi: 10.1016/j.athoracsur.2009.05.055. [DOI] [PubMed] [Google Scholar]
- 18.Lindenauer PK, Remus D, Roman S, et al. Public reporting and pay for performance in hospital quality improvement. N Engl J Med. 2007;356:486–96. doi: 10.1056/NEJMsa064964. [DOI] [PubMed] [Google Scholar]