

Abstract
Development of novel therapeutics requires good animal models of disease. Disorders for which good animal models do not exist have very few drugs in development or clinical trial. Even where there are accepted, albeit imperfect models, the leap from promising preclinical drug results to positive clinical trials commonly fails, including in disorders of skeletal muscle. The main alternative model for early drug development, tissue culture, lacks both the architecture and, usually, the metabolic fidelity of the normal tissue in vivo. Herein, we demonstrate the feasibility and validity of human to mouse xenografts as a preclinical model of myopathy. Human skeletal muscle biopsies transplanted into the anterior tibial compartment of the hindlimbs of NOD-Rag1null IL2rγnull immunodeficient host mice regenerate new vascularized and innervated myofibers from human myogenic precursor cells. The grafts exhibit contractile and calcium release behavior, characteristic of functional muscle tissue. The validity of the human graft as a model of facioscapulohumeral muscular dystrophy is demonstrated in disease biomarker studies, showing that gene expression profiles of xenografts mirror those of the fresh donor biopsies. These findings illustrate the value of a new experimental model of muscle disease, the human muscle xenograft in mice, as a feasible and valid preclinical tool to better investigate the pathogenesis of human genetic myopathies and to more accurately predict their response to novel therapeutics.
INTRODUCTION
Animal models of myopathy are an important feature of the development of novel therapies for humans. Of these, the mouse is certainly the most convenient and popular mammalian model. However, mouse models for many human diseases such as Duchenne muscular dystrophy (DMD) are frequently criticized for their limitations, especially the lack of translation from positive preclinical studies to positive clinical trial (1,2). As a notable example, the only drugs proven in randomized, placebo-controlled, clinical trials to benefit boys with DMD are glucocorticosteroids, which do not improve the condition of the murine mdx model in long-term studies (3–5). Despite this, preclinical efficacy testing in animal models remains a near obligatory requirement in industry and academia for neuromuscular diseases prior to clinical trials. For several complex and rare neuromuscular disorders, there is no accepted animal model, a lack that has stymied therapeutic development.
Facioscapulohumeral muscular dystrophy (FSHD) is one such complex neuromuscular disorder affecting ∼4–7 per 100 000 individuals (6). Weakness in the muscles of the face, scapular region and arms typically begins in late adolescence and early adulthood; however, there is a range of severity from infant to late adult onset, loosely correlating to genotype. The disorder is relentlessly progressive, eventually affecting most skeletal muscles and resulting in the lack of ability to smile, to raise arms overhead, and to lift. Approximately one-third of patients with FSHD lose the ability to ambulate.
The pathogenesis of FSHD has remained elusive. The disease is due to a loss of macrosatellite repeats on chromosome 4q (7,8). Within this region, there are 3.3 kb hypermethylated repetitive DNA segments termed D4Z4 repeats. Unaffected people can have >100 copies of D4Z4 units, while those with FSHD have 1–10 units (9). Although the genetics and pathophysiology are yet to be fully elucidated, the chromosome 4q deletion, when it occurs in the appropriate context, appears to lead to the misexpression of a transcription factor DUX4-fl, which in turn activates a number of other genes (10–12). Due to the complexity of this epigenetic disorder, there is no accepted animal model of FSHD that recapitulates the disease, and there are no current ongoing clinical trials in the disorder.
In cancer research, xenografts of human tumors in immunocompromised mice have been used successfully to predict their clinical response to therapeutic drugs (13,14). Previous attempts to use xenografts to model muscle disease by injecting dissociated human myoblasts into injured mouse muscle have produced low engraftment of human cells, mainly in a perifascicular position (15–18). However, grafts of whole muscle from the mdx mouse placed into normal mice retained the dystrophic phenotype of the donor mouse (19). This finding encouraged us to investigate whether human muscle could be similarly grafted into immunodeficient mice and recapitulate key features of normal and diseased human muscle for preclinical therapeutic studies.
RESULTS
Regeneration of human skeletal muscle in immunodeficient mice
Human volunteers donated biceps muscle specimens through a protocol approved by the Johns Hopkins Medicine Institutional Review Board. The donor muscle was trimmed and transplanted into the anterior compartment of the hindlimbs of immunodeficient NOD-Rag1nullIL2rγnull mice in place of the host tibialis anterior and extensor digitorum longus muscles and sutured to the proximal and distal tendons of the peroneus longus as described in Materials and Methods (see Supplementary Material, Fig. S1). Such grafts were spontaneously vascularized and survived through 41 weeks posttransplantation (Supplementary Material, Fig. S2; Fig. 1A). Myofibers of donor muscle degenerated and nascent fibers regenerated within the existing basal lamina of the donor specimen (Fig. 1B–E). Regenerated fibers showed the predominant peripheral relocation of nuclei characteristic of human but not murine muscle regeneration (20) (55 ± 3% central nucleated fibers at Day 14 versus 21 ± 3% central nucleated fibers at Day 140, mean ± SD, n = 3 for each, P < 0.001 by two-tailed t-test). Beyond 90 days posttransplantation, grafts were fully regenerated with predominantly peripheral nuclei and stable average cross-sectional areas (CSA) approximately one half that of myofibers in the donor biopsy from which they originated (1348 ± 966 versus 3382 ± 945 µm2, mean ± SD) (Fig. 1F).
Figure 1.

Human muscle regenerates in immunodeficient NOD-Rag1null IL2rγnull mice. (A) Human muscle graft at 130 days posttransplantation into mouse hindlimb. Black sutures indicate ends of graft. (B) Hematoxylin and eosin (H&E) stained cross-section of original donor biceps biopsy. (C) H&E stained cross-section of human graft at 14 days posttransplant. Large myofibers continue to degenerate (arrow) and clusters of small myofibers regenerate (arrowhead and box) within original myofiber basal lamina (insert, anti-human spectrin in red, anti-human collagen IV in green). (D) H&E stained cross-section of human graft at 60 days demonstrating increasing size of grouped myofibers. Asterisk indicates neighboring host mouse muscle. (E) H&E stained cross-section of host hindlimb with fully regenerated human graft at 130 days. Graft within dotted lines. Asterisk indicates mouse muscle. Scale bars: 200 µm. (F) Histograms of CSA of myofibers from xenograft at 130 days (left) and donor muscle (right), n = 1300–1400 fibers each.
Xenografts were composed entirely of myofibers uniformly expressing human membrane proteins such as spectrin (Fig. 2A). Multi-labeling immunohistochemistry (see Materials and Methods; Supplementary Materials, Fig. S3) was used to identify total human nuclei, human myonuclei and human myogenic precursor cells, satellite cells. Within the xenograft area as defined by positive anti-human spectrin reactivity, 91.4 ± 3.4% of all nuclei, 95.2 ± 3.2% of all myonuclei and 90.2 ± 4.0% of all satellite cells were human (mean ± SD) (Fig. 2B). Capillaries within the xenograft were both human and mouse in origin with some appearing to be anastomoses of human and mouse capillaries (Fig. 2C). Mouse erythrocytes within capillaries indicate patency of the human vasculature within the xenograft (Fig. 2D).
Figure 2.

Skeletal muscle xenografts have human myofibers, nuclei and capillary immunoreactivity. (A) Anti-human spectrin antibodies (red) define discrete boundaries (insert) of xenograft (serial section of 1E) from neighboring mouse muscle (asterisk) and uniformly recognize myofiber membrane. Scale bar: 200 µm. (B) Within anti-human spectrin defined xenograft, 91.4 ± 3.4% of all nuclei (DAPI+), 95.2 ± 3.2% of myonuclei and 90.2 ± 4.0% of Pax7+ satellite cells are human as recognized by anti-human lamin A/C, (n = 6). Data are shown as the mean ± SD. (C) Both human (green) and mouse (red) vascular networks were identified with species-specific CD31 antibodies, which appear to anastomose (insert). Scale bar: 200 µm. (D) Human capillaries (green) within the xenograft contain mouse erythroid cells identified with species-specific antibodies (red). Xenografts in these images are all 130 days posttransplantation. Scale bar: 50 µm.
Functional competency of skeletal muscle xenografts
Having established the xenograft as a feasible model of human muscle, containing predominantly human myofibers and nuclei, we sought evidence of functional competence. As described in Materials and Methods, the graft of human biopsy sample was sutured to the peroneus longus muscle overlying a branch of the peroneal nerve (freed after tibialis resection). Figure 3A and B reveals neuromuscular junctions in cryosections of xenografts indicating innervation of the xenograft. Furthermore, the presence of both type 1 and type 2 fibers (Fig. 3C) indicates re-innervation by more than one motor neuron.
Figure 3.
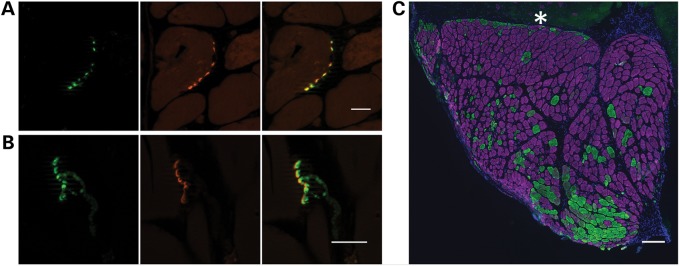
Xenografts are innervated. (A) Cross-section and (B) longitudinal section of 130-day xenografts demonstrate co-localization of presynaptic anti-SV2 reactivity (green) and postsynaptic α-bungarotoxin reactivity (red). Scale bars: 20 µm. (C) Immunohistochemistry demonstrates both type I (purple) and type II (green) myofibers in mature xenograft with a predominance of type I fibers. Asterisk indicates mouse muscle. Scale bar: 200 µm.
While the graft is innervated, in situ or in vivo assessment of xenograft function could not be technically differentiated from function of the host peroneus longus to which it was sutured. Graft-specific contractility was assessed in explanted xenografts in vitro with trains of action potentials delivered with increasing frequency (i.e. force-frequency response) (21–23). The xenograft exhibited a steep force-frequency response indicative of functionally competent muscle (Fig. 4A and B). Functional assessments were also made on intact, single myofibers enzymatically isolated from xenografts and verified as human in origin (Fig. 4C) (22,24). Myofibers were loaded with the Ca2+ indicator dye Indo-1-PE and stimulated to contract with electrical field pulses. The presence of robust responses to brief single pulses or tetanic trains of pulses (Fig. 4D and E) indicate a fully competent excitation–contraction coupling system in these fibers.
Figure 4.
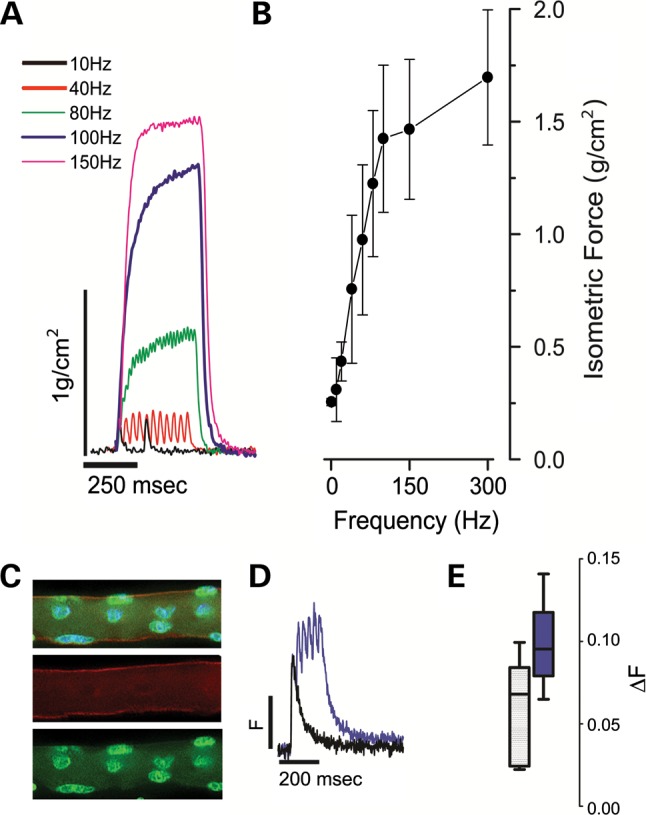
Xenografts are functionally competent. (A) Xenograft explants were suspended in a temperature-controlled, physiological saline contained bath and electrically evoked force measurements were recorded with 250 ms trains of pulses delivered between 1 and 300 Hz. Representative isometric force traces are shown normalized to the calculated CSA of the xenograft. (B) Force-frequency relationship of aggregate data from three xenografts derived from three healthy donors. (C) Single enzymatically isolated myofiber from xenograft identified post-physiology as human with immunohistochemistry using anti-human spectrin (red), anti-human lamin A/C (green) antibodies and DAPI (blue). (D) Single myofibers were loaded with the ratiometric calcium (Ca2+) dye Indo-1-PE and electrically stimulated to elicit calcium transients. Representative twitch (single square 0.2 µs square field pulses, black trace) or tetanic trains (100 Hz, purple trace) are shown from fibers isolated from xenograft explants (n = 3) of healthy donors. (E) Aggregate Ca2+ transient data (Box whisker plot; box = 5–95%; line = population median; whiskers = min/max).
A xenograft model of facioscapulohumeral muscular dystrophy
To test the suitability of the xenograft as a model for muscle disease, we grafted mildly weak muscle from subjects with FSHD into the anterior compartment of NOD-Rag1nullIL2rγnullhost mice. Biceps muscle was donated from families (cohort numbers 29, 30, 32, 33 and 37) with affected (indicated by letters, ‘A’, ‘B’ or ‘C’) and unaffected (indicated by letter ‘U’) members to serve as close genetic controls (25). Muscle from FSHD individuals, as well as unaffected family members, regenerated in immunodeficient mice (Fig. 5A). DUX4-fl expression, assayed by nested reverse transcription–polymerase chain reaction (RT–PCR), was detected in xenografts which originated from FSHD affected muscle donors but not in xenografts which originated from control unaffected donors (Fig. 5B).
Figure 5.

Validation of the model for FSHD. (A) H&E stained section (left) of FSHD xenograft next to host mouse peroneus (asterisk) at 140 days, human muscle fibers identified by anti-human spectrin (right, red). (B) DUX4-fl mRNA is specifically expressed in xenografts from FSHD muscle biopsies. Polyadenylated DUX4-fl mRNA expression was analyzed by RT–PCR in xenograft muscle originating from FSHD and control biopsy. Expression of DUX4-fl mRNA in the original muscle biopsy specimen was similarly assayed by RT–PCR, and DUX4-fl mRNA expression in the 29A muscle biopsy was confirmed previously (42). All RT–PCRs were repeated at least three times. All products were sequenced to confirm the presence of spliced DUX4-fl mRNA (arrow) in samples from FSHD xenografts (29A, 30B, 37A and 37B) and FSHD biopsy (30B, 37A and 37B). RT–PCR for GAPDH mRNA expression controlled for integrity of the mRNA and first strand cDNA synthesis. (C and D) Expression differences between FSHD and control biopsies are correlated with expression differences in the xenografts derived from these biopsies. In (C), log2(fold-changes) for FSHD versus control biopsies (horizontal axis) are plotted against the corresponding log2(fold-changes) for FSHD versus control xenografts (vertical axis) for the 25 genes assayed by qPCR. For both axes, positive values represent higher expression in FSHD samples than control samples. The log2(fold-changes) were fit using mixed-effect models on variance-stabilized normalized Ct values for 5 individuals (three FHSD, two control) from 2 families, and 22 xenografts derived from these individuals (see Materials and Methods). The log2(fold-changes) for lowly expressed genes may be compressed due to the variance stabilization, and log2(fold-changes) should be regarded with particular caution for genes represented by triangles (not detected in at least one xenograft) and squares (not detected in at least one xenograft and at least one biopsy). Dashed black line: perfect agreement; dashed red line: best fit using orthogonal regression. In (D), ΔCt values are shown for five genes: TRIM49, ZSCAN4, EXTL1, IDI2 and MYH8. Each column represents a biopsy subject, with 33U repeated to clarify its relation to both 33A and 33C. Meanings of colors and symbols are defined in figure. Upward sloping lines indicate higher expression (lower ΔCt) in the FSHD sample than the control. Solid and dashed lines between two subjects slope in the same direction when xenografts display the same direction of difference as the biopsies from which they were derived.
We next assessed whether the gene expression differences between FSHD and control biopsies were also present in FSHD versus control xenografts. Probably, because they had passed through a round of degeneration and regeneration, grafted muscles showed not-unexpectedly different baseline gene expression levels from human biopsies. However, the relative levels of expression of FSHD and control biopsies are concordant with those observed between FSHD and control xenografts derived from these biopsies. These comparisons were made between xenografts derived from five individuals from two families (see Materials and Methods). We measured expression levels for a panel of 25 genes in 22 xenograft samples, and the five human biopsies of origin with real-time quantitative PCR (qPCR). This panel consisted of: 15 genes identified as differentially expressed in a microarray study of FSHD versus control biopsies (26), eight genes (MBD3L5, PRAMEF1, PRAMEF6, SLC34A2, TRIM51 (SPRYD5), TRIM43, TRIM49, ZSCAN4) that are dramatically upregulated by ectopic overexpression of DUX4-fl in cell cultures (27), and PPIA and GUSB, which were used for normalization.
Expression differences in FSHD versus control xenografts were compared with the differences between the FSHD and control biopsies from which they had been derived; this was performed separately for three pairs of affected and unaffected individuals within a family (Supplementary Materials, Fig. S4). In each case, the log2(fold-changes) for FSHD versus control of the xenografts was strongly concordant with those of their biopsies of origin (Pearson correlation 0.63, 0.89, 0.66, respectively; P < 0.001 for each). For two of the three comparisons, there was a significant agreement in the direction of the changes (i.e. the sign of the log2(fold-changes); P = 0.07, P = 0.002, P = 0.0004, respectively, by Fisher's exact test). Most of the genes with discordant direction of change had log2(fold-changes) close to zero. The consistency of the relationship between biopsy and xenograft is epitomized by the finding that the strong upregulation of MYH8 reported in a larger FSHD collection (26) was not seen in either the biopsy or the corresponding xenografts of FSHD individuals 33A and 37B, but was seen for both the biopsy and xenografts of 33C (Fig. 5D; Supplementary Materials, Fig. S4).
Although the xenografts in the gene expression analysis were derived from a small population of biopsies (three FSHD and two control), it is encouraging that the differences in FSHD versus control samples from the pooled xenografts not only have good agreement with the differences between the pooled biopsies from which they were derived (Fig. 5C; Pearson correlation 0.87; P = 2e−8 for correlation test; P = 0.003 for agreement in direction of changes by Fisher's exact test) but also reflect the FSHD-related differences reported in larger populations of unrelated samples: upregulation of MYH8 (albeit mild, for the reasons discussed above) and downregulation of EXTL1, G0S2, GLT25D2, IDI2 and TECRL (26), and upregulation of the DUX4-induced genes MBD3L5, PRAMEF1, PRAMEF6, SLC34A2, TRIM51 (SPRYD5), TRIM43, TRIM49 and ZSCAN4 (27). Figure 5D highlights the genes with the strongest downregulation and upregulation in the pooled FSHD versus control biopsies (EXTL1 and TRIM49) and xenografts (IDI2 and ZSCAN4), excluding those genes that were not detected in all samples.
Autopsy skeletal muscle specimens as donors for xenografting
Recognizing that many laboratories will not have easy access to fresh muscle biopsy tissue, we evaluated whether autopsy material could be similarly used as donor muscle. Autopsy material from the biceps of an octogenarian with FSHD was transplanted into immunodeficient mice ∼48 h after death of the donor. This autopsy specimen, which was not ideal in either age of donor or time from death to transplantation, regenerated well in the NOD-Rag1null IL2rγnull host. Since satellite cells have been shown to survive for many days in postmortem muscle (28), this new model might be easily generated by other laboratories (Supplementary Materials, Fig. S5).
DISCUSSION
Our results establish the feasibility of grafting human muscle into immunocompromised mice, where it regenerates, becomes innervated and displays functional contractility. The grafted muscle retains human characteristics including the peripheral migration of centralized nuclei during regeneration. The xenograft may, therefore, provide a unique opportunity to study human muscle regeneration over time with a degree of access and invasive experimental scrutiny that is not available in human subjects. A limitation of the model in this regard is the requisite immunodeficiency of the host mice, in our study NOD-Rag1null IL2rγnull, which lack functional T cells, B cells and Natural Killer cells (29). More directly important to muscle regeneration than lymphocytes, however, are macrophages that in NOD-Rag1null IL2rγnull appear to be present, although reduced in number (29).
For muscular dystrophies without animal models or with suboptimal animal models—which is true to some extent for all of them—the human muscle xenograft will be a useful new preclinical tool. FSHD is a complex genetic disorder for which the relative lack of clinical trials is attributable in part to the absence of an accepted mouse model for preclinical testing. Each of the proposed animal models of FSHD has its own distinct strengths and weakness. One early mouse model transgenically overexpressed FRG1, which previous studies had shown was increased in expression in FSHD patient-derived muscle biopsies (30). Although the model exhibits skeletal muscle pathology, the failure of subsequent studies of muscle biopsies from FSHD individuals to replicate the misexpression of FRG1 (26,31) raises questions about the validity of this mouse. Conditional expression of DUX4 in zebrafish produces an intriguing constellation of eye, ear and muscle abnormalities reminiscent of FSHD (32); however, a conditional model of DUX4 expression in mice is not yet available in that constitutive expression of DUX4 is toxic to cells (33,34). More recently, a mouse model has been developed carrying the FSHD permissive subtelomeric region and demonstrating DUX4 transcripts in multiple tissues including skeletal muscle (35). This will be a useful model to study de-repression of DUX4, but as the lack of muscle pathology in this model suggests, it may not be as helpful in studying pathogenesis downstream from DUX4, which necessarily depends on mouse genes. The xenograft model described in this paper also has limitations; namely, an inability to assess whole animal function such as grip strength or treadmill endurance. Since the xenograft expresses genes mirroring the human muscle from which it originated, we anticipate that it will be especially useful for studies with molecular outcomes (such as gene replacement or silencing studies).
In general, for detailed cell and molecular biology investigation of human muscle, investigators have resorted heavily to tissue culture for short-term ex vivo maintenance of human muscle. However, even superficial assessment tells us that this is remote in many ways from functional muscle in vivo. At the molecular level, too, tissue culture can be deceptive. For example, exon skipping studies in the dystrophic GRMD dog and the mdx mouse reveal that data from tissue cultures do not provide a reliable guide to in vivo behavior (36,37). The graft procedure we have described here should not only be applicable to genetic diseases of muscle for which we lack suitable animal models but should also hold promise for gaining a more detailed understanding of a number of acquired muscle conditions. The vigor of regeneration of our autopsy graft from an octogenarian donor opens new avenues into the study of the effects of age and disease on the innate regenerative and growth capacity of human skeletal muscle.
MATERIALS AND METHODS
Human muscle acquisition
This study was approved by The Johns Hopkins School of Medicine Institutional Review Board. Subjects with FSHD and their first degree unaffected relatives were recruited and screened for biomaterial contributions. Subjects had their FSHD genetic status confirmed by the University of Iowa Diagnostic Laboratories by pulse-field gel electrophoresis and Southern blotting as previously described (25). Subjects were categorized as ‘affected’ (and labeled ‘A’, ‘B’ or ‘C’) if they had contraction of the D4Z4 array (fewer than 11 repetitive units) associated with the 4qA allele and ‘unaffected’ (and labeled ‘U’) if they had no contraction. Open muscle biopsy was performed on biceps muscles having strength ≥4 of 5 (MRC scale). A portion of the harvested tissue was dissected into several small strips of longitudinal fibers ∼1 cm long and taken immediately to the animal suite for xenografting.
Surgical procedure
The Institutional Animal Care and Use Committee at the Johns Hopkins University School of Medicine approved the animal and surgical procedures performed in this study. Female NOD-Rag1null IL2rgnull immunodeficient mice (Stock 007799, The Jackson Laboratory) were used for this study. Donor human muscle was trimmed to 8 × 3 × 1 mm strips. Host mice were anaesthetized with isofluorane. The tibialis anterior and extensor digitorum longus were removed from the anterior tibial compartment. The neurovascular bundle was severed leaving maximal length. A strip of human muscle was placed in the empty anterior compartment and ligated with non-absorbable suture (6/0 POLYPRO, CP medical) to the tendons of the peroneus longus. Skin was closed with surgical glue (Histoacryl, B. Braun) and stainless steel wound clips (Reflex Wound Clips, CellPoint Scientific). Rimadyl 5 mg/kg was given subcutaneously after the surgery for pain control.
Immunohistochemistry and morphometric analysis
Mice were sacrificed at a variety of time points up to 41 weeks posttransplantation. The graft was harvested with the entire mouse lower limb, frozen and serially sectioned as previously described (38). Ten micron cryosections were stained with H&E or processed for immunohistochemistry. Ice-cold methanol fixed sections were blocked with anti-mouse IgG (MKB-2213, Vector Laboratories). The primary antibodies used were anti-human spectrin (NCL-SPEC1, Leica, 1:50), anti-human collagen IV (M3F7, Developmental Studies Hybridoma Bank (DSHB), 1:50), anti-human lamin A/C (Ab40567, AbCam, 1:200), anti-synaptic vesicle 2 (SV2, DSHB, 1:50), anti-type I myosin heavy chain (A4.840, DSHB, 1:50), anti-type II myosin heavy chain (A4.74, DSHB, 1:50), anti-human CD31 (M0823, DAKO, 1:20), anti-mouse CD31 (550274, BD, 1:50), anti-mouse TER-119 (550565, BD Biosciences, 1:50), anti-human laminin (2E8, DSHB, 1:100) and anti-Pax7 (PAX7, DSHB, 1:10). The secondary antibodies used were AlexaFluor 488 goat anti-mouse IgG1, AlexaFluor 594 goat anti-mouse IgG2b, AlexaFluor 647 goat anti-mouse IgM and AlexaFluor 594 goat anti-rat IgG (all Invitrogen, 1:500). Tetramethylrhodamine α-Bungarotoxin (T-1175, Invitrogen, 1:50) was used for detecting postsynaptic membranes. All nuclei were labeled with DAPI in mounting medium (P36930, Invitrogen). Image capture was performed using an upright microscope for bright field, DIC and epifluorescence with apotome structured illumination digital imaging system (Zeiss). The image stacks consisted of six optical sections with 1.4 μm Z-steps. Nuclei staining positive for DAPI but outside anti-human laminin were considered interstitial cells while those inside laminin were considered myonuclei. Satellite cells were identified by Pax7+ staining within anti-human laminin staining. Muscle fiber CSA were determined by using Scio Image Software (NIH) on anti-human spectrin stained sections as previously described (39). Central nucleated fibers were counted in anti-human spectrin and lamin A/C-positive regions as previously described (40).
In vitro functional assessment
Grafts were carefully dissected away from the mouse peroneus longus muscle belly and affixed at the suture sites. Following equilibration, the force versus frequency relationship was evaluated as previously described (21). Peak isometric tension was normalized to the calculated CSA using the length (mm) and mass (mg) of the muscle between the sutures.
Single intact myofibers were enzymatically isolated from the xenograft using Collagenase A (Roche) in DMEM and adhered to glass-bottom imaging dishes as described previously (21,24,41). Myofibers were loaded with the dual emission, ratiometric, fluorescent Ca2+ indicator, Indo-1-PE AM (5 μm in 20% pluronic/DMSO), for 45 min in a normal rodent Ringer (in mm: 140 NaCl, 4 KCl, 1.8 CaCl, 1 MgSO4, 5 NaHCO3, 10 HEPES, 5 glucose, pH 7.4). Dishes were washed and incubated for 30 min in Ringer to allow Indo-1 deesterification. Myofibers were imaged on an IonOptix dual PMT imaging platform mounted to an IX-70 inverted fluorescence microscope (×40 water UV objective) equipped with a Sutter DG-4 excitation source (excitation: 340 ± 10 nm). The Indo-1-PE emission ratio (emission: 405/485 nm, sampled at 1 kHz) was taken as the estimate of myoplasmic Ca2+ concentration ([Ca2+]). The Indo-1 ratio was assessed in quiescent myofibers to determine the resting myoplasmic [Ca2+]. Action potential induced fluorescent transients were elicited with brief (200 µs, square pulse) trains of pulses delivered at 10 or 100 Hz.
FSHD xenograft DUX4-fl expression
Total RNA was isolated from frozen muscle biopsy samples and xenografts using Trizol (Invitrogen) and RNeasy mini kit (Qiagen). DUX4-fl expression was determined using 100 ng of poly(A)+ cDNA by a nested RT–PCR as described previously (42). PCR products were sequenced and specificity of reaction products was confirmed.
Gene expression analysis
High-throughput real-time qPCR was performed on the BioMark 96.96 Dynamic Array (Fluidigm) with TaqMan Gene Expression Assays (Applied Biosystems), as previously described (26). Gene expression analyses were done on xenografts derived from five individuals from two families: FSHD subjects 33A, 33C and control subject 33U from family 33 (previously reported (26)), and FSHD subject 37B and control subject 37U from family 37. There were six xenograft samples derived from the biceps of 33C, and four xenograft samples derived from the biceps of each of the other four individuals.
We tested whether the TaqMan primers for the 25 assayed human genes (assay IDs listed in Supplementary Material, Table S1) were specific to human as opposed to mouse mRNA by including two samples of tibialis anterior muscle from non-xenograft mice (TA1 and TA2). CAB39L and OXCT1 were detected in these samples, with raw Cts (threshold cycles) 18 and 32, respectively, but the other 23 genes were not. The raw Cts for the xenograft mice averaged 15 for CAB39L and 17 for OXCT1. As the value for OXCT1 in xenografts is 15Ct lower (suggesting 215 ≈ 30 000 times greater signal) than in the non-xenograft mice, the signal for it in xenografts should be largely from human mRNA. For CAB39L, the difference is ∼3Ct, so mouse mRNA levels may potentially partially mask differences in human mRNA levels in the xenografts.
Statistical analysis
The raw Ct value for each gene for each sample was computed as the median value of the Cts from three technical qPCR replicates. These values are given in Supplementary Material, Table S2. Sample names are in the top row: names with prefix ‘biop’ are biopsies (biceps) from the indicated subject, those with prefix ‘xg’ are xenografts derived from the indicated subject (with mouse index number and L/R leg as a suffix), and TA1 and TA2 are the non-xenograft mouse controls. ND indicates that the gene was not detected in the sample.
To account for differences in quantities of input RNA for each sample, and in the case of xenografts for differences in relative abundances of human versus mouse RNA, raw Cts were normalized to ΔCt values by subtracting the mean Ct of PPIA and GUSB, which were previously identified as stable internal control genes (26).
Estimates of log2(fold-changes) for FSHD/control comparisons would typically be computed as the mean ΔCt for control samples minus the mean ΔCt for FSHD samples, but because many of the DUX4-induced genes are near the qPCR detection threshold (where the variance increases sharply and genes may not be detected in some samples) we first performed a variance-stabilizing transformation (vst) on the ΔCt values. Modeling the standard deviation as independent of the mean for ΔCt < 5 (corresponding roughly to raw Ct < 20) then increasing linearly by 25% of the baseline standard deviation per additional Ct, by the delta method the asymptotic vst is given by  , so vst(x) = x for x≤ 5 and vst(x) = 5 + 4(ln(x− 1)− ln(4)) for x > 5. To avoid infinite fold-changes, non-detected genes were assigned the value ΔCt = 25 (∼1Ct higher than the highest value for any detected gene in any sample) prior to applying the vst; these genes are indicated by special symbols in Figure 5 and Supplementary Material, Figure S3. The tests for significant differences between FSHD and control xenografts for individual genes used non-parametric Wilcoxon rank-sum tests, so were not affected by the monotonic vst or by the precise choice of value assigned to the non-detected genes, which are regarded as tied for having the highest Ct value. These tests used the function wilcox.exact in the R package exactRankTests, which allows for tied observations.
For the simple pairwise comparisons (33A versus 33U, 33C versus 33U, 37B versus 37U), log2(fold-changes) were computed from mean values of variance-stabilized ΔCt values. For the pooled comparisons of all FSHD versus all control, as there were differences in the number of individuals per family (three from family 33 and two from family 37) and the number of xenograft mice per individual (six for 33C; four for the others), we used mixed-effect models to compute the log2(fold-changes) from the variance-stabilized ΔCt values. For humans, this model had a fixed effect for Class (FSHD versus control) and a random effect for Family (model specification vst.values ∼ Class + (1 | Family) in R package lme4). For xenografts, the model also includes blocking factors for replicate mice derived from the same individual (model specification vst.values ∼ Class + (1 | Family) + (1 + Class | Individual)).
Tests for agreement in direction of expression changes used Fisher's exact test (fisher.test in R, one tailed) on the 2 × 2 contingency tables of gene counts, with the sign of the log2(fold-change) in xenografts in one margin and the sign of the log2(fold-changes) in biopsies in the other margin. Genes were excluded if their log2(fold-change) was exactly zero in either margin, which happened only for genes that were detected in neither the FSHD nor the control samples.
SUPPLEMENTARY MATERIAL
AUTHORS’ CONTRIBUTIONS
T.A.P. and K.R.W. jointly conceived the model. All authors conducted or supervised the experiments. Y.Z, O.D.K., T.A.P. and K.R.W. wrote the manuscript. All authors discussed the results and commented on the manuscript.
FUNDING
This work was supported by the National Institutes of Health (NIH) (1R21NS079529 to K.R.W., U54HD060848 to C.P.E.) and the Muscular Dystrophy Association (216652 to C.P.E., 202863 to F.R.). This work was also made possible by the National Center for Research Resources (NCRR) a component of the NIH, and NIH Roadmap for Medical Research (UL1 RR 025005). Its contents are solely the responsibility of the authors and do not necessarily represent the official view of NCRR or NIH.
Supplementary Material
ACKNOWLEDGEMENTS
The authors acknowledge Doris Leung, Genila Bibat, Daniel Perez and the FSH Society, Inc. for assistance with patient recruitment and biopsy procurement.
Conflict of Interest statement. None declared.
REFERENCES
- 1.Duan D. Duchenne muscular dystrophy gene therapy: lost in translation? Res. Rep. Biol. 2011;2011:31–42. doi: 10.2147/RRB.S13463. [DOI] [PMC free article] [PubMed] [Google Scholar]
- 2.Partridge T.A. The mdx mouse model as a surrogate for Duchenne muscular dystrophy. FEBS J. 2013;280:4177–4186. doi: 10.1111/febs.12267. [DOI] [PMC free article] [PubMed] [Google Scholar]
- 3.Griggs R.C., Moxley R.T., III, Mendell J.R., Fenichel G.M., Brooke M.H., Pestronk A., Miller J.P. Prednisone in Duchenne dystrophy: a randomized, controlled trial defining the time course and dose response. Clinical Investigation of Duchenne Dystrophy Group. Arch. Neurol. 1991;48:383–388. doi: 10.1001/archneur.1991.00530160047012. [DOI] [PubMed] [Google Scholar]
- 4.Mendell J.R., Moxley R.T., Griggs R.C., Brooke M.H., Fenichel G.M., Miller J.P., King W., Signore L., Pandya S., Florence J., et al. Randomized, double-blind six-month trial of prednisone in Duchenne's muscular dystrophy. New Engl. J. Med. 1989;320:1592–1597. doi: 10.1056/NEJM198906153202405. [DOI] [PubMed] [Google Scholar]
- 5.Sali A., Guerron A.D., Gordish-Dressman H., Spurney C.F., Iantorno M., Hoffman E.P., Nagaraju K. Glucocorticoid-treated mice are an inappropriate positive control for long-term preclinical studies in the mdx mouse. PLoS ONE. 2012;7:e34204. doi: 10.1371/journal.pone.0034204. [DOI] [PMC free article] [PubMed] [Google Scholar]
- 6.Orphanet: an online database of rare disease and orphan drugs. 2013. http://www.orpha.net/ Accessed 21 October 2013.
- 7.van Deutekom J.C., Wijmenga C., van Tienhoven E.A., Gruter A.M., Hewitt J.E., Padberg G.W., van Ommen G.J., Hofker M.H., Frants R.R. FSHD associated DNA rearrangements are due to deletions of integral copies of a 3.2 kb tandemly repeated unit. Hum. Mol. Genet. 1993;2:2037–2042. doi: 10.1093/hmg/2.12.2037. [DOI] [PubMed] [Google Scholar]
- 8.Wijmenga C., Hewitt J., Sandkuijl L.A., Clark L.N., Wright T.J., Dauwerse H.G., Gruter A.M., Hofker M.H., Moerer P., Williamson R., et al. Chromosome 4q DNA rearrangements associated with facioscpulohumeral muscular dystrophy. Nat. Genet. 1992;2:26–30. doi: 10.1038/ng0992-26. [DOI] [PubMed] [Google Scholar]
- 9.Statland J.M., Tawil R. Facioscapulohumeral muscular dystrophy: molecular pathological advances and future directions. Curr. Opin. Neurol. 2011;24:423–428. doi: 10.1097/WCO.0b013e32834959af. [DOI] [PubMed] [Google Scholar]
- 10.Lemmers R.J., Wohlgemuth M., van der Gaag K.J., van der Vliet P.J., van Teijlingen C.M., de Knijff P., Padberg G.W., Frants R.R., van der Maarel S.M. Specific sequence variations within the 4q35 region are associated with facioscapulohumeral muscular dystrophy. Am. J. Hum. Genet. 2007;81:884–894. doi: 10.1086/521986. [DOI] [PMC free article] [PubMed] [Google Scholar]
- 11.Lemmers R.J., van der Vliet P.J., Klooster R., Sacconi S., Camaño P., Dauwerse J.G., Snider L., Straasheijm K.R., van Ommen G.J., Padberg G.W., et al. A unifying genetic model for facioscapulohumeral muscular dystrophy. Science. 2010;329:1650–1653. doi: 10.1126/science.1189044. [DOI] [PMC free article] [PubMed] [Google Scholar]
- 12.Snider L., Geng L.N., Lemmers R.J., Kyba M., Ware C.B., Nelson A.M., Tawil R., Filippova G.N., van der Maarel S.M., Tapscott S.J., et al. Facioscapulohumeral dystrophy: incomplete suppression of a retrotransposed gene. PLoS Genet. 2010;6:e1001181. doi: 10.1371/journal.pgen.1001181. [DOI] [PMC free article] [PubMed] [Google Scholar]
- 13.Adams J. Development of the proteasome inhibitor PS-341. Oncologist. 2002;7:9–16. doi: 10.1634/theoncologist.7-1-9. [DOI] [PubMed] [Google Scholar]
- 14.Pegram M., Ngo D. Application and potential limitations of animal models utilized in the development of trastuzumab (Herceptin®): a case study. Adv. Drug Deliv. Rev. 2006;58:723–734. doi: 10.1016/j.addr.2006.05.003. [DOI] [PubMed] [Google Scholar]
- 15.Benchaouir R., Meregalli M., Farini A., D'Antona G., Belicchi M., Goyenvalle A., Battistelli M., Bresolin N., Bottinelli R., Garcia L., et al. Restoration of human dystrophin following transplantation of exon-skipping-engineered DMD patient stem cells into dystrophic mice. Cell Stem Cell. 2007;1:646–657. doi: 10.1016/j.stem.2007.09.016. [DOI] [PubMed] [Google Scholar]
- 16.Cooper R.N., Irintchev A., Di Santo J.P., Zweyer M., Morgan J.E., Partridge T.A., Butler-Browne G.S., Mouly V., Wernig A. A new immunodeficient mouse model for human myoblast transplantation. Hum. Gene Ther. 2001;12:823–831. doi: 10.1089/104303401750148784. [DOI] [PubMed] [Google Scholar]
- 17.Meng J., Adkin C.F., Xu S.W., Muntoni F., Morgan J.E. Contribution of human muscle-derived cells to skeletal muscle regeneration in dystrophic host mice. PLoS ONE. 2011;6:e17454. doi: 10.1371/journal.pone.0017454. [DOI] [PMC free article] [PubMed] [Google Scholar]
- 18.Riederer I., Negroni E., Bencze M., Wolff A., Aamiri A., Di Santo J.P., Silva-Barbosa S.D., Bulter-Browne G., Savino W., Mouly V. Slowing down differentiation of engrafted human myoblasts into immunodeficient mice correlates with increased proliferation and migration. Mol. Ther. 2012;20:146–154. doi: 10.1038/mt.2011.193. [DOI] [PMC free article] [PubMed] [Google Scholar]
- 19.Morgan J.E., Coulton G.R., Partridge T.A. Mdx muscle grafts retain the mdx phenotype in normal hosts. Muscle Nerve. 1989;12:401–409. doi: 10.1002/mus.880120511. [DOI] [PubMed] [Google Scholar]
- 20.McGeachie J.K. Sustained cell proliferation in denervated skeletal muscle of mice. Cell Tissue Res. 1989;257:455–457. doi: 10.1007/BF00261848. [DOI] [PubMed] [Google Scholar]
- 21.Dorsey S.G., Lovering R.M., Renn C.L., Leitch C.C., Liu X., Tallon L.J., Sadzewicz L.D., Pratap A., Ott S., Sengamalay N., et al. Genetic deletion of trkB.T1 increases neuromuscular function. Am. J. Physiol. Cell. Physiol. 2012;302:C141–C153. doi: 10.1152/ajpcell.00469.2010. [DOI] [PMC free article] [PubMed] [Google Scholar]
- 22.Khairallah R.J., Shi G., Sbrana F., Prosser B.L., Borroto C., Mazaitis M.J., Hoffman E.P., Mahurkar A., Sachs F., Sun Y., et al. Microtubules underlie dysfunction in Duchenne muscular dystrophy. Sci. Signal. 2012;5:ra56. doi: 10.1126/scisignal.2002829. [DOI] [PMC free article] [PubMed] [Google Scholar]
- 23.Olojo R.O., Ziman A.P., Hernandez-Ochoa E.O., Allen P.D., Schneider M.F., Ward C.W. Mice null for calsequestrin 1 exhibit deficits in functional performance and sarcoplasmic reticulum calcium handling. PLoS ONE. 2011;6:e27036. doi: 10.1371/journal.pone.0027036. [DOI] [PMC free article] [PubMed] [Google Scholar]
- 24.Lovering R.M., Michaelson L., Ward C.W. Malformed mdx myofibers have normal cytoskeletal architecture yet altered EC coupling and stress-induced Ca2+ signaling. Am. J. Physiol. Cell. Physiol. 2009;297:C571–C580. doi: 10.1152/ajpcell.00087.2009. [DOI] [PMC free article] [PubMed] [Google Scholar]
- 25.Homma S., Chen J.C.J., Rahimov F., Beermann M.L., Hanger K., Bibat G.M., Wagner K.R., Kunkel L.M., Emerson C.P., Jr, Miller J.B. A unique library of myogenic cells from facioscapulohumeral muscular dystrophy subjects and unaffected relatives: family, disease and cell function. Eur. J. Hum. Genet. 2012;20:404–410. doi: 10.1038/ejhg.2011.213. [DOI] [PMC free article] [PubMed] [Google Scholar]
- 26.Rahimov F., King O.D., Leung D.G., Bibat G.M., Emerson C.P., Kunkel L.M., Wagner K.R. Transcriptional profiling in facioscapulohumeral muscular dystrophy to identify candidate biomarkers. Proc. Natl. Acad. Sci. USA. 2012;109:16234–16239. doi: 10.1073/pnas.1209508109. [DOI] [PMC free article] [PubMed] [Google Scholar]
- 27.Geng L.N., Yao Z., Snider L., Fong A.P., Cech J.N., Young J.M., van der Maarel S.M., Ruzzo W.L., Gentleman R.C., Tawil R., et al. DUX4 activates germline genes, retroelements, and immune mediators: implications for facioscapulohumeral dystrophy. Dev. Cell. 2012;22:38–51. doi: 10.1016/j.devcel.2011.11.013. [DOI] [PMC free article] [PubMed] [Google Scholar]
- 28.Latil M., Rocheteau P., Chatre L., Sanuli S., Memet S., Ricchetti M., Tajbkhsh S., Chretien F. Skeletal muscle stem cells adopt a dormant cell state post mortem and retain regenerative capacity. Nat. Commun. 2012;12:903. doi: 10.1038/ncomms1890. [DOI] [PubMed] [Google Scholar]
- 29.Pearson T., Shultz L.D., Miller D., King M., Laning J., Fodor W., Cuthbert A., Burzenski L., Gott B., Lyons B., et al. Non-obese diabetic-recombination activating gene-1 (NOD-Rag 1 null) interleukin (IL)-2 receptor common gamma chain (IL2 rg null) null mice: a radioresistant model for human lymphohaematopoietic engraftment. Clin. Exp. Immunol. 2008;154:270–284. doi: 10.1111/j.1365-2249.2008.03753.x. [DOI] [PMC free article] [PubMed] [Google Scholar]
- 30.Gabellini D., D'Antona G., Moggio M., Prelle A., Zecca C., Adami R., Angeletti B., Ciscato P., Pellegrino M.A., Bottinelli R., et al. Facioscapulohumeral muscular dystrophy in mice overexpressing FRG1. Nature. 2006;439:973–977. doi: 10.1038/nature04422. [DOI] [PubMed] [Google Scholar]
- 31.Osborne R.J., Welle S., Venance S.L., Thornton C.A., Tawil R. Expression profile of FSHD supports a link between retinal vasculopathy and muscular dystrophy. Neurology. 2007;68:569–577. doi: 10.1212/01.wnl.0000251269.31442.d9. [DOI] [PubMed] [Google Scholar]
- 32.Mitsuhashi H., Mitsuhashi S., Lynn-Jones T., Kawahara G., Kunkel L.M. Expression of DUX4 in zebrafish development recapitulates facioscapulohumeral muscular dystrophy. Hum. Mol. Genet. 2013;22:568–577. doi: 10.1093/hmg/dds467. [DOI] [PMC free article] [PubMed] [Google Scholar]
- 33.Bosnakovski D., Daughters R.S., Xu Z., Slack J.M., Kyba M. Biphasic myopathic phenotype of mouse DUX, an ORF within conserved FSHD-related repeats. PLoS ONE. 2009;4:e7003. doi: 10.1371/journal.pone.0007003. [DOI] [PMC free article] [PubMed] [Google Scholar]
- 34.Wallace L.M., Garwick S.E., Mei W., Belayew A., Coppee F., Ladner K.J., Guttridge D., Yang J., Harper S.Q. DUX4, a candidate gene for facioscapulohumeral muscular dystrophy, causes p53-dependent myopathy in vivo. Ann. Neurol. 2011;69:540–552. doi: 10.1002/ana.22275. [DOI] [PMC free article] [PubMed] [Google Scholar]
- 35.Krom Y.D., Thijssen P.E., Young J.M., den Hamer B., Balog J., Yao Z., Maves L., Snider L., Knopp P., Zammit P.S., et al. Intrinsic epigenetic regulation of the D4Z4 macrosatellite repeat in a transgenic mouse model for FSHD. PLoS Genet. 2013;9:e1003415. doi: 10.1371/journal.pgen.1003415. [DOI] [PMC free article] [PubMed] [Google Scholar]
- 36.Yokota T., Lu Q.L., Partridge T., Kobayashi M., Nakamura A., Takeda S., Hoffman E. Efficacy of systemic morpholino exon-skipping in Duchenne dystrophy dogs. Ann. Neurol. 2009;65:667–676. doi: 10.1002/ana.21627. [DOI] [PMC free article] [PubMed] [Google Scholar]
- 37.Aoki Y., Yokota T., Nagata T., Nakamura A., Tanihata J., Saito T., Duguez S.M., Nagaraju K., Hoffman E.P., Partridge T., et al. Bodywide skipping of exons 45-55 in dystrophic mdx52 mice by systemic antisense delivery. Proc. Natl. Acad. Sci. USA. 2012;109:13763–13768. doi: 10.1073/pnas.1204638109. [DOI] [PMC free article] [PubMed] [Google Scholar]
- 38.Morrison B.M., Lachey J.L., Warsing L.C., Ting B.L., Pullen A.E., Underwood K.W., Kumar R., Sako D., Grinberg A., Wong V., et al. A soluble activin type IIB receptor improves function in a mouse model of amyotrophic lateral sclerosis. Exp. Neurol. 2009;217:258–268. doi: 10.1016/j.expneurol.2009.02.017. [DOI] [PubMed] [Google Scholar]
- 39.Li Z.B., Zhang J.Y., Wagner K.R. Inhibition of myostatin reverses muscle fibrosis through apoptosis. J. Cell Sci. 2012;125:3957–3965. doi: 10.1242/jcs.090365. [DOI] [PubMed] [Google Scholar]
- 40.Miciak J.J., Warsing L.C., Tibbs M.E., Jasper J.R., Jampel S.B., Malik F.I., Tankersley C., Wagner K.R. Fast skeletal muscle troponin activator in the dy2J muscular dystrophy model. Muscle Nerve. 2013;48:279–285. doi: 10.1002/mus.23848. [DOI] [PubMed] [Google Scholar]
- 41.Goodall M.H., Ward C.W., Pratt S.J.P., Bloch R.J., Lovering R.M. Structural and functional evaluation of branched myofibers lacking intermediate filaments. Am. J. Cell. Physiol. 2012;303:C224–C232. doi: 10.1152/ajpcell.00136.2012. [DOI] [PMC free article] [PubMed] [Google Scholar]
- 42.Jones T.I., Chen J.C.J., Rahimov F., Homma S., Arashiro P., Beermann M.L., King O.D., Miller J.B., Kunkel L.M., Emerson C.P., et al. Facioscapulohumeral muscular dystrophy family studies of DUX4 expression: evidence for disease modifiers and a quantitative model of pathogenesis. Hum. Mol. Genet. 2012;21:4419–4430. doi: 10.1093/hmg/dds284. [DOI] [PMC free article] [PubMed] [Google Scholar]
Associated Data
This section collects any data citations, data availability statements, or supplementary materials included in this article.