

Abstract
Age at menopause marks the end of a woman's reproductive life and its timing associates with risks for cancer, cardiovascular and bone disorders. GWAS and candidate gene studies conducted in women of European ancestry have identified 27 loci associated with age at menopause. The relevance of these loci to women of African ancestry has not been previously studied. We therefore sought to uncover additional menopause loci and investigate the relevance of European menopause loci by performing a GWAS meta-analysis in 6510 women with African ancestry derived from 11 studies across the USA. We did not identify any additional loci significantly associated with age at menopause in African Americans. We replicated the associations between six loci and age at menopause (P-value < 0.05): AMHR2, RHBLD2, PRIM1, HK3/UMC1, BRSK1/TMEM150B and MCM8. In addition, associations of 14 loci are directionally consistent with previous reports. We provide evidence that genetic variants influencing reproductive traits identified in European populations are also important in women of African ancestry residing in USA.
INTRODUCTION
Menopause marks the end of a woman's reproductive life. It can occur naturally or be induced. Clinically, natural menopause is defined as the irreversible cessation of menses for 12 months with no obvious cause, such as pregnancy or lactation (1–3). Surgical menopause occurs when both ovaries are removed or damaged by radiation or chemotherapeutic drugs used in cancer treatments (3). Age at natural menopause occurs at ∼50–55 years of age in Caucasian women (1–3). Studies have shown that the timing of menopause is a risk factor for osteoporosis, coronary heart disease and cancers. For example, early menopause is associated with increased mortality from cardiovascular diseases (4–8). It has been estimated that for every year's delay in menopause, the risk for cardiovascular disease is decreased by 2% (9). Women who suffer from premature menopause, defined as menopause prior to age 40, have a 50% higher mortality rate than those reporting menopause above age 50 years (4,10,11). To better assist women in their reproductive decisions and their overall health, it is important to determine factors influencing the timing of menopause.
Age at natural menopause is a strongly heritable trait, with more than half of the variation attributed to genetic factors (10,12). Women were at an increased risk of early or late menopause if their mother or non-twin sister had an early or late menopause (13). The odds ratio of a woman having an early menopause if their mother had experienced one was 6.02 (1). Estimates for heritability from mother–daughter and non-twin sister studies range from 42 to 85% (13,14). Environmental factors, such as current cigarette smoking, social-economic status and alcohol consumption, also associate with the onset of menopause but to a lesser extent (2,3,15,16).
Recent genome-wide association studies (GWAS) in 38 968 women of European ancestry identified numerous single nucleotide polymorphisms (SNPs) associated with age at menopause. These SNPs clustered ∼21 loci: RHBDL2, EXO1, FNDC4, TLK1, METAP1D, HELQ, RNF44, UIMC1/HK3, SYCP2L, chr13q34, BAT2, ASH2L, FSHB/MPPED2, PRIM1, KPNA3, TDRD3, POLG, GSPT1, BRSK1/TMEM150B, NLRP11 and MCM8 (17–19). SNPs in most of these clusters have also been shown to be associated with early menopause (20,21). Mutations in genes NOBOX, GDF9, BMP15 and FOXL2 have also been associated with premature ovarian insufficiency in several candidate gene studies (22–26). Most of these genes are implicated in DNA repair and immune pathways and suggest that ovarian aging is an early indicator of overall aging (19). Candidate gene studies in European women have also identified six additional loci associated with age at menopause: F5, CYP1B1, ESR1, AMHR2, HSDB1 and APOE (27–33).
Epidemiological studies have shown that age at natural menopause varies across ethnic groups. African and African-American women were reported to experience menopause at least 6–12 months sooner when compared with women of European descent (34–37). To date, however, the majority of the genetic studies on age at menopause have involved only women of European ancestry. Genetics studies in various ethnic groups are especially important in elucidating and distilling the genes controlling the timing of this universal reproductive event. To extend our understanding of genetic variants influencing menopause in African-American women, the Women's Health Initiative (WHI), the Candidate-gene Association Resource (CARe) Consortium, the African American Breast Cancer Consortium (AABC), the Genetic Epidemiology Network of Arteriopathy Study (GENOA), the Health Aging and Body Composition Study (Health ABC), the Healthy Aging in Neighborhoods of Diversity across the Life Span study (HANDLS) and the Multi-Ethnic Study of Atherosclerosis (MESA) Family Study collaborated in this first genome-wide association meta-analysis of GWAS on age at menopause in African-American women. We sought to identify novel loci influencing the age at menopause in African-American women, to replicate loci identified in European ancestry populations in African-American women and to examine the implicated regions for secondary signals.
RESULTS
Definition of age at natural menopause
Age at natural menopause was defined as the irreversible cessation of menses for at least 12 months in women who did not undergo hysterectomy with or without oophorectomy (1,2). Women with premature menopause, defined as having menopause prior to 40 years of age, and women who reported menopause after 60 years of age were excluded. Women with hormone use prior to menopause or women who underwent chemotherapy/radiation were also excluded. The current study involved women from 11 population-based studies. The detailed characteristics of participants in these cohorts can be found in Supplementary Material, Table S1. After applying exclusion criteria, a total of 6510 women were included in the analysis. Admixture analyses showed that the percentage of African ancestry in these women ranged from 75.5 to 83.5%. The mean age at natural menopause ranged from 48.2 to 50.2 years old across cohorts. The majority of the women were recruited from the southern part of the USA.
Meta-analysis for age at natural menopause
We analyzed the association of ∼3.25 million genotyped and imputed SNPs with age at natural menopause in two steps. First in each cohort, we performed linear regression analyses, using an additive genetic model, with each SNP coded as a count of the number of minor alleles (0, 1 or 2 for genotyped SNPs and raw dosage values for imputed SNPs) and age at menopause as the response variable. To correct for global ancestry effects, ancestry background of participants was estimated separately in each cohort using principal component analyses (PCA). Recruitment sites and up to the first 10 principal components (PCs) were used as covariates. We performed meta-analysis across all 11 studies using association results from each cohort. SNPs found in only one cohort or genotyped in fewer than 1000 participants were excluded. Manhattan and quantile–quantile plots from the meta-analysis can be found in Supplementary Material, Figure S1. None of the associations achieved genome-wide significance (P-value < 5 × 10⁻⁸). Results for the top 10 SNPs with the lowest P-values are shown in Supplementary Material, Table S2. rs2165706, located in the intergenic region on chromosome 17, had the lowest P-value at 1.65 × 10⁻⁶.
Replication of loci previously identified in women of European ancestry
We hypothesized that loci that have been previously identified as associated with age at menopause in women of European ancestry would also be associated with age at menopause in African-American women. We took a broad approach in selecting SNPs in these loci for replication in which we included all SNPs reported to-date in European women without removing dependent signals. As information on linkage disequilibrium (LD) was not available for all SNPs, we did not want to miss true signals by prefiltering the list of reported SNPs. Previously reported SNPs in European women included 29 discovered in GWAS and meta-analysis study with P-values <10−7 and 12 SNPs with P-values not reaching genome-wide significance (<10−4) (17–19). These SNPs clustered ∼30 loci: RHBDL2, EXO1, FNDC4, TLK1, METAP1D, HELQ, RNF44, UIMC1/HK3, SYCP2L, BAT2, ASH2L, FSHB/MPPED2, PRIM1, KPNA3, TDRD3, POLG, GSPT1, BRSK1/TMEM150B, NLRP11, MCM8, CLDN11, SLC44A4, GPR124, DYNC1H1, BANP, chr2q23.3, chr7q22.3, chr9q21.31, chr11q25 and chr13q34. We also included seven SNPs located in F5, CYP1B1, ESR1, AMHR2, HSDB1, APOE that were implicated in candidate gene studies in European women (27–33). We also sought to identify additional signals in the LD block surrounding these index SNPs.
Loci on chromosome 1 (RHBDL2), 5 (HK3/UMC1), 12 (PRIM1), 19 (BRSK1/TMEM150B), 20 (MCM8) and AMHR2 are associated with age at menopause in African-American women
HK3/UMC1 locus on chromosome 5
Five correlated SNPs (rs2278493, rs691141, rs7718874, rs365132 and rs402511) have been reported in association with age at menopause at the HK3/UMC1 locus on chromosome 5 (17). Since these SNPs were identified in different cohorts of European ancestry, we first assessed whether they represented the same signal from this region by looking at the LD relationships among these SNPs in Europeans. We used the HapMapII CEU cohort as a proxy for Europeans and found these five SNPs likely reflected the same signal, thus allowing us to perform only one test at a significance level of 0.05. Of the five SNPs, only rs402511 was significant (P = 0.042) while rs365132 and rs7718874 showed similar magnitude of P-values (P = 0.052 and 0.063) (Table 1). The effect sizes for rs402511, rs365132 and rs77188754 were 0.205, 0.188 and −0.196, respectively, slightly attenuated compared with those reported in European women (0.39, 0.287 and −0.39, respectively, from initial discovery stage). To fine-map the signal in this locus, we examined the LD structure in the HapMapII YRI cohort as a proxy for African Americans. rs402511, rs365132 and rs77188754 were in perfect LD in Africans while the other two SNPs were not, indicating the functional SNP must be in LD with rs402511 in both European and African ethnic backgrounds. Due to the extent of LD in this region, we were only able to narrow the location of the signal down to 167.8 kb (chr5: 176 257 335–176 425 163, hg18) from 169.2 kb (chr5: 176 255 904–176 425 163, hg18) (Fig. 1A, CEU cohort on the left panel, YRI cohort on the right panel) (Table 2).
Table 1.
Replication of loci previously identified in GWAS of European cohorts
| SNP | Chromosome (position)a | AL | Freqb (s.e.) | Effectc (s.e.) | P-value | Total sample size | European ancestry women |
Gened | Genic location | ENCODE regulatione | ||||
|---|---|---|---|---|---|---|---|---|---|---|---|---|---|---|
| Effectc | P-value | TF Chip-seq (signal strength)f | DNaseI signalg | Histone markh | Chromatin statei | |||||||||
| rs4246511j | 1 (39152972) | T | 0.689 (0.013) | 0.206 (0.095) | 0.031# | 6510 | 0.24 | 9.08 × 10⁻¹⁷ | RHBDL2 | Intron | – | – | H3K4Me1 | Weak enhancer |
| rs1635501j | 1 (240107398) | T | 0.479 (0.019) | −0.111 (0.083) | 0.178 | 6478 | 0.16 | 8.46e10−10 | EXO1 | Intron | – | – | – | – |
| rs2303369j | 2 (27568920) | T | 0.369 (0.012) | 0.031 (0.086) | 0.721 | 6510 | −0.17 | 2.25 × 10⁻¹² | FNDC4 | Intron | – | – | – | – |
| rs10183486j | 2 (171699217) | T | 0.578 (0.015) | −0.028 (0.083) | 0.732 | 6502 | −0.19 | 2.21 × 10⁻¹⁴ | TLK1 | Intron | – | – | – | – |
| rs4693089j | 4 (84592646) | A | 0.235 (0.014) | 0.122 (0.099) | 0.223 | 6510 | −0.22 | 2.38 × 10⁻¹⁹ | HELQ | Intron | – | – | – | – |
| rs2278493k | 5 (176247040) | T | 0.139 (0.009) | −0.092 (0.118) | 0.438 | 6489 | −0.3 | 7.20 × 10⁻⁸ | HK3 | Intron | – | – | – | Repressed |
| rs691141k | 5 (176255904) | A | 0.424 (0.008) | −0.026 (0.082) | 0.753 | 6495 | 0.36 | 3.90 × 10⁻¹² | HK3 | Intron | – | 15 | – | Repressed |
| rs3762971l | 5 (176259554) | C | 0.061 (0.008) | −0.551 (0.171) | 1.25 × 10⁻³# | 6503 | – | – | HK3/UIMC1 | Intergenic | – | – | H3K4Me1 | Weak enhancer/ insulator |
| rs7718874k | 5 (176290671) | A | 0.210 (0.011) | −0.196 (0.101) | 0.052 | 6509 | −0.39 | 1.30 × 10⁻¹³ | UIMC1 | Intron | – | – | – | – |
| rs365132i,j,k | 5 (176311180) | T | 0.791 (0.011) | 0.188 (0.101) | 0.062 | 6508 | 0.39 /0.28 | 8.4 × 10⁻¹⁴/ 9.11 × 10⁻³² | UIMC1 | Synony-mous | – | – | – | – |
| rs402511k | 5 (176367046) | A | 0.793 (0.010) | 0.205 (0.101) | 0.042# | 6510 | 0.39 | 1.40 × 10⁻¹³ | UIMC1/ZNF346 | Intergenic | – | – | H3K4Me3, H3K27Ac | Weak promoter/weak enhancer |
| rs2153157j,k | 6 (11005474) | A | 0.709 (0.010) | 0.063 (0.091) | 0.487 | 6492 | 0.29 /0.16 | 5.4 × 10⁻⁸/ 7.76 × 10⁻¹² | SYCP2L | Intron | – | – | – | – |
| rs1046089j | 6 (31710946) | A | 0.492 (0.014) | −0.035 (0.083) | 0.672 | 6469 | −0.21 | 1.63 × 10⁻¹⁶ | BAT2 | Missense | – | – | – | – |
| rs2517388j | 8 (38096889) | T | 0.746 (0.027) | 0.009 (0.123) | 0.942 | 6509 | −0.26 | 9.31 × 10⁻¹⁵ | ASH2L | Intron | – | 15 | – | – |
| rs12294104j | 11 (30339475) | T | 0.097 (0.008) | 0.046 (0.137) | 0.736 | 6508 | 0.22 | 1.46 × 10⁻¹¹ | FSHB/MPPED2 | Intergenic | – | – | H3K27Ac | Weak enhancer |
| rs2277339j | 12 (55432336) | T | 0.807 (0.014) | 0.255 (0.112) | 0.022# | 6510 | 0.38 | 2.47 × 10⁻¹⁹ | PRIM1 | Missense | TAF1(1000), HEY1(1000), PAX5-C20 (900), NFKB(118), c-Myc (461), Brg1(407), BAF155(565), Max(386), Ini1(244), BAF170(442), POV2F2(600), Sin3AK-20(297), TCF12 (344), SIX5 (449), p300 (111), Nrf1 (289) | 381 | H3k4Me3, H3K27Ac | Active promoter |
| rs4886238j | 13 (60011740) | A | 0.279 (0.008) | 0.108 (0.092) | 0.239 | 6510 | 0.17 | 9.53 × 10⁻¹¹ | TDRD3 | Intron | – | – | – | – |
| rs7333181k | 13 (111019298) | A | 0.105 (0.007) | 0.128 (0.137) | 0.351 | 6510 | 0.52 | 2.50 × 10⁻⁸ | TEX29/SOX1 | Intergenic | – | – | – | – |
| rs2307449j | 15 (87664932) | T | 0.379 (0.012) | 0.112 (0.084) | 0.181 | 6487 | 0.18 | 3.56 × 10⁻¹³ | POLG | Intron | – | – | – | – |
| rs10852344j | 16 (11924420) | T | 0.177 (0.014) | −0.190 (0.110) | 0.085 | 6508 | −0.16 | 1.01 × 10⁻¹¹ | GSPT1/ TNFRSF17 | Intergenic | – | – | – | Repressed |
| rs12611091k | 19 (60492141) | T | 0.524 (0.015) | −0.136 (0.092) | 0.141 | 6503 | −0.33 | 6.60 × 10⁻¹⁰ | BRSK1 | Intron | – | – | – | – |
| rs1551562k | 19 (60506693) | A | 0.875 (0.012) | 0.374 (0.163) | 0.021# | 6510 | 0.43 /0.42 | 2.6 × 10⁻¹²/ 1.04 × 10⁻⁹ | BRSK1 | Intron | – | – | – | Weak enhancer |
| rs1172822k | 19 (60511657) | T | 0.277 (0.011) | −0.247 (0.097) | 0.011# | 6510 | −0.49 / 0.39 | 1.8 × 10⁻¹⁹/ 6.28 × 10⁻¹¹ | BRSK1 | Intron | POV2F2 (126) | 19 | – | Weak enhancer |
| rs7246479k | 19 (60516144) | T | 0.122 (0.037) | 0.141 (0.261) | 0.59 | 2990 | 0.36 | 2.30 × 10⁻¹² | TMEM150B | Missense | – | – | – | Weak enhancer |
| rs2384687k | 19 (60523000) | A | 0.599 (0.015) | 0.258 (0.084) | 2.13 × 10⁻³# | 6510 | 0.47/0.38 | 2.40 × 10⁻¹⁸/ 1.39 × 10⁻¹⁰ | TMEM150B | Intron | SIX5 (1000), TAF1 (68) | – | – | Weak enhancer/repressed |
| rs11668344j | 19 (60525476) | A | 0.649 (0.016) | 0.311 (0.091) | 6.54 × 10⁻⁴# | 6510 | 0.41 | 1.45 × 10−59 | TMEM150B | Intron | – | – | – | Weak enhancer/repressed |
| rs897798k | 19 (60525566) | A | 0.537 (0.019) | 0.207 (0.089) | 0.020# | 6510 | 0.40/0.30 | 1.10 × 10⁻¹⁴/ 3.91 × 10⁻⁸ | TMEM150B | Intron | – | – | – | Weak enhancer/repressed |
| rs12461110j | 19 (61012475) | A | 0.094 (0.012) | −0.177 (0.144) | 0.22 | 6497 | −0.15 | 8.74 × 10⁻¹⁰ | NLRP11 | Missense | BAF170 (682), c-MYC (536), Max (774) | – | H3K4Me1, H3K4Me3 | Weak promoter/weak enhancer |
| rs236114k | 20 (5883385) | T | 0.086 (0.007) | 0.139 (0.145) | 0.339 | 6501 | −0.49 | 9.71 × 10⁻¹¹ | MCM8 | Intron | – | – | – | – |
| rs16991615j,k | 20 (5896227) | A | 0.013 (0.003) | 0.346 (0.452) | 0.444 | 4390 | 1.07/0.94 | 1.2 × 10⁻²¹/ 1.42 × 10−73 | MCM8 | Missense | – | 12 | – | – |
| rs6139882l | 20 (5902202) | T | 0.052 (0.156) | −0.850 (0.265) | 1.36 × 10⁻³# | 6060 | – | – | MCM8 | Intron | GR (112) | – | – | – |
#P-value is significant at α = 0.05 (for previously identified SNPs), or at α = 0.05/N, where N is the number of SNPs on the LD block (for SNPs with the lowest P-value on the LD block).
AL, allele; Freq, frequency; s.e., standard error.
aPositions are in NCBI36 coordinates.
bAverage frequencies and effect sizes of minor alleles across all cohorts are listed.
cUnits in years.
dIf the SNP is in the intergenic region, the closest upstream and downstream genes are listed.
eData related to regulation of transcription from the ENCODE project (74).
fCHiP-seq results with identities of transcription factors. Highest signals are shown in brackets.
gRegions where the chromatin is hypersensitive. Regulatory regions tend to be DNaseI sensitive. DNaseI sensitivity is shown as the absolute density of in vivo cleavage sites across the genome mapped.
hModification of histone proteins is suggestive of enhancer (H3K4Me1 and H3K27Ac) and promoter activity (H3K4Me3, H3K4Me1 and H3K27Ac).
iComputed using Hidden Markov model by Broad Institute, MIT and MGH. Fifiteen states are possible (76).
jSNPs identified in previous meta-analyses (19). Effect sizes and P-values were from the published combined results.
lSNPs identified in the LD block analysis in current study.
Figure 1.

Association between age at menopause and chromosome 5 locus surrounding rs402511. Each panel shows the pairwise disequilibrium between SNPs in this region with rs402511 (A, colored in purple) and rs3762791 (B, colored in purple) estimated from HapMap CEU data (left panels) and HapMap YRI data (right panels). The r2 values are color coded according to the scale on each panel. The y-axis shows the P-values for strength of associations for each SNP in the region. The LD block where the signals reside is highlighted. rs402511 is associated with age at menopause in GWAS of women with European ancestry while a potential secondary signal, rs3762971, is found in women with African ancestry (17). r2 between rs3762971 and rs402511 is low in both HapMap CEU and YRI. The strongest signal in this genomic region reported from meta-analyses of European cohorts (rs365132) is in tight LD with rs402511 in both HapMap CEU (r2 = 0.93) and YRI (r2 = 1) populations, suggesting rs402511 and rs365132 represent the same signal.
Table 2.
Replication of loci identified from candidate gene studies in European cohorts
| Gene | SNP | Chromosome (position)a | Allelesb | Freq (s.e.) | Effect (s.e.) | P-value | Total sample size | Previous candidate studies |
|
|---|---|---|---|---|---|---|---|---|---|
| Effect | P-value | ||||||||
| F5 | rs6020 | 1 (167785736) | T/C | 0.275 (0.018) | −0.067 (0.094) | 0.473 | 6195 | − | 0.03 (31) |
| CYP1B1 | rs1056836 | 2 (38151707) | C/G | 0.755 (0.016) | −0.025 (0.097) | 0.794 | 6293 | +/+ | 0.004 (29)/0.82(33) |
| CYP1B1 | rs1800440 | 2 (38151643) | T/C | 0.954 (0.006) | −0.069 (0.21) | 0.744 | 5918 | +/+ | 0.018 (27)/0.25 (33) |
| ESR1 | rs2234693 | 6 (152205028) | T/C | 0.462 (0.014) | 0.159 (0.081) | 0.050 | 6502 | −/− | 0.0 3 (32)/0.12(33) |
| AMHR2 | rs2002555 | 12 (52103504) | A/G | 0.871 (0.008) | 0.332 (0.122) | 0.006* | 6508 | +/+ | 0.054 (28)/0.68 (33) |
| HSDB1 | rs2830 | 17 (37958089) | A/G | 0.686 (0.015) | −0.131 (0.091) | 0.151 | 6510 | −/− | 0.03 (30)/0.20(33) |
| APOE | rs7412 | 19 (50103919) | T/C | 0.098 (0.003) | −0.334 (0.425) | 0.431 | 720 | − | 0.03(31) |
*P-value is significant at α = 0.05.
Freq, frequency; s.e., standard error.
aPositions are in NCBI36 coordinates.
bMinor/major alleles. Average frequencies and effect sizes of minor alleles across all cohorts are listed.
To investigate whether there was any additional signal at this locus, we identified all SNPs in this LD block and determined that the number of effective tests is 29. We found that rs3762971 was also associated with age at menopause (P = 1.25 × 10⁻³, β = −0.551). rs3762971 is in low LD with rs402511 in both European (r2 = 0.25) and African cohorts (r2 = 0.28) (Fig. 1B, CEU cohort on the left panel, YRI cohort on the right panel). We performed conditional analyses incorporating both SNPs in the model to test the hypothesis that they may be two independent signals. We found that rs3762971 may not be an independent signal from rs402511 (P = 0.07 for rs3762971 at α-level of 0.05).
BRSK1/TMEM150B locus on chromosome 19
Seven moderately correlated SNPs at the BRSK1/TMEM150B locus on chromosome 19 (rs1172822, rs2384687, rs897798, rs7246479, rs1551562, rs12611091 and rs11668344) were previously reported to be associated with age at menopause. All but two SNPs (rs7246479, rs12611091) replicated in our cohorts of African-American women (P < 0.05). These two SNPs are not at high LD with the other five SNPs at this locus in Africans (Fig. 2). Rs11668344 had the lowest P-value of 6.54 × 10⁻⁴. Its effect size was 0.311 in our cohorts, slightly smaller than the effect size reported in European Americans (0.41 from the combined analysis (19)).
Figure 2.
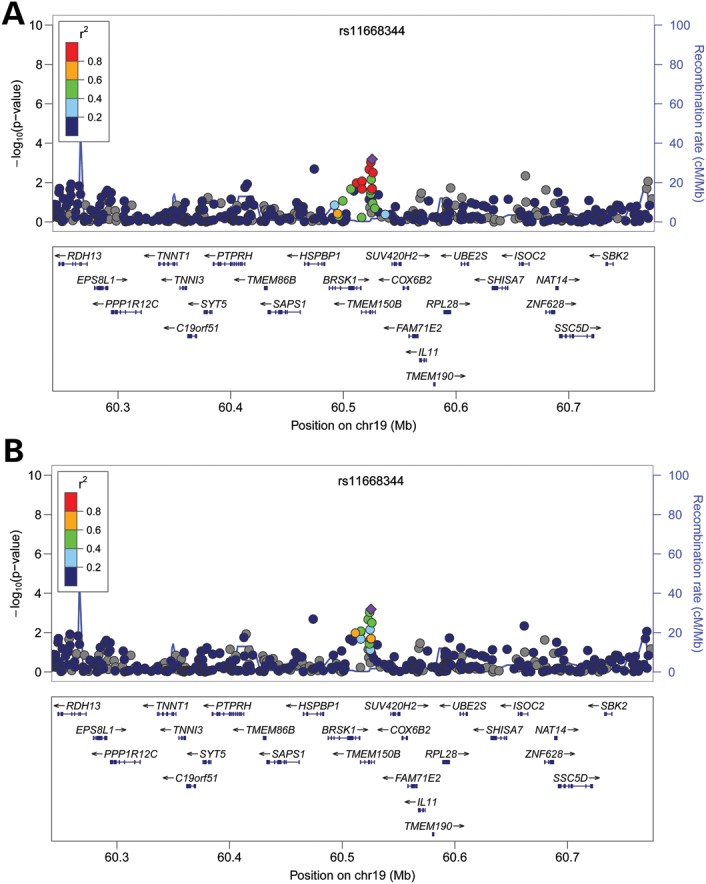
Association between age at menopause and chromosome 19 locus. Each panel shows the pairwise disequilibrium between SNPs in this region with rs11668344 (colored in purple) estimated from HapMap CEU data (A) and HapMap YRI data (B). The r2 values are color coded according to the scale on each panel. The y-axis shows the P-values for strength of associations for each SNP in the region. The LD block where the signals reside is highlighted. Five of the eight previously reported signals (rs1551562, rs1172822, rs2384687, rs11668344 and rs897798) in this region replicated in the current study. They likely all represent the same signal as they are in high LD with one another in both HapMap CEU and YRI populations. rs11668344 has the lowest P-value at this locus in our cohorts.
MCM8 locus on chromosome 20
Two SNPs identified to be associated with age at menopause, rs16991615 and rs236114, were located at the MCM8 locus on chromosome 20. Neither replicated in our cohort (rs16991615, P = 0.44; rs236114, P = 0.34) (Table 1). The minor allele frequencies of these two SNPs differed dramatically between Europeans and Africans, with much lower frequencies found in Africans (rs16991615: 7% versus 1.3%; rs236114: 21% versus 8.6%, respectively) (18,19). We sought to test all SNPs in high LD with these two SNPs in African Americans at this locus to confirm that the signal was not in high LD with these two SNPs; however, no LD information exists for rs16991615 in HapMapII YRI (Fig. 3A). SNPs in high LD with rs236114 at this locus all had similar P-values (Fig. 3B). We next investigated if there was any signal from this locus associated with age at menopause by testing all SNPs on the LD block surrounding this locus. Rs6139882 was found to be significant (P = 1.35 × 10⁻³ at α-level of 2.78 × 10⁻³). Its minor allele frequency (MAF) is 5.3% and the effect size is −0.8495. In Europeans, the LD between rs6139882 and the two reported SNPs are very low (r2 = 0.010 with rs16991615; r2 = 0.027 with rs236114). Rs6139882 is not in LD with rs236114 (r2 = 0.000) and its LD relationship is unavailable in African Americans, indicating that rs6139882 is likely a secondary signal from this locus.
Figure 3.

Association between age at menopause and chromosome 20 locus surrounding rs16991615. Each panel shows the pairwise disequilibrium between SNPs in this region with rs16991615 (A, colored in purple), rs236114 (B, colored in purple), and a likely secondary signal, rs6139882 (C, colored in purple) estimated from HapMap CEU data (left panels) and HapMap YRI data (right panels). The r2 values are color coded according to the scale on each panel. The y-axis shows the P-values for strength of associations for each SNP in the region. The LD block where the signals reside is highlighted. rs16991615 has a low MAF in HapMap YRI population and thus, there is no available LD information with other SNPs at this locus.
RHBDL2 locus on chromosome 1, PRIM1 locus on chromosome 12 and AMHR2 locus
Of the 16 SNPs identified only by a meta-analysis of European cohorts, we replicated two loci (rs4246511 at RHBDL2 on chromosome 1, P = 0.031; rs2277339 at PRIM1 on chromosome 12, P = 0.022) in African-American cohorts (Table 1). The effect sizes for rs4246511 and rs2277339 were 0.21 and 0.36 in our cohorts, similar to those reported previously (0.24 and 0.38, respectively, from the combined analysis (19)). In addition, 11 loci showed direction of effects consistent with previous reports.
Several candidate gene studies in women with European ancestry identified seven SNPs located in six loci (F5, CYP1B1, ESR1, AMHR2, HSDB1, APOE) as associated with age at menopause (27–33). We investigated whether these SNPs are also associated with this trait in African-American women. Of the seven SNPs, only rs2002555 located in AMHR2 was shown to be associated with our phenotype (P = 0.0062).
DISCUSSION
Genetic factors play an important role in determining the timing of natural menopause. These factors have been investigated most extensively in women of European ancestry but relatively little genetic research has been done in African-American women. Our study in African-American women is the largest and most comprehensive conducted to-date. In this study, we report that the mean age of women who underwent natural menopause ranged from 48.2 to 50.2 years of age across cohorts, which is earlier than women of European ancestry (1–3). Prior epidemiological studies have also shown that African-American women tend to experience menopause sooner (34,37). Differences in the timing of this universal event suggest that different modifiers might exist in different ethnic backgrounds.
Previous GWAS in women of European ancestry identified 21 loci associated with age at menopause (17–19). We investigated the relevance of these loci in 6510 African-American women and replicated rs4246511 in RHBDL2 on chromosome 1, rs2277339 in PRIM1 on chromosome 12, HK3/UMC1 locus on chromosome 5, BRSK1/TMEM150B locus on chromosome 19 and MCM8 on chromosome 20. Rs4246511 is located in the intron of RHBDL2 (rhomboid, veinlet-like 2), a protein thought to release soluble growth factors by proteolytic cleavage of certain membrane-bound substrates (38). Experimental data from the ENCODE project suggested that this region may have weak enhancer activity (39). Rs2277339 is a missense SNP located in PRIM1, a protein involved in DNA replication (40). Results from the ENCODE project showed that it is an active regulatory site where many transcription factors, such as TAF1, HEY1, PAX5-20 and histone markers, such as H3K4Me3 and H3K27Ac, bind. Since both RHBLD2 and PRIM1 are involved in DNA repair, we hypothesize that there may be some interaction between the DNA repair pathway and the pathway leading to menopause. We uncovered two signals at HK3/UIMC1 locus on chromosome 5: rs402511 and rs3762971. Both of them are located in the intergenic region, one upstream of HK3 and one downstream of UIMC1. The histone-binding patterns indicate that they may have weak enhancer activities and rs3762971 may be a part of an insulator sequence. All of the SNPs we replicated at BRSK1/TMEM150B locus are located in the introns and have been predicted to have weak enhancer and repressor activities. Rs16991615, a missense SNP at the MCM8 locus on chromosome 20, has the lowest P-value in studies of Caucasian women; however, it did not replicate in our cohort. One reason could be due to the different MAF in two ethnic groups (7% in Caucasians and 1.3% in Africans), requiring a far larger African-American sample to detect its effect. The effect size for rs16991615 in African Americans in our studies was 0.346 (s.e. = 0.452) while it was reported to be 1.07 (from combined analysis) in Caucasians (19). We, however, did uncover another signal at MCM8 (rs6139882 located in the intronic region of MCM8). It is plausible that there are multiple signals at this locus, resulting in a similar effect on MCM8 regulation. A recent study in African Americans also could not replicate the association between rs16991615 and age at menopause while another study in Hispanics showed the association, supporting a likely hypothesis that the causal variant at the MCM8 locus is in LD with rs16991615 in Caucasians and with rs6139882 in African Americans (41,42). MCM8 is expressed within the oocytes in the follicles of the human ovary and that at least in Caucasian women, rs16991615 is associated with antral follicle count, which reflects ovarian reserve (43). These findings all support the hypothesis that MCM8 is involved in the pathway leading to menopause.
Several small candidate gene studies suggested F5, CYP1B1, ESR1, AMHR2, HSDB1 and APOE may affect the timing of menopause. A recent study in a large number of women with European ancestry did not replicate any of these genes (33). Of these genes, we only found rs2002555 at AMHR2 to be significantly associated with age at menopause. AMHR2 is a gene coded for AMH (anti-Mullerian hormone) receptor, type II. A missense SNP in this locus is associated with sex determination in the tiger pufferfish, suggesting that AMHR2 played a role in the reproductive pathway across species (44). In humans, AMH binds to AMHR2. AMH is expressed by granulosa cells of the ovary during the reproductive years, setting the pace at which follicles reenter meiosis and growth (45). Hence, AMH level is associated with the rate of depletion of the primordial follicle pool and has been shown to be a good predictor for age at menopause (46).
Results from our meta-analysis of African-American women confirm some, but not all, of the findings in women of European ancestry. One reason is our modest sample size. With our sample size, however, we have at least 80% power to replicate SNPs with magnitude of effect as low as 0.2 in Caucasian women (Fig. 4; Supplementary Material, Table S4). These SNPs were located in five of the 21 loci identified from previous GWAS. Another three loci could be replicated with at least 60% power. Another reason is that even though menopause is a universal event determined mostly by genetic factors, there exist many modifiers in the associated loci. The complex genomic structures in African Americans make it more difficult to distinguish modifiers with smaller effects from background mutation due to the existence of more variants. Due to the different LD patterns in African Americans, the identified GWAS hits could be proxys for the causal variant, which may not be well genotyped or imputed in our data. Our meta-analysis supports the notion that genetic variants influencing menopause timing identified in European populations are also important in women of African ancestry residing in the USA. More functional experiments are needed as a direct way to test the effects these SNPs have on ovarian aging.
Figure 4.

Comparisons of effect magnitude of loci associated with age at menopause between women with European and African ancestry. Each point represents a previously identified locus associated with age at menopause in women with European ancestry. Loci replicated in the current African-American cohorts are colored in black. The dash line indicates the theoretical x = y line.
MATERIALS AND METHODS
Cohort descriptions
Women's Health Initiative (WHI) is a long-term national health study that focuses on strategies for preventing common diseases such as heart disease, cancer and fracture in postmenopausal women. A total of 161,838 women aged 50–79 years old were recruited from 40 clinical centers in the USA between 1993 and 1998. WHI consists of an observational study, two clinical trials of postmenopausal hormone therapy (estrogen alone or estrogen plus progestin), a calcium and vitamin D supplement trial, and a dietary modification trial (47). Study recruitment and exclusion criteria have been described previously (48). Study protocols and consent forms were approved by the institutional review boards at all participating institutions. Medical history was updated annually (for women in the observational study) or semiannually (for women in the clinical trials) by mail and/or telephone questionnaires. The WHI SNP Health Association Resource (WHI-SHARe) includes 8515 self-identified African-American women from WHI who provided consent for DNA analysis. Approximately 1% of samples could not be genotyped. Samples in the following categories were excluded: with call rates <95%, in duplicates, or with genotype calls on the Y chromosome. The relatedness among participants was investigated and there were 97 sets of monozygotic twins, parent–offspring, full-siblings and half-siblings. After retaining only one individual from each set, our final sample size was 8421 African-American women. Genotyping and quality control: all WHI samples, plus 2% blinded duplicates, were genotyped at Affymetrix Inc. (www.affymetrix.com) on the Genome-wide Human SNP Array 6.0 (909 622 SNPs). SNPs that were located on the Y chromosome or were Affymetrix quality control probes (not intended for analysis) were excluded (n = 3280). We also excluded SNPs that had call rates <95% and concordance rates <98%, leaving us 871 309 SNPs available for use in this study. The average concordance for blinded duplicate samples was 99.8%, and the average sample call rate after SNP exclusions was 99.8%. Imputation: imputation for WHI samples was performed in MACH 1.0.16 (http://www.sph.umich.edu/csg/abecasis/mach/) using a reference panel composed of 60 unrelated CEU and 60 unrelated YRI samples from HapMap release 22 (49). Phenotype definition: the questions related to menopausal status on WHI enrollment questionnaires were: ‘How old were you when you last had any menstrual bleeding? (If you are still having menstrual bleeding or periods, enter your current age.)’, ‘When was the last time you had any menstrual bleeding or spotting?’, ‘Did you ever have a hysterectomy?’ and ‘Did you ever have an operation to have one or both of your ovaries taken out?’ Eligible WHI participants were defined as those who had at least one ovary intact before the cease of menses and who reported having last menstrual bleeding or spotting over 12 months ago at the time of the study. WHI Participants with endometrial and cervical cancer history were removed. Population Stratification Correction: EIGENSTRAT was used to perform separate PCA to compute the first 10 PC for each individual (50). The reference panel was composed of 475 ancestors from HapMap populations and the Human Genome Diversity Panel. One hundred and nine CEU and 108 YRI individuals were taken from the HapMap. PCA analyses were performed on these two groups separately using EIGENSTRAT. Each population was subjected to five rounds of outlier removal based on the resulting PC information. In total, two outliers were identified in each group, bringing the final population sizes to 107 CEU and 106 YRI. Sixty-three individuals in HGDP sampled from the Americans (8 Surui, 22 Mayans, 13 Karitiana, 14 Pima, 6 Colombian) and 225 East Asians were subjected to the same EIGENSTRAT PCA-based outlier removal procedure as for the HapMap individuals, leaving 200 East Asian individuals and 62 Native Americans. 178 101 SNPs overlapping the HGDP, HapMap and WHI subjects were used in EIGENSTRAT. To complement the PCA analysis, frappe was used to estimate the relative contributions of all four ancestral groups to every admixed individual (51). A total of 656 852 autosomal SNPs were used in the frappe analysis.
The GENOA is a community-based study of hypertensive sibships that aims to identify genes influencing blood pressure (52,53). In the initial phase of the GENOA study (9/1995 to 6/2001), sibships containing ≥2 individuals with essential hypertension diagnosed before age 60 years were selected for participation. At the Jackson, MS field center, 1854 African Americans were enrolled. Participants returned in a second phase of GENOA (December 2000 to June 2004) for physical examination and measurement of non-conventional and novel risk factors. Genotyping and Quality Control: all samples were genotyped on Affymetrix Genome-wide human SNP array 6.0. Imputation: a single step approach was performed in MACH 1.0.16 (http://www.sph.umich.edu/csg/abecasis/mach/) using a reference panel composed of 60 unrelated CEU and 60 unrelated YRI samples from HapMap release 22 (49). Phenotype definition: subjects were asked whether or not they had reached menopause, defined as the cessation of natural menses for at least 12 months. Subjects that reported reaching menopause were asked ‘In what year or how old were you when you reached menopause?’. Subjects with menopause induced by surgery, radiation or chemotherapy were excluded. Population Stratification Correction: PCs for individuals were calculated based on all SNPs in the dataset without a reference panel using SNP and Variation Suite 7 (SVS7) from Golden Helix (http://www.goldenhelix.com/SNP_Variation/). The relative contribution of CEU and YRI in GENOA individuals were assessed on a panel of 385 ancestry informative markers using the STRUCTURE program (54).
The Health ABC is a NIA-sponsored ongoing cohort study of the factors that contribute to incident disability and the decline in function of healthier older persons, with a particular emphasis on changes in body composition in old age. Health ABC enrolled well functioning, community-dwelling black (n = 1281) and white (n = 1794) men and women aged 70–79 years between April 1997 and June 1998. Participants were recruited from a random sample of white and all black Medicare eligible residents in the Pittsburgh, PA and Memphis, TN, metropolitan areas. The key components of Health ABC include a baseline exam, annual follow-up clinical exams and phone contacts every 6 months to identify major health events and document functional status between clinic visits. Genotyping and Quality Control: genotyping was done in 1663 Caucasians and 1139 African Americans using the Illumina Human 1M-Duo BeadChip System at the Center for Inherited Disease Research (CIDR). SNPs were excluded if their call rate was <97%, Hardy–Weinberg equilibrium P-value was <10−6, or major allele frequency was <1%. Imputation: MACH 1.0.16 was used for imputation, using HapMap CEU release 22, build 36, as the reference panel. Phenotype Definition: participants who reported hysterectomy or ovariectomy (bilateral or otherwise) were excluded. Population Stratification Correction: EIGENSTRAT was used to calculate PCs for individuals using all SNPs that passed quality control.
The HANDLS is an interdisciplinary, community-based, prospective longitudinal epidemiologic study examining the influences of race and socioeconomic status (SES) on the development of age-related health disparities among socioeconomically diverse African Americans and whites in Baltimore. This study investigates whether health disparities develop or persist due to differences in SES, differences in race or their interaction. The HANDLS design is an area probability sample of Baltimore based on the 2000 Census. The study protocol facilitated our ability to recruit 3722 participants from Baltimore, MD with mean age 47.7 (range 30–64) years and 2200 African Americans (59%) and 1522 whites (41%). One thousand and twenty-four participants, a subset of participants self-reporting as African Americans, were genotyped at the Laboratory of Neurogenetics located in the National Institute on Aging in National Institutes of Health. Genotyping and Quality Control: samples were genotyped at 907 763 SNPs at the equivalent of Illumina 1M SNP coverage (709 samples using Illumina 1M and 1Mduo arrays, the remainder using a combination of 550K, 370K, 510S and 240S to equate the million SNP level of coverage), passing inclusion criteria into the genetic component of the study. Initial inclusion criteria for genetic data include concordance between self-reported sex and sex estimated from X chromosome heterogeneity, >95% call rate per participant (across all equivalent arrays), concordance between self-reported African ancestry and ancestry confirmed by analyses of genotyped SNPs, and no cryptic relatedness to any other samples at a level of proportional sharing of genotypes >15% (effectively excluding first cousins and closer relatives from the set of probands used in analyses). In addition, SNPs were filtered for HWE P-value of >10−7, missing by haplotype P-values of >10−7, MAF > 0.01 and call rate of >95%. Basic genotype quality control and data management were conducted using PLINKv1.06 (55). Cryptic relatedness was estimated via pairwise identity by descent analyses in PLINK and confirmed using RELPAIR (56). Imputation: imputation was performed in MACH 1.0.16 (http://www.sph.umich.edu/csg/abecasis/mach/) using a reference panel composed of 60 unrelated CEU and 60 unrelated YRI samples from HapMap release 22 (49). A two-stage process was used: first estimating recombination and crossover events in a random sample of 200 participants, then based on this data and the reference haplotypes, 200 iterations of the maximum likelihood model were used to estimate genotype dosages for imputed SNPs. Phenotype Definition: age at natural menopause was defined as the age at the last menstrual period which occurred naturally. Only women with natural menopause between the ages of 40 and 60 years were included. Subjects were asked ‘what was your age at menopause in years?’ Population Stratification Correction: ancestry estimates were assessed using both STRUCTUREv2.3 (54,57,58) and the multidimensional scaling (MDS) function in PLINKv1.06 (55). In the MDS analysis, HANDLS participants were clustered with data made available from HapMap Phase 3 for the YRI, ASW, CEU, TSI, JPT and CHB populations, using a set of 36 892 linkage-disequilibrium-pruned SNPs common to each population. This set of SNPs were chosen as they are not in r2> 0.20 with another SNP in overlapping sliding windows of 100 SNPs in the ASW samples. HANDLS participants with component vector estimates consistent with the HapMap ASW samples for the first 4 component vectors were included. In addition, the 1024 quality controlled HANDLS samples were later clustered among themselves using MDS to generate 10 component vectors estimating internal population structure within the HANDLS study.
MESA family study is a multicenter, family based study whose goal is to locate and identify genes contributing to the genetic risk for cardiovascular disease, by looking at the early changes of atherosclerosis within families (mainly siblings). The MESA family cohort was recruited from the six MESA Field Centers. MESA family participants underwent the same examination as MESA participants during May 2004–May 2007. In a small proportion of subjects, parents of MESA index subjects participating in MESA family were studied but only to have blood drawn for genotyping. DNA was extracted and lymphocytes immortalized for 1633 non-classic MESA family members (950 African Americans and 683 Hispanic Americans) from 594 families, yielding 3026 sibpairs. Genotyping and Quality Control: samples were genotyped on the Affymetrix Genome-wide human SNP array 6.0. Genotype calls were performed using Birdseed v1.33. We used PLINK, EIGENSTRAT and PREST-Plus software for quality control (59). Imputation: IMPUTE version 2.1.0 was used to perform imputation with HapMap Phases I and II (CEU, YRI, CHB, JPT populations) as the reference panel (release 22—NCBI Build 36 (dbSNP b126)) (60,61). Phenotype Definition: age at natural menopause was defined as the age at the last menstrual period which occurred naturally. Only women with natural menopause between the ages of 40 and 60 years were included. Subjects were asked ‘what was your age at menopause in years’. Population Stratification Correction: EIGENSTRAT was used to calculate two population stratification PCAs which were used as regression covariates (50).
CARe Consortium consisted of nine cohorts, of which four were included in the current study (62). These cohorts were: Atherosclerosis Risk in Communities (ARIC), Cardiovascular Health Study (CHS), Jackson Heart Study (JHS) and MESA.
The CHS is a population-based study of risk factors for cardiovascular disease in older adults, sponsored by the National Heart, Lung and Blood Institute. Men and women aged 65 and older were recruited from random samples of Health Care Financing Administration eligibility lists in four US communities in 1989–90 (63,64). In 1992–93, the original sample was supplemented with additional recruitment of African Americans at three of the study sites. Genotyping and Quality Control: genotyping was performed at the General Clinical Research Center's Phenotyping/Genotyping Laboratory at Cedars-Sinai Medical Center using the Illumina HumanOmni1-Quad_v1 BeadChip system. Genotypes were called using the Illumina GenomeStudio software. The following exclusions were applied to identify a final set of 963 248 SNPs (940 567 autosomal and 22 681 X): call rate <97%, HWE P < 10−5, >1 duplicate error or Mendelian inconsistency (for reference CEPH trios), heterozygote frequency = 0. Imputation: imputation for CHS samples was performed using BEAGLE version 3.2.1 using the default value of 10 iterations (65). Imputation was performed in a two-step process. The data were imputed to HapMap Phase III using reference panels from the ASW, YRI and CEU panels. They were separately imputed using HapMap Phase II using the CEU and YRI reference panels (build 36). For each imputation, the observed data were subset to the markers also observed in the given HapMap reference panel. The resulting two sets of imputed data were merged. If a marker was imputed in both the Phase II and Phase III data the Phase III data were used. Directly genotyped SNPs that were in the HapMap samples were not overwritten, but any missing data for a genotyped SNP were filled in using imputation. The final number SNPs in the imputed data set were 2 770 583. Phenotype Definition: age at natural menopause was assessed retrospectively by questionnaire and included age at last menstrual period, and age at hysterectomy or ovary removal, if either. Use of hormone replacement therapy was ascertained at clinic visits from medicine bottles, as previously described (66). Women with menopause due to hysterectomy and/or bilateral oophorectomy and women using hormone replacement therapy before menopause were excluded. Population Stratification Correction: PCs were computed based on 97 404 genotyped SNPs from the Illumina Omni 1M chip (approximately every 10th SNP on the array) using EIGENSTRAT (50).
The ARIC is a multicenter prospective investigation of atherosclerotic disease in a predominantly biracial population (67). Men and women aged 45–64 years at baseline were recruited from four communities: Forsyth County, North Carolina; Jackson, Mississippi; suburban areas of Minneapolis, Minnesota and Washington County, Maryland. A total of 15 792 individuals participated in the baseline examination in 1987–89 when blood was drawn for DNA extraction and participants consented to genetic testing. Genotype data were available on 2989 self-reported African-American individuals. Genotyping and Quality Control: samples were genotyped at the Broad Institute using the Affymetirx Genome-Wide Human SNP Array 6.0. Two methods of DNA quality control metrics were assessed on the samples (59). Genotypes were called using Birdseed v1.33. Quality control steps were performed using the software PLINK, EIGENSTRAT and PREST-Plus (59). Imputation: imputation was performed in MACH 1.0.16 (http://www.sph.umich.edu/csg/abecasis/mach/) using a reference panel composed of 60 unrelated CEU and 60 unrelated YRI samples from HapMap release 22 (49). Imputation based on Affymetrix data resulted in an allelic concordance rate of ∼95.6%, calculated as 1 – 1/2*|imputed_dosage − chip_dosage|. This rate is comparable with rates calculated for individuals of African descent imputed with the HapMap 2 YRI individuals. For each imputed sample, imputation was performed in two steps. For the first step, individuals with pedigree relatedness or cryptic relatedness (pi_hat > 0.05) were filtered. A subset of individuals was randomly extracted from each panel and used to generate recombination and error rate estimates for the corresponding sample. In the second step, these rates were used to impute all sample individuals across the entire reference panel. Imputation results were filtered at an RSQ_HAT threshold of 0.3 and an MAF threshold of 0.01. Phenotype Definition: a reproductive history questionnaire was completed by all women in the ARIC study at each study visit. The questionnaire included questions on whether they were currently menstruating, their age at last menstrual period (in years) for those who were no longer menstruating, as well as questions on whether and when they had undergone surgery to remove their womb and/or ovaries, or had undergone chemotherapy or radiation treatment. Age at menopause was determined from each woman's first report of their age at menopause (age at last period), and restricted to those that denied hysterectomy, denied removal of both ovaries prior to cessation of menses, and denied any chemotherapy or radiation treatment which stopped their menses. Only such cases between the ages of 40 and 60 years were included. Population Stratification Correction: EIGENSTRAT was used to compute the first 10 PCs for each individual (50). The reference populations were composed of 1178 European Americans and 756 Nigerians from the Yoruba region (59).
The JHS is a community-based observational study whose primary objective is to investigate causes of cardiovascular disease in an African-American population. The cohort (N = 5301) was sampled from non-institutionalized African Americans 35–84 years old in urban and rural areas of three counties in Mississippi (Hinds, Madison and Rankin) and involved four components: (i) African Americans from Jackson, MS who were also participants in the ARIC cohort (31%); (ii) a family cohort of relatives of index participants (22%; all ages ≥ 21 included); (iii) individuals from randomly sampled households from a commercial listing (17%) and (iv) a constrained volunteer sample designed to reflect the demographics of the overall population (30%) (68). This study was approved by the institutional review board, and all subjects provided written informed consent. Genotyping and Quality Control: samples were genotyped at the Broad Institute using the Affymetirx Genome-Wide Human SNP Array 6.0. Two methods of DNA quality control metrics were assessed on the samples (59). Genotypes were called using Birdseed v1.33. Quality control steps were performed using the software PLINK, EIGENSTRAT and PREST-Plus (59). Imputation: imputation was performed in MACH 1.0.16 (http://www.sph.umich.edu/csg/abecasis/mach/) using a reference panel composed of 60 unrelated CEU and 60 unrelated YRI samples from HapMap release 22 (49). Imputation based on Affymetrix data resulted in an allelic concordance rate of ∼95.6%, calculated as 1 – 1/2*|imputed_dosage – chip_dosage|. This rate is comparable with rates calculated for individuals of African descent imputed with the HapMap 2 YRI individuals. For each imputed sample, imputation was performed in two steps. For the first step, individuals with pedigree relatedness or cryptic relatedness (pi_hat > 0.05) were filtered. A subset of individuals was randomly extracted from each panel and used to generate recombination and error rate estimates for the corresponding sample. In the second step, these rates were used to impute all sample individuals across the entire reference panel. Imputation results were filtered at an RSQ_HAT threshold of 0.3 and an MAF threshold of 0.01. Phenotype Definition: only women with data for genotype and age at natural menopause who did not overlap with the ARIC cohort were included in the JHS analysis (N = 185). Age at natural menopause was defined as the age at the last menstrual period which occurred naturally. Only women with natural menopause between the ages of 40 and 60 years were included. Subjects were asked ‘what was your age at menopause in years’. Population Stratification Correction: EIGENSTRAT was used to compute the first 10 PC for each individual (50). The reference populations were composed of 1178 European Americans and 756 Nigerians from the Yoruba region (59).
The MESA is an NHLBI-funded study of the characteristics of subclinical cardiovascular disease and the risk factors that predict progression to clinically overt cardiovascular disease (69). MESA researchers study a diverse, population-based sample of 6814 asymptomatic men and women aged 45–84 recruited from six field centers across the United States: wake Forest University, Columbia University, Johns Hopkins University, University of Minnesota, Northwestern University and University of California-Los Angeles. Five of the six sites recruited African-American subjects. The first examination of MESA participants took place over 2 years, from July 2000–July 2002. Genotype data were available on 1646 African-American individuals. Genotyping and Quality control: samples were genotyped at the Broad Institute using the Affymetirx Genome-Wide Human SNP Array 6.0. Two methods of DNA quality control metrics were assessed on the samples (59). Genotypes were called using Birdseed v1.33. Quality control steps were performed using the software PLINK, EIGENSTRAT and PREST-Plus (59). Imputation: imputation was performed in MACH 1.0.16 (http://www.sph.umich.edu/csg/abecasis/mach/) using a reference panel composed of 60 unrelated CEU and 60 unrelated YRI samples from HapMap release 22 (49). Imputation based on Affymetrix data resulted in an allelic concordance rate of ∼95.6%, calculated as 1 – 1/2*|imputed_dosage – chip_dosage|. This rate is comparable with rates calculated for individuals of African descent imputed with the HapMap 2 YRI individuals. For each imputed sample, imputation was performed in two steps. For the first step, individuals with pedigree relatedness or cryptic relatedness (pi_hat > 0.05) were filtered. A subset of individuals was randomly extracted from each panel and used to generate recombination and error rate estimates for the corresponding sample. In the second step, these rates were used to impute all sample individuals across the entire reference panel. Imputation results were filtered at an RSQ_HAT threshold of 0.3 and an MAF threshold of 0.01. Phenotype Definition: age at natural menopause was defined as the age at the last menstrual period which occurred naturally. Only women with natural menopause between the ages of 40 and 60 years were included. Subjects were asked ‘what was your age at menopause in years’. Population Stratification Correction: EIGENSTRAT was used to compute the first 10 PCs for each individual (50). The reference populations were composed of 1178 European Americans and 756 Nigerians from the Yoruba region (59).
Two cohorts from the AABC were included in the current study: the Carolina Breast Cancer Study (CBCS) and The Multiethnic Cohort Study (MEC). The other cohorts were excluded due to the small size of subjects with available data (<100). The control and case samples were treated as distinct cohorts.
The CBCS is a population-based case–control study conducted between 1993 and 2001 in 24 counties of central and eastern North Carolina (70). Cases were identified by rapid case ascertainment system in cooperation with the North Carolina Central Cancer Registry and controls were selected from the North Carolina Division of Motor Vehicle and United States Health Care Financing Administration beneficiary lists. Participants' ages ranged from 20 to 74 years. DNA samples were provided from 656 African American cases with invasive breast cancer and 608 African-American controls. Genotyping and Quality control: genotyping in Stage 1 was conducted using the Illumina Human1M-Duo BeadChip. We removed samples with DNA concentrations <20 ng/ml. Following genotyping, we removed samples based on the following exclusion criteria: (i) unknown replicates (≥98.9% genetically identical) that we were able to confirm; (ii) unknown replicates that we were not able to confirm through discussions with study investigators; (iii) samples with call rates <95% after a second attempt; (iv) samples with ≤5% African ancestry and (v) samples with <15% mean heterozygosity of SNPs on the X chromosome and/or similar mean allele intensities of SNPs on the X and Y chromosomes (these are likely to be males). In the analysis, we removed SNPs with <95% call rates or MAFs <1%. To assess genotyping reproducibility, we included replicate samples, eliminating SNPs with genotyping concordance rates <98% based on the replicates. The final analysis dataset included 1 043 036 SNPs genotyped with an average SNP call rate of 99.7% and average sample call rate of 99.8%. Imputation: in order to generate a dataset suitable for fine-mapping, we carried out genome-wide imputation using the software MACH. Phased haplotype data from the founders of the CEU and YRI HapMap Phase 2 samples were used to infer LD patterns in order to impute un-genotyped markers. The r2 metric, defined as the observed variance divided by the expected variance, provides a measure of the quality of the imputation at any SNP, and was used as a threshold in determining which SNPs to filter from analysis (r2 < 0.3). Phenotype Definition: the definition of menopause was defined in the same manner as in the Multiethnic Cohort Study (see the following section). Population Stratification Correction: we used PCs analysis to estimate global ancestry among the 5761 individuals, using 2546 ancestry informative markers. To address the potential for confounding by genetic ancestry, we adjusted for global ancestry in all analyses.
The MEC is a prospective cohort study of 215 000 men and women in Hawaii and Los Angeles between the ages of 45 and 75 years at baseline (1993–1996) (71). Through December, 31 2007, a nested breast cancer case–control study in the MEC included 556 African-American cases (544 invasive and 12 in situ) and 1003 African-American controls. An additional 178 African-American breast cancer cases (ages: 50–84 years) diagnosed between June 1, 2006 and December 31, 2007 in Los Angeles County (but outside of the MEC) were combined with the MEC samples in the analysis. Genomic DNA was extracted for all samples using the QIAamp Blood Mini Kit (Qiagen, Valencia, CA, USA). Genotyping and Quality control: the genotyping and quality control procedures were identical to those used for CBCS. Imputation: the imputation procedures were identical to those used for CBCS. Phenotype Definition: age at last menstrual period cannot be used to uniformly estimate age at menopause because women who use sequential EPRT often continue to have monthly menstrual periods, irrespective of their ovarian function, and women on estrogen replacement therapy and continuous combined replacement therapy can rarely distinguish breakthrough bleeding from ovarian function-determined menses. Hence, for a woman taking HRT before her reported age at last menstrual period, we set her age of menopause as the year in which she began HRT use (excluding use of progestin alone), with the rationale that HRT use was started because of menopausal symptoms. Population Stratification Correction: the method for population stratification correction was identical to those used for CBCS.
Meta-analysis
We performed additional quality control on all genotyped and imputed SNPs in each cohort by removing SNPs in each cohort if they had <1% MAF, they had fewer than five copies of minor alleles, they were genotyped in fewer than 100 participants, or they had a quality score of <0.3 if they were imputed. In total, we have 3 252 746 SNPs that were found in at least one cohort available for analyses. In all cohorts, linear regression models were used to assess the association between each SNP and age at menopause. An additive genetic model was assumed using either genotyped SNPs or imputed SNP dosages. Global ancestry was adjusted by incorporating the first 10 PCs for each individual as covariates in the regression models. In GENOA and MESA family, additional covariates were included in the models to account for family structure in the cohort. In WHI and CHS, clinical sites were included as a covariate to correct for any geographical or socio-economical differences. Meta-analyses on the linear regression results were conducted using the Meta Analysis Helper (72). The genomic control correction was turned on and the analysis was based on effect sizes and their standard errors (SCHEME STDERR). Results for SNPs found in only one cohort or <1000 total participants were discarded.
We first performed a genome-wide discovery but no statistically significant associations were detected. To replicate previous findings, we compiled a list of SNPs previously associated with age at menopause in women with European ancestry. These SNPs included 15 SNPs discovered in GWAS with P-values <10−7 (distributed across five loci), nine SNPs with P-values between 10−4 and 10−7 (distributed across nine loci), 17 SNPs discovered by a GWAS meta-analysis (distributed across 17 loci, of which 16 were novel) and seven SNPs implicated in candidate gene studies (distributed across six loci) (17–19,27–33). The LD relationships among the SNPs in HapMap CEU in each region were carefully examined to determine the effective number of tests. Each region was tested at an α-level of 0.05. We examined each region further by defining a LD block for each region using the HapMap CEU population. Each LD block was defined as the largest block within 500 kb of the index SNPs on which the LD between the SNPs at both ends of the block and the index SNPs have r2 ≥ 0.5. The LD relationships among the SNPs on the same LD block were investigated and only one SNP from high LD pairs (r2 ≥ 0.8) was kept.
For index SNPs that replicated successfully, we sought to fine-map the signal by comparing the difference in LD structures between HapMap CEU and YRI samples. Graphs depicting the relationships between SNPs on the same LD block were created using LocusZoom (73). We also searched for possible secondary signals in the LD block.
In the event that the index SNP did not replicate, we identified a list of SNPs with at least r2 ≥ 0.8 with the index SNPs in HapMap CEU population using the Genome Variation Server (http://gversusgs.washington.edu/GVS). We performed meta-analyses for all of them to confirm that they had similar P-values. We then assessed whether there was any signal on the LD block by examining the SNPs on the block using a conservative Bonferroni correction based on the number of SNPs tested. When a secondary signal was found, we performed conditional analyses in each cohort with both the index SNP and the newly identified SNP in the model. Using the results from these conditional analyses, we performed a conditional meta-analysis to confirm the existence of a secondary signal.
We determined the likely function of the SNPs we investigated by utilizing the results from the Encyclopedia of DNA Elements Project (ENCODE) (74). In particular, we used the information from the ENCODE Integrated Regulation and ENCODE Chromatin State Segmentation by HMM from Broad Institute, MIT and MGM tracks from the UCSC Genome Browser (39). The ENCODE Integrated Regulation track consists of information from the following source: transcription levels assayed by RNA-seq on six-cell lines, enhancer- and promoter-associated histone mark (H3K4Me1) on eight-cell lines, enhancer- and promoter-associated histone mark (H3K27Ac) on eight-cell lines, promoter-associated histone mark (H3K4Me3) on nine-cell lines, digital DNaseI hypersensitivity clusters and transcription factor ChiP-seq data.
Power calculations were performed using Quanto (version 1.2.4) using the gene-only model with a continuous trait phenotype and unrelated individuals (75). For the age at menopause, we assumed a population mean of 50 years with a standard deviation of 5.7.
The summary-level P-values for the current study can be found in Supplementary Material, Table S5.
SUPPLEMENTARY MATERIAL
FUNDING
The National Institute of Health funded the CARe Consortium that contributed data and DNA to the Broad Institute (N01-HC-65226) to create the phenotype/genotype resource for wide dissemination to the biomedical community. NIH contract HHSN268200900055C and subcontract 5215810-550000234, provided statistical resources for the age at menopause genetic association analyses conducted in the CARe cohorts with additional support from R21AG032598.
The WHI program is funded by the National Heart, Lung, and Blood Institute, National Institutes of Health, US Department of Health and Human Services through contracts N01WH22110, 24152, 32100-2, 32105-6, 32108-9, 32111-13, 32115, 32118-32119, 32122, 42107-26, 42129-32, and 44221. This manuscript was prepared in collaboration with investigators of the WHI, and has been approved by the WHI. WHI investigators are listed at http://www.whiscience.org/publications/WHI_investigators_shortlist.pdf.
The MESA and MESA Family are conducted and supported by the National Heart, Lung, and Blood Institute (NHLBI) in collaboration with MESA investigators. Support for MESA is provided by contracts N01-HC-95159 through N01-HC-95169 and CTSA UL1-RR-024156. Funding for MESA Family is provided by grants R01-HL-071051, R01-HL-071205, R01-HL-071250, R01-HL-071251, R01-HL-071252, R01-HL-071258, R01-HL-071259, UL1-RR-025005, by the National Center for Research Resources, Grant UL1RR033176, and is now at the National Center for Advancing Translational Sciences, Grant UL1TR000124. Funding for genotyping was provided by NHLBI Contract N02-HL-6-4278 and N01-HC-65226.
The Cardiovascular Health Study was supported by contracts HHSN268201200036C, N01-HC-85239, N01 HC-55222, N01-HC-85079, N01-HC-85080, N01-HC-85081, N01-HC-85082, N01-HC-85083, N01-HC-85086 and grant HL080295 from the National Heart, Lung, and Blood Institute (NHLBI), with additional contribution from the National Institute of Neurological Disorders and Stroke (NINDS). Additional support was provided by AG-023629 from the National Institute on Aging (NIA). A full list of principal CHS investigators and institutions can be found at http://www.chs-nhlbi.org. DNA handling and genotyping was supported in part by National Center of Advancing Translational Technologies CTSI grant UL1TR000124 and National Institute of Diabetes and Digestive and Kidney Diseases grant DK063491 to the Southern California Diabetes Endocrinology Research Center and Cedars-Sinai Board of Governors' Chair in Medical Genetics (JIR).
The HANDLS study was supported by the Intramural Research Program of the NIH, National Institute on Aging and the National Center on Minority Health and Health Disparities (contract # Z01-AG000513 and human subjects protocol # 2009-149). Data analyses for the HANDLS study utilized the high-performance computational capabilities of the Biowulf Linux cluster at the National Institutes of Health, Bethesda, MD, USA (http://biowulf.nih.gov).
The Genetic Epidemiology Network of Arteriopathy (GENOA) phenotyping and genome-wide genotyping was supported by the National Heart, Lung, and Blood Institute of the National Institutes of Health (HL54457 and HL087660). Genotyping was performed at the Mayo Clinic (Stephen T. Turner, Mariza de Andrade, Julie Cunningham) and was made possible by the University of Texas Health Sciences Center (Eric Boerwinkle, Megan L. Grove-Gaona). We thank the families that participated in the GENOA study.
The Jackson Heart Study was supported by National Institutes of Health contracts (N01-HC-95170, N01-HC-95171 and N01-HC-95172) provided by the National Heart, Lung, and Blood Institute and the National Center for Minority Health and Health Disparities (NCMHD).
The African American Breast Cancer Consortium was supported by a Department of Defense Breast Cancer Research Program Era of Hope Scholar Award to C.A.H. (W81XWH-08-1-0383) and the Norris Foundation. Each of the participating studies was supported by the following grants: MEC (National Institutes of Health grants R01-CA63464 and R37-CA54281) and CBCS (National Institutes of Health Specialized Program of Research Excellence in Breast Cancer, grant number P50-CA58223, and Center for Environmental Health and Susceptibility, National Institute of Environmental Health Sciences, National Institutes of Health, grant number P30-ES10126) .
The Health ABC Study was supported by NIA contracts N01AG62101, N01AG62103 and N01AG62106. The genome-wide association study was funded by NIA grant 1R01AG032098-01A1 to Wake Forest University Health Sciences and genotyping services were provided by the Center for Inherited Disease Research (CIDR). CIDR is fully funded through a federal contract from the National Institutes of Health to The Johns Hopkins University, contract number HHSN268200782096C.
The Atherosclerosis Risk in Communities Study is carried out as a collaborative study supported by National Heart, Lung, and Blood Institute contracts (HHSN268201100005C, HHSN268201100006C, HHSN268201100007C, HHSN268201100008C, HHSN268201100009C, HHSN268201100010C, HHSN268201100011C and HHSN268201100012C), R01HL087641, R01HL59367 and R01HL086694; National Human Genome Research Institute contract U01HG004402; and National Institutes of Health contract HHSN268200625226C. The authors thank the staff and participants of the ARIC study for their important contributions. Infrastructure was partly supported by grant number UL1RR025005, a component of the National Institutes of Health and NIH Roadmap for Medical Research.
Conflict of Interest statement: None declared.
Supplementary Material
REFERENCES
- 1.Torgerson D.J., Thomas R.E., Reid D.M. Mothers and daughters menopausal ages: is there a link? Eur. J. Obstet. Gynecol. Reprod. Biol. 1997;74:63–66. doi: 10.1016/s0301-2115(97)00085-7. [DOI] [PubMed] [Google Scholar]
- 2.Parazzini F. Determinants of age at menopause in women attending menopause clinics in Italy. Maturitas. 2007;56:280–287. doi: 10.1016/j.maturitas.2006.09.003. [DOI] [PubMed] [Google Scholar]
- 3.McKinlay S.M. The normal menopause transition: an overview. Maturitas. 1996;23:137–145. doi: 10.1016/0378-5122(95)00985-x. [DOI] [PubMed] [Google Scholar]
- 4.Cooper G.S., Sandler D.P. Age at natural menopause and mortality. Ann. Epidemiol. 1998;8:229–235. doi: 10.1016/s1047-2797(97)00207-x. [DOI] [PubMed] [Google Scholar]
- 5.Jacobsen B.K., Nilssen S., Heuch I., Kvale G. Does age at natural menopause affect mortality from ischemic heart disease? J. Clin. Epidemiol. 1997;50:475–479. doi: 10.1016/s0895-4356(96)00425-8. [DOI] [PubMed] [Google Scholar]
- 6.Lindquist O., Bengtsson C., Hansson T., Roos B. Age at menopause and its relation to osteoporosis. Maturitas. 1979;1:175–181. doi: 10.1016/0378-5122(79)90006-9. [DOI] [PubMed] [Google Scholar]
- 7.van Der Voort D.J., van Der Weijer P.H., Barentsen R. Early menopause: increased fracture risk at older age. Osteoporos. Int. 2003;14:525–530. doi: 10.1007/s00198-003-1408-1. [DOI] [PubMed] [Google Scholar]
- 8.He L., Tang X., Li N., Wu Y.Q., Wang J.W., Li J.R., Zhang Z.X., Dou H.D., Liu J.J., Yu L.P., et al. Menopause with cardiovascular disease and its risk factors among rural Chinese women in Beijing: a population-based study. Maturitas. 2012;72:132–138. doi: 10.1016/j.maturitas.2012.02.013. [DOI] [PubMed] [Google Scholar]
- 9.van der Schouw Y.T., van der Graaf Y., Steyerberg E.W., Eijkemans J.C., Banga J.D. Age at menopause as a risk factor for cardiovascular mortality. Lancet. 1996;347:714–718. doi: 10.1016/s0140-6736(96)90075-6. [DOI] [PubMed] [Google Scholar]
- 10.Gosden R.G., Treloar S.A., Martin N.G., Cherkas L.F., Spector T.D., Faddy M.J., Silber S.J. Prevalence of premature ovarian failure in monozygotic and dizygotic twins. Hum. Reprod. 2007;22:610–615. doi: 10.1093/humrep/del382. [DOI] [PubMed] [Google Scholar]
- 11.Coulam C.B. Premature gonadal failure. Fertil. Steril. 1982;38:645–655. doi: 10.1016/s0015-0282(16)46688-4. [DOI] [PubMed] [Google Scholar]
- 12.Murabito J.M., Yang Q., Fox C., Wilson P.W., Cupples L.A. Heritability of age at natural menopause in the Framingham Heart Study. J. Clin. Endocrinol. Metab. 2005;90:3427–3430. doi: 10.1210/jc.2005-0181. [DOI] [PubMed] [Google Scholar]
- 13.Morris D.H., Jones M.E., Schoemaker M.J., Ashworth A., Swerdlow A.J. Familial concordance for age at natural menopause: results from the Breakthrough Generations Study. Menopause. 2011;18:956–961. doi: 10.1097/gme.0b013e31820ed6d2. [DOI] [PubMed] [Google Scholar]
- 14.de Bruin J.P., Bovenhuis H., van Noord P.A., Pearson P.L., van Arendonk J.A., te Velde E.R., Kuurman W.W., Dorland M. The role of genetic factors in age at natural menopause. Hum. Reprod. 2001;16:2014–2018. doi: 10.1093/humrep/16.9.2014. [DOI] [PubMed] [Google Scholar]
- 15.Mikkelsen T.F., Graff-Iversen S., Sundby J., Bjertness E. Early menopause, association with tobacco smoking, coffee consumption and other lifestyle factors: a cross-sectional study. BMC Public Health. 2007;7:149. doi: 10.1186/1471-2458-7-149. [DOI] [PMC free article] [PubMed] [Google Scholar]
- 16.Torgerson D.J., Avenell A., Russell I.T., Reid D.M. Factors associated with onset of menopause in women aged 45–49. Maturitas. 1994;19:83–92. doi: 10.1016/0378-5122(94)90057-4. [DOI] [PubMed] [Google Scholar]
- 17.He C., Kraft P., Chen C., Buring J.E., Pare G., Hankinson S.E., Chanock S.J., Ridker P.M., Hunter D.J., Chasman D.I. Genome-wide association studies identify loci associated with age at menarche and age at natural menopause. Nat. Genet. 2009;41:724–728. doi: 10.1038/ng.385. [DOI] [PMC free article] [PubMed] [Google Scholar]
- 18.Stolk L., Zhai G., van Meurs J.B., Verbiest M.M., Visser J.A., Estrada K., Rivadeneira F., Williams F.M., Cherkas L., Deloukas P., et al. Loci at chromosomes 13, 19 and 20 influence age at natural menopause. Nat. Genet. 2009;41:645–647. doi: 10.1038/ng.387. [DOI] [PMC free article] [PubMed] [Google Scholar]
- 19.Stolk L., Perry J.R.B., Chasman D.I., He C., Mangino M., Sulem P., Barbalic M., Broer L., Byrne E.M., Ernst F., et al. Meta-analyses identify 13 loci associated with age at menopause and highlight DNA repair and immune pathways. Nat. Genet. 2012;44:260–268. doi: 10.1038/ng.1051. [DOI] [PMC free article] [PubMed] [Google Scholar]
- 20.Murray A., Bennett C.E., Perry J.R., Weedon M.N., Jacobs P.A., Morris D.H., Orr N., Schoemaker M.J., Jones M., Ashworth A., et al. Common genetic variants are significant risk factors for early menopause: results from the Breakthrough Generations Study. Hum. Mol. Genet. 2010;20:186–192. doi: 10.1093/hmg/ddq417. [DOI] [PMC free article] [PubMed] [Google Scholar]
- 21.Perry J.R., Corre T., Esko T., Chasman D.I., Fischer K., Franceschini N., He C., Kutalik Z., Mangino M., Rose L.M., et al. A genome-wide association study of early menopause and the combined impact of identified variants. Hum. Mol. Genet. 2013;22:1465–1472. doi: 10.1093/hmg/dds551. [DOI] [PMC free article] [PubMed] [Google Scholar]
- 22.Aittomaki K., Lucena J.L., Pakarinen P., Sistonen P., Tapanainen J., Gromoll J., Kaskikari R., Sankila E.M., Lehvaslaiho H., Engel A.R., et al. Mutation in the follicle-stimulating hormone receptor gene causes hereditary hypergonadotropic ovarian failure. Cell. 1995;82:959–968. doi: 10.1016/0092-8674(95)90275-9. [DOI] [PubMed] [Google Scholar]
- 23.Laissue P., Christin-Maitre S., Touraine P., Kuttenn F., Ritvos O., Aittomaki K., Bourcigaux N., Jacquesson L., Bouchard P., Frydman R., et al. Mutations and sequence variants in GDF9 and BMP15 in patients with premature ovarian failure. Eur. J. Endocrinol. 2006;154:739–744. doi: 10.1530/eje.1.02135. [DOI] [PubMed] [Google Scholar]
- 24.Crisponi L., Deiana M., Loi A., Chiappe F., Uda M., Amati P., Bisceglia L., Zelante L., Nagaraja R., Porcu S., et al. The putative forkhead transcription factor FOXL2 is mutated in blepharophimosis/ptosis/epicanthus inversus syndrome. Nat. Genet. 2001;27:159–166. doi: 10.1038/84781. [DOI] [PubMed] [Google Scholar]
- 25.Rizzolio F., Bione S., Sala C., Goegan M., Gentile M., Gregato G., Rossi E., Pramparo T., Zuffardi O., Toniolo D. Chromosomal rearrangements in Xq and premature ovarian failure: mapping of 25 new cases and review of the literature. Hum. Reprod. 2006;21:1477–1483. doi: 10.1093/humrep/dei495. [DOI] [PubMed] [Google Scholar]
- 26.Qin Y., Choi Y., Zhao H., Simpson J.L., Chen Z.J., Rajkovic A. NOBOX homeobox mutation causes premature ovarian failure. Am. J. Hum. Genet. 2007;81:576–581. doi: 10.1086/519496. [DOI] [PMC free article] [PubMed] [Google Scholar]
- 27.Hefler L.A., Grimm C., Heinze G., Schneeberger C., Mueller M.W., Muendlein A., Huber J.C., Leodolter S., Tempfer C.B. Estrogen-metabolizing gene polymorphisms and age at natural menopause in Caucasian women. Hum. Reprod. 2005;20:1422–1427. doi: 10.1093/humrep/deh848. [DOI] [PubMed] [Google Scholar]
- 28.Kevenaar M.E., Themmen A.P., Rivadeneira F., Uitterlinden A.G., Laven J.S., van Schoor N.M., Lips P., Pols H.A., Visser J.A. A polymorphism in the AMH type II receptor gene is associated with age at menopause in interaction with parity. Hum. Reprod. 2007;22:2382–2388. doi: 10.1093/humrep/dem176. [DOI] [PubMed] [Google Scholar]
- 29.Long J.R., Shu X.O., Cai Q., Cai H., Gao Y.T., Jin F., Zheng W. Polymorphisms of the CYP1B1 gene may be associated with the onset of natural menopause in Chinese women. Maturitas. 2006;55:238–246. doi: 10.1016/j.maturitas.2006.03.005. [DOI] [PubMed] [Google Scholar]
- 30.Mitchell E.S., Farin F.M., Stapleton P.L., Tsai J.M., Tao E.Y., Smith-DiJulio K., Woods N.F. Association of estrogen-related polymorphisms with age at menarche, age at final menstrual period, and stages of the menopausal transition. Menopause. 2008;15:105–111. doi: 10.1097/gme.0b013e31804d2406. [DOI] [PubMed] [Google Scholar]
- 31.Tempfer C.B., Riener E.K., Keck C., Grimm C., Heinze G., Huber J.C., Gitsch G., Hefler L.A. Polymorphisms associated with thrombophilia and vascular homeostasis and the timing of menarche and menopause in 728 white women. Menopause. 2005;12:325–330. doi: 10.1097/01.gme.0000141760.98678.ed. [DOI] [PubMed] [Google Scholar]
- 32.Weel A.E., Uitterlinden A.G., Westendorp I.C., Burger H., Schuit S.C., Hofman A., Helmerhorst T.J., van Leeuwen J.P., Pols H.A. Estrogen receptor polymorphism predicts the onset of natural and surgical menopause. J. Clin. Endocrinol. Metab. 1999;84:3146–3150. doi: 10.1210/jcem.84.9.5981. [DOI] [PubMed] [Google Scholar]
- 33.He C., Kraft P., Chasman D.I., Buring J.E., Chen C., Hankinson S.E., Pare G., Chanock S., Ridker P.M., Hunter D.J. A large-scale candidate gene association study of age at menarche and age at natural menopause. Hum. Genet. 2010;128:515–527. doi: 10.1007/s00439-010-0878-4. [DOI] [PMC free article] [PubMed] [Google Scholar]
- 34.Bromberger J.T., Matthews K.A., Kuller L.H., Wing R.R., Meilahn E.N., Plantinga P. Prospective study of the determinants of age at menopause. Am. J. Epidemiol. 1997;145:124–133. doi: 10.1093/oxfordjournals.aje.a009083. [DOI] [PubMed] [Google Scholar]
- 35.Frere G. Mean age at menopause and menarche in South Africa. S. Afr. J. Med. Sci. 1971;36:21–24. [PubMed] [Google Scholar]
- 36.Kwawukume E.Y., Ghosh T.S., Wilson J.B. Menopausal age of Ghanaian women. Int. J. Gynaecol. Obstet. 1993;40:151–155. doi: 10.1016/0020-7292(93)90376-8. [DOI] [PubMed] [Google Scholar]
- 37.MacMahon B., Worcester J. Age at menopause. United States – 1960–1962 . Vital Health Stat. 1966;11:1–20. [PubMed] [Google Scholar]
- 38.Pascall J.C., Brown K.D. Intramembrane cleavage of ephrinB3 by the human rhomboid family protease, RHBDL2. Biochem. Biophys. Res. Commun. 2004;317:244–252. doi: 10.1016/j.bbrc.2004.03.039. [DOI] [PubMed] [Google Scholar]
- 39.Rosenbloom K.R., Sloan C.A., Malladi V.S., Dreszer T.R., Learned K., Kirkup V.M., Wong M.C., Maddren M., Fang R., Heitner S.G., et al. ENCODE Data in the UCSC Genome Browser: year 5 update. Nucleic Acids Res. 2013;41:D56–D63. doi: 10.1093/nar/gks1172. [DOI] [PMC free article] [PubMed] [Google Scholar]
- 40.Kilkenny M.L., De Piccoli G., Perera R.L., Labib K., Pellegrini L. A conserved motif in the C-terminal tail of DNA polymerase alpha tethers primase to the eukaryotic replisome. J. Biol. Chem. 2012;287:23740–23747. doi: 10.1074/jbc.M112.368951. [DOI] [PMC free article] [PubMed] [Google Scholar]
- 41.Spencer K.L., Malinowski J., Carty C.L., Franceschini N., Fernandez-Rhodes L., Young A., Cheng I., Ritchie M.D., Haiman C.A., Wilkens L., et al. Genetic variation and reproductive timing: African American Women from the Population Architecture Using Genomics and Epidemiology (PAGE) Study. PLoS ONE. 2013;8:e55258. doi: 10.1371/journal.pone.0055258. [DOI] [PMC free article] [PubMed] [Google Scholar]
- 42.Chen C.T.L., Fernández-Rhodes L., Brzyski R.G., Carlson C.S., Chen Z., Heiss G., North K.E., Woods N.F., Rajkovic A., Kooperberg C., et al. Replication of loci influencing ages at menarche and menopause in hispanic women: the Women's health initiative SHARe study. Hum. Mol. Genet. 2011;21:1419–1432. doi: 10.1093/hmg/ddr570. [DOI] [PMC free article] [PubMed] [Google Scholar]
- 43.Schuh-Huerta S.M., Johnson N.A., Rosen M.P., Sternfeld B., Cedars M.I., Reijo Pera R.A. Genetic markers of ovarian follicle number and menopause in women of multiple ethnicities. Hum. Genet. 2012;131:1709–1724. doi: 10.1007/s00439-012-1184-0. [DOI] [PMC free article] [PubMed] [Google Scholar]
- 44.Kamiya T., Kai W., Tasumi S., Oka A., Matsunaga T., Mizuno N., Fujita M., Suetake H., Suzuki S., Hosoya S., et al. A trans-species missense SNP in Amhr2 is associated with sex determination in the tiger pufferfish, Takifugu rubripes (fugu) PLoS Genet. 2012;8:e1002798. doi: 10.1371/journal.pgen.1002798. [DOI] [PMC free article] [PubMed] [Google Scholar]
- 45.Knight P.G., Glister C. TGF-beta superfamily members and ovarian follicle development. Reproduction. 2006;132:191–206. doi: 10.1530/rep.1.01074. [DOI] [PubMed] [Google Scholar]
- 46.Freeman E.W., Sammel M.D., Lin H., Gracia C.R. Anti-mullerian hormone as a predictor of time to menopause in late reproductive age women. J. Clin. Endocrinol. Metab. 2012;97:1673–1680. doi: 10.1210/jc.2011-3032. [DOI] [PMC free article] [PubMed] [Google Scholar]
- 47.Prentice R., Anderson G., Cummings S., Freedman L., Furberg C., Henderson M., Johnson S., Kuller L., Manson J., Oberman A., et al. Design of the Women's Health Initiative clinical trial and observational study. The Women's Health Initiative Study Group. Control. Clin. Trials. 1998;19:61–109. doi: 10.1016/s0197-2456(97)00078-0. [DOI] [PubMed] [Google Scholar]
- 48.Hays J., Hunt J.R., Hubbell F.A., Anderson G.L., Limacher M., Allen C., Rossouw J.E. The Women's Health Initiative recruitment methods and results. Ann. Epidemiol. 2003;13:S18–S77. doi: 10.1016/s1047-2797(03)00042-5. [DOI] [PubMed] [Google Scholar]
- 49.Li Y., Willer C., Sanna S., Abecasis G. Genotype imputation. Annu. Rev. Genomics Hum. Genet. 2009;10:387–406. doi: 10.1146/annurev.genom.9.081307.164242. [DOI] [PMC free article] [PubMed] [Google Scholar]
- 50.Price A.L., Patterson N.J., Plenge R.M., Weinblatt M.E., Shadick N.A., Reich D. Principal components analysis corrects for stratification in genome-wide association studies. Nat. Genet. 2006;38:904–909. doi: 10.1038/ng1847. [DOI] [PubMed] [Google Scholar]
- 51.Tang H., Peng J., Wang P., Risch N.J. Estimation of individual admixture: analytical and study design considerations. Genet. Epidemiol. 2005;28:289–301. doi: 10.1002/gepi.20064. [DOI] [PubMed] [Google Scholar]
- 52.FBPP-Investigators. Multi-center genetic study of hypertension: the Family Blood Pressure Program (FBPP) Hypertension. 2002;39:3–9. doi: 10.1161/hy1201.100415. [DOI] [PubMed] [Google Scholar]
- 53.Daniels P.R., Kardia S.L., Hanis C.L., Brown C.A., Hutchinson R., Boerwinkle E., Turner S.T. Familial aggregation of hypertension treatment and control in the Genetic Epidemiology Network of Arteriopathy (GENOA) study. Am. J. Med. 2004;116:676–681. doi: 10.1016/j.amjmed.2003.12.032. [DOI] [PubMed] [Google Scholar]
- 54.Pritchard J.K., Stephens M., Donnelly P. Inference of population structure using multilocus genotype data. Genetics. 2000;155:945–959. doi: 10.1093/genetics/155.2.945. [DOI] [PMC free article] [PubMed] [Google Scholar]
- 55.Purcell S., Neale B., Todd-Brown K., Thomas L., Ferreira M.A., Bender D., Maller J., Sklar P., de Bakker P.I., Daly M.J., et al. PLINK: a tool set for whole-genome association and population-based linkage analyses. Am. J. Hum. Genet. 2007;81:559–575. doi: 10.1086/519795. [DOI] [PMC free article] [PubMed] [Google Scholar]
- 56.Epstein M.P., Duren W.L., Boehnke M. Improved inference of relationship for pairs of individuals. Am. J. Hum. Genet. 2000;67:1219–1231. doi: 10.1016/s0002-9297(07)62952-8. [DOI] [PMC free article] [PubMed] [Google Scholar]
- 57.Falush D., Stephens M., Pritchard J.K. Inference of population structure using multilocus genotype data: linked loci and correlated allele frequencies. Genetics. 2003;164:1567–1587. doi: 10.1093/genetics/164.4.1567. [DOI] [PMC free article] [PubMed] [Google Scholar]
- 58.Falush D., Stephens M., Pritchard J.K. Inference of population structure using multilocus genotype data: dominant markers and null alleles. Mol. Ecol. Notes. 2007;7:574–578. doi: 10.1111/j.1471-8286.2007.01758.x. [DOI] [PMC free article] [PubMed] [Google Scholar]
- 59.Lettre G., Palmer C.D., Young T., Ejebe K.G., Allayee H., Benjamin E.J., Bennett F., Bowden D.W., Chakravarti A., Dreisbach A., et al. Genome-wide association study of coronary heart disease and its risk factors in 8,090 African Americans: the NHLBI CARe Project. PLoS Genet. 2011;7:e1001300. doi: 10.1371/journal.pgen.1001300. [DOI] [PMC free article] [PubMed] [Google Scholar]
- 60.Marchini J., Howie B., Myers S., McVean G., Donnelly P. A new multipoint method for genome-wide association studies by imputation of genotypes. Nat. Genet. 2007;39:906–913. doi: 10.1038/ng2088. [DOI] [PubMed] [Google Scholar]
- 61.Howie B.N., Donnelly P., Marchini J. A flexible and accurate genotype imputation method for the next generation of genome-wide association studies. PLoS Genet. 2009;5:e1000529. doi: 10.1371/journal.pgen.1000529. [DOI] [PMC free article] [PubMed] [Google Scholar]
- 62.Musunuru K., Lettre G., Young T., Farlow D.N., Pirruccello J.P., Ejebe K.G., Keating B.J., Yang Q., Chen M.H., Lapchyk N., et al. Candidate gene association resource (CARe): design, methods, and proof of concept. Circ. Cardiovasc. Genet. 2010;3:267–275. doi: 10.1161/CIRCGENETICS.109.882696. [DOI] [PMC free article] [PubMed] [Google Scholar]
- 63.Fried L.P., Borhani N.O., Enright P., Furberg C.D., Gardin J.M., Kronmal R.A., Kuller L.H., Manolio T.A., Mittelmark M.B., Newman A., et al. The Cardiovascular Health Study: design and rationale. Ann. Epidemiol. 1991;1:263–276. doi: 10.1016/1047-2797(91)90005-w. [DOI] [PubMed] [Google Scholar]
- 64.Tell G.S., Fried L.P., Hermanson B., Manolio T.A., Newman A.B., Borhani N.O. Recruitment of adults 65 years and older as participants in the Cardiovascular Health Study. Ann. Epidemiol. 1993;3:358–366. doi: 10.1016/1047-2797(93)90062-9. [DOI] [PubMed] [Google Scholar]
- 65.Browning B.L., Browning S.R. A unified approach to genotype imputation and haplotype-phase inference for large data sets of trios and unrelated individuals. Am. J. Hum. Genet. 2009;84:210–223. doi: 10.1016/j.ajhg.2009.01.005. [DOI] [PMC free article] [PubMed] [Google Scholar]
- 66.Psaty B.M., Lee M., Savage P.J., Rutan G.H., German P.S., Lyles M. Assessing the use of medications in the elderly: methods and initial experience in the Cardiovascular Health Study. The Cardiovascular Health Study Collaborative Research Group. J. Clin. Epidemiol. 1992;45:683–692. doi: 10.1016/0895-4356(92)90143-b. [DOI] [PubMed] [Google Scholar]
- 67.ARIC-Investigators. The Atherosclerosis Risk in Communities (ARIC) Study: design and objectives. Am. J. Epidemiol. 1989;129:687–702. [PubMed] [Google Scholar]
- 68.Taylor H.A., Jr, Wilson J.G., Jones D.W., Sarpong D.F., Srinivasan A., Garrison R.J., Nelson C., Wyatt S.B. Toward resolution of cardiovascular health disparities in African Americans: design and methods of the Jackson Heart Study. Ethnic. Dis. 2005;15:S6-4–S6-17. [PubMed] [Google Scholar]
- 69.Bild D.E., Bluemke D.A., Burke G.L., Detrano R., Diez Roux A.V., Folsom A.R., Greenland P., Jacob D.R., Jr, Kronmal R., Liu K., et al. Multi-ethnic study of atherosclerosis: objectives and design. Am. J. Epidemiol. 2002;156:871–881. doi: 10.1093/aje/kwf113. [DOI] [PubMed] [Google Scholar]
- 70.Newman B., Moorman P.G., Millikan R., Qaqish B.F., Geradts J., Aldrich T.E., Liu E.T. The Carolina Breast Cancer Study: integrating population-based epidemiology and molecular biology. Breast Cancer Res. Treat. 1995;35:51–60. doi: 10.1007/BF00694745. [DOI] [PubMed] [Google Scholar]
- 71.Kolonel L.N., Henderson B.E., Hankin J.H., Nomura A.M., Wilkens L.R., Pike M.C., Stram D.O., Monroe K.R., Earle M.E., Nagamine F.S. A multiethnic cohort in Hawaii and Los Angeles: baseline characteristics. Am. J. Epidemiol. 2000;151:346–357. doi: 10.1093/oxfordjournals.aje.a010213. [DOI] [PMC free article] [PubMed] [Google Scholar]
- 72.Willer C.J., Li Y., Abecasis G.R. METAL: fast and efficient meta-analysis of genomewide association scans. Bioinformatics. 2010;26:2190–2191. doi: 10.1093/bioinformatics/btq340. [DOI] [PMC free article] [PubMed] [Google Scholar]
- 73.Pruim R.J., Welch R.P., Sanna S., Teslovich T.M., Chines P.S., Gliedt T.P., Boehnke M., Abecasis G.R., Willer C.J. LocusZoom: regional visualization of genome-wide association scan results. Bioinformatics. 2010;26:2336–2337. doi: 10.1093/bioinformatics/btq419. [DOI] [PMC free article] [PubMed] [Google Scholar]
- 74.Encode-Project-Consortium. The ENCODE (ENCyclopedia Of DNA Elements) Project. Science. 2004;306:636–640. doi: 10.1126/science.1105136. [DOI] [PubMed] [Google Scholar]
- 75.Geuderman W.J., Morrison J.M. 2006. QUANTO 1.1: a computer program for power and sample size calculations for genetic-epidemiology studies http://hydra.usc.edu/gxe. (May 8, 2007 date last accessed)
- 76.Ernst J., Kheradpour P., Mikkelsen T.S., Shoresh N., Ward L.D., Epstein C.B., Zhang X., Wang L., Issner R., Coyne M., et al. Mapping and analysis of chromatin state dynamics in nine human cell types. Nature. 2011;473:43–49. doi: 10.1038/nature09906. [DOI] [PMC free article] [PubMed] [Google Scholar]
Associated Data
This section collects any data citations, data availability statements, or supplementary materials included in this article.