Abstract
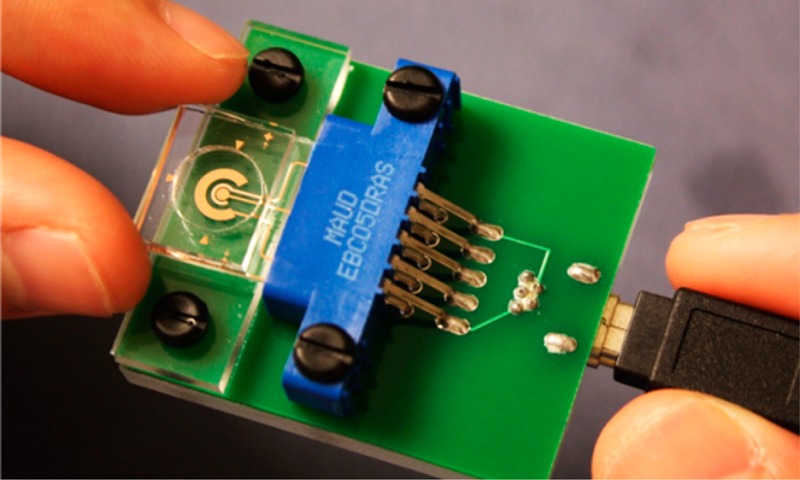
In this work, we report the first copper-based point-of-care sensor for electrochemical measurements demonstrated by zinc determination in blood serum. Heavy metals require careful monitoring, yet current methods are too complex for a point-of-care system. Electrochemistry offers a simple approach to metal detection on the microscale, but traditional carbon, gold (Au), or platinum (Pt) electrodes are difficult or expensive to microfabricate, preventing widespread use. Our sensor features a new low-cost electrode material, copper, which offers simple fabrication and compatibility with microfabrication and PCB processing, while maintaining competitive performance in electrochemical detection. Anodic stripping voltammetry of zinc using our new copper-based sensors exhibited a 140 nM (9.0 ppb) limit of detection (calculated) and sensitivity greater than 1 μA/μM in the acetate buffer. The sensor was also able to determine zinc in a bovine serum extract, and the results were verified with independent sensor measurements. These results demonstrate the advantageous qualities of this lab-on-a-chip electrochemical sensor for clinical applications, which include a small sample volume (μL scale), reduced cost, short response time, and high accuracy at low concentrations of analyte.
Point-of-care (POC) devices that are accurate, robust, low cost, rapid, easy-to-use, and disposable are in great demand for determination of trace metals in blood, either in exposure assessment or in clinical settings. Conventional methods are based on atomic absorption spectroscopy (AAS)1 or inductively coupled plasma mass spectrometry (ICP-MS).2 While both of these methods provide accurate measurements in serum or blood, they require expensive instrumentation and highly trained operators. Furthermore, significant time delays are associated with these approaches due to shipping of samples to centralized laboratories, making them less desirable or even unsuitable. Another challenge is that the amount of sample necessary to perform these analyses is often significant and can be difficult to obtain in pediatric or severely ill patients.
Herein, we use the determination of zinc (Zn) as a representative example to demonstrate a new copper-based sensor for POC. Zn is an essential trace metal that plays a key role in metabolism as a component of many enzymes, hormones, and nucleic acid transcription-related factors.3,4 Pediatric and adult studies have consistently demonstrated abnormally low Zn levels in critically ill patients.5−7 While Zn homeostasis can be easily restored through Zn supplementation,8−10 excess Zn intake can lead to copper deficiency and neurologic disease such as myelopathy or Alzheimer’s.11,12 For such patients, careful monitoring of Zn levels in blood becomes critically important for the supplementation strategy to work. Traditionally, such measurements are performed in blood serum, with total Zn concentrations in the 65–95 μg/dL (10–15 μM) range.13
Anodic stripping voltammetry (ASV) is a demonstrated approach for determining Zn and other trace metals. Figure 1a schematically illustrates the concept. The analysis involves a preconcentration step to accumulate the target metal ions onto the electrode surface by reducing them to atoms, followed by a positively scanned stripping step to reoxidize the metal back to its ionic form. ASV is rapid and can be cost-effective, while reaching limits of detection (LODs) in the subnanomolar range. In recent work, we14−16 reported the first microscale sensor for determination of Zn and manganese (Mn) using a bismuth (Bi) working electrode (with silver/silver chloride reference and gold auxiliary electrodes). While the sensor performed reliably in acetate buffer with a LOD of 6 μM for Zn, detection in serum exhibited large variability,15 making determination challenging. Moreover, use of gold is not conducive to low-cost disposable sensors needed in this POC application.
Figure 1.
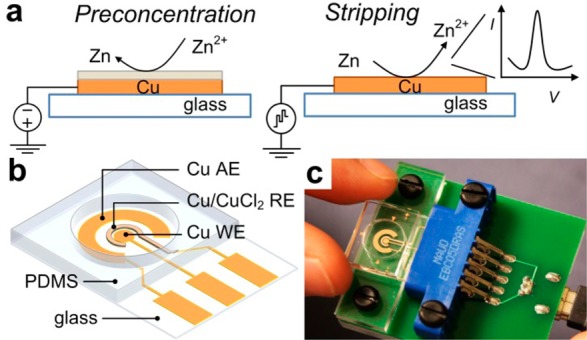
(a) Illustration of ASV of Zn on solid copper working electrode. (b) Schematic of the electrochemical cell, working electrode (WE), auxiliary electrode (AE), and reference electrode (RE). (c) Photograph of the sensor with a mini-USB potentiostat connection.
Herein, we report a new sensor concept that uses copper (Cu) film as the sensing element. Cu is not a material typically used as a working electrode in voltammetric analyses because it is easily oxidized. Nevertheless, it offers a number of advantages that we cannot overlook. It is a commonly used material in electronics, is significantly lower in cost than gold or platinum, and is compatible with numerous microfabrication methods. Thus, we developed an electrochemical sensor that consists of a single metal layer, patterned in a single photolithography step to form all three electrodes used for ASV: a Cu working electrode (WE), a Cu auxiliary electrode (AE), and a reference electrode formed by chloridization (Cu/CuCl2, RE). While Cu REs have been considered in the 1960s,17 they were rejected due to relatively high activity and thus poor long-term stability. In this work, this limitation is offset by ease of fabrication, in the context of a disposable sensor application. The electrochemical cell is schematically shown in Figure 1b. Our experimental results show that such a sensor is sufficiently stable for at least one electrochemical measurement, which is more than sufficient when disposable POC applications are considered. The Cu-based sensor (Figure 1c) was optimized to demonstrate a LOD of 140 nM (9.0 ppb) and good linearity below 5 μM. Ultimately, with additional integration of sample preparation on chip, a portable sensor system capable of Zn determination in only a 100 μL sample (a couple drops of blood) can be developed.
Experimental Section
Reagents
Reagents were prepared from chemicals purchased from Fisher Scientific, unless stated otherwise. Piranha solution was prepared from H2SO4 and H2O2 in 7:3 v/v ratio. Copper etchant was prepared from H2SO4, H2O2, and deionized (DI) water in 1:1:10 v/v/v ratio. Titanium etchant was prepared from HNO3, HF, and DI water in 1:2:7 v/v/v ratio. Sodium acetate buffer (0.1 M, pH 4.65) was purchased from Sigma-Aldrich. Acetate buffers with pH from 5 to 6.5 were prepared by addition of NaOH(s) to the commercial buffer. Solutions containing 0.1 μM to 10 mM Zn were prepared by diluting Zn stock solution (TraceCERT, 1000 mg/L in 2% nitric acid, Fluka) with acetate buffer (0.1 M, pH 6). Reagents used in the extraction procedure will be indicated in that section.18−20
Fabrication of Cu-Based Sensors
The sensor was fabricated using a combination of lithographic and deposition techniques. Metal layers of 20 nm titanium (Ti) /200 nm Cu were evaporated (Temescal FC-1800 E-Beam Evaporator) onto glass slides cleaned in Piranha solution. An etching mask of ∼2 μm was formed using photolithography with Shipley 1818 photoresist and developer 351. The three-electrode patterns with contact pads were formed by wet etching in Cu etchant for 10 s followed by Ti etchant for 3 s, with 1 min of rinsing in DI water after each etching step. An integrated Ag/AgCl RE was fabricated by electroplating approximately 300 nm Ag (Techni-Silver Cyless II RTU, Technic Inc.) on Cu for 60 s with cathodic current of 3 mA/cm2 and then chloridizing the Ag in 1 M KCl with anodic current of the same current density for 30 s to convert part of the silver film to AgCl. The new RE, Cu/CuCl2, was fabricated by chloridizing Cu in 1 M KCl with a 3 mA/cm2 anodic current for 30 s. During the electrodeposition, the integrated Cu AE was used to sustain the current.
A polymer well with ∼9 mm diameter and 3 mm thickness was fabricated in polydimethylsiloxane (PDMS) using the standard soft lithography process.21 It was bonded to a clean glass substrate containing the electrode patterns using plasma discharge (BD-20AC, Electo-Technic Products Inc.) after 20 s of treatment on the PDMS surface only. A diagram of the sensor illustrating the three electrodes and PDMS well is shown in Figure 1b. An interface consisting of an edge-board connector (Sullins, EBC05DRAS) and a mini-USB port were soldered on a PCB to simplify and improve connection between the sensor and the potentiostat.
Sample Extraction Procedure
An extraction procedure with trifluoroacetic acid was used to extract Zn from bovine serum. Dithizone (12.8 mg) was first dissolved in 10 mL chloroform and deprotonated by mixing with 10 mL (pH 9) 1 M ammonia/0.5 M ammonium buffer solution to form the extracting solution. Then the extracting solution was mixed with the solution containing 1 mL bovine serum and 0.5 mL of 0.05 M potassium thiocyanate ethanolic solution. The mixture was sonicated for 5 min and then transferred into a 50 mL plastic tube and centrifuged for 10 min at 4000 rpm. The organic phase was collected and sonicated with 10 mL 2 M trifluoroacetic acid for another 5 min. The clear aqueous phase was collected and mixed with acetate buffer (0.1 M). The pH was adjusted to 6 with NaOH for the following ASV experiments.
Electrochemical Experiments
A miniature USB WaveNow Potentiostat/Galvanostat (AFTP1, Pine Instrument) with AfterMath Data Organizer software was used in all electrochemical experiments. A sensor was inserted into the interface and connected to the potentiostat using a mini-USB cable (Figure 1c). Chronopotentiometry under 10 μA current was performed to evaluate the quality of the Cu AE, while a Bruker ContourGT-K1 Optical Microscope was used to scan its surface roughness. Both cyclic voltammetry (CV) and ASV were performed to compare potential windows and stability of sensors with two types of REs. ASV was also used to calibrate the Cu WE for Zn and to measure the Zn level in unknown samples. For all the experiments performed in the buffer, we used 100 μL as the sample volume; it was increased to 200 μL for the measurements in serum. The sweep rate for CV was 100 mV/s. After a series of optimizations of preconcentration conditions and stripping waveform parameters, we selected −1 V as the preconcentration potential with 300 s duration, a stripping range from −1 to −0.3 V, and waveform parameters of 50 ms for period, 6 mV for increment, and 60 mV for amplitude. For the calculation of the detection limit, we repeated our lowest measurable data point, 100 nM of Zn, for 7× and obtained the standard deviation. We also obtained the slope of the correlation equation and calculated the LOD as 3σ/slope.
Results and Discussion
Novel Cu-Based Sensor
Our previous work14,22 demonstrated a miniature electrochemical cell with Bi WE for detection of metals such as Mn and Zn that exhibit a very negative stripping potential. The sensor size was approximately 15 × 19 mm, required only microliters of sample, and performed an analysis in less than 15 min. While both electrodeposited and thermally evaporated Bi films were investigated, it is the evaporated Bi WEs that proved to exhibit more stable (coefficient of variation <2%) measurements of Zn in acetate buffer.16 Although the evaporated Bi WEs performed well (LOD = 60 nM), the fabrication procedure for these electrodes was complex and costly, requiring multiple photolithography, e-beam evaporation, and lift-off process steps. For a disposable sensor, cost is the most critical challenge after performance. Thus, we investigated new materials for disposable POC electrochemical sensors, with the goal of low-cost and simple fabrication, while retaining good electrochemical performance.
To overcome the aforementioned shortcomings of the Bi-based sensors, we developed a sensor based on a Cu thin film. Using Cu as the sensor material has the potential to address all of the challenges of a disposable POC sensor, from the fabrication prospective. Our sensor consisted of a Cu WE, a Cu/CuCl2 RE, and a Cu AE, as illustrated in Figure 1b. The layout of the electrode patterns was generally similar to our earlier work, with a user-friendly interface that integrated an edge board connector and a mini-USB port to provide simplified connection and accessibility (Figure 1c). Fabrication of such a sensor involves a single photolithography step on a thermally evaporated Cu film. This is a significant improvement, eliminating the alignment necessary for the second photolithography step in evaporated Bi WE fabrication. Migrating to a Cu/CuCl2 RE can also eliminate the additional step of electroplating silver in the fabrication of a Ag/AgCl RE. These advantages of Cu from the cost and fabrication points of view make the Cu-based sensor concept highly appealing if the electrochemical performance is acceptable. Thus, experiments were performed to examine suitability of Cu for all three electrodes for ASV measurements in a disposable sensor intended for single use applications.
Cu Auxiliary Electrode
It was critical to first demonstrate that a Cu AE can provide stable current during both preconcentration and stripping steps, since a Cu AE is easily oxidized when functioning as an anode in ASV. In conventional electrochemical cells, AEs are fabricated from inert materials, such as Pt or graphite. Thus, we assessed the stability of our Cu AE by comparing it with a Pt electrode using chronopotentiometry under 10 μA current, which is the typical upper limit of current we see in stripping experiments. During this experiment, we used a graphite electrode as the cathode, with Cu or Pt as the anode.
As expected, the Pt electrode maintained a stable potential at about 1.3 V for the oxidation of water during the entire 60 min experiment (Figure 2b), indicating that it is an excellent, perfectly polarizable AE. The Cu electrode, on the other hand, is a nonpolarizable electrode undergoing oxidation during the entire process. To evaluate stability of multiple devices, we repeated the experiment (n = 4) with a fresh disposable sensor each time and obtained the average curve. All Cu AEs exhibited a stable behavior for the first 10 min by providing relatively constant potential below 0.1 V for the oxidation of Cu. The oxidation and stripping of Cu occurred at a low rate, which had little effect on the surface of the electrode during this time (Figure 2a; 0 min). Roughness of a fresh Cu surface was 0.3 ± 0.03 nm. The observed signal variability was quite low (coefficient of variation = 5%), although the Pt electrode was clearly superior (coefficient of variation = 0.2%). In the next 10 min, however, the potential began drifting positively, which coincides with an observable degree of degradation of the AE, reduced Cu thickness, and increased surface roughness to 6.1 ± 2.3 nm (Figure 2a; 20 min). After 20 min, the potential shifted abruptly to a significantly more positive value where the AE continued to function but with erratic behavior of the potential. At this stage, the electrode process is probably a combination of Cu and water oxidation because the Cu surface area is below the level needed to sustain the 10 μA current by Cu oxidation alone. By 60 min, the Cu layer of the electrode is largely removed (Figure 2a; 60 min), with the surface roughness increased to 13.4 ± 11.5 nm. This introduced a substantial increase in resistance for a given current (Figure 2b).
Figure 2.
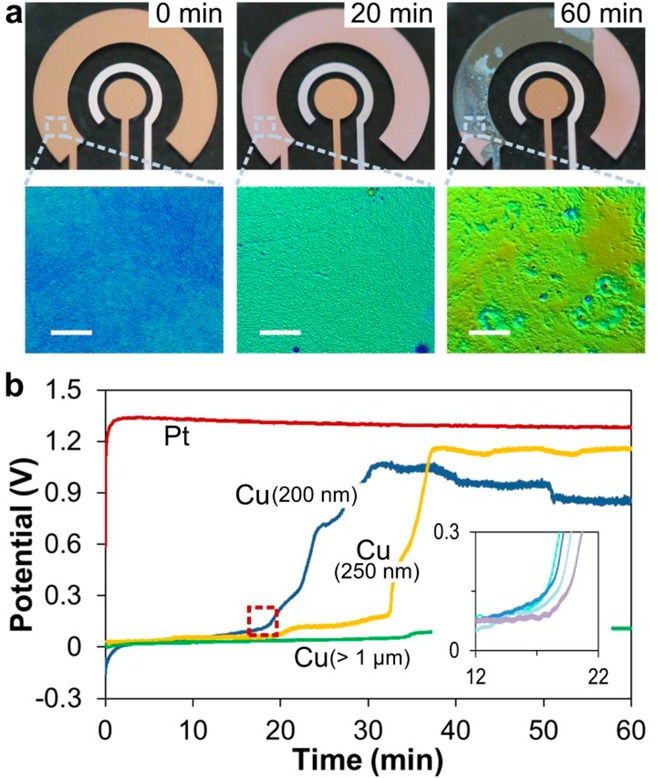
Stability of Cu as an auxiliary electrode. (a) Images of a clean Cu AE and Cu AEs that have undergone 20 and 60 min of oxidation with zoom-in optical profiler images illustrating surface roughness (scale bar represents 100 μm). (b) Chronopotentiometry of Pt and Cu AEs under the current of 10 μA. The Cu AEs varied in thickness from 200 nm to >1 μm. The curve for 200 nm Cu AE is an average of n = 4 measurements. Close-up of the point of failure indicated with dashed line is shown in the inset, which illustrates the actual four curves used in obtaining the average.
These results demonstrate that a Cu anode is able to sustain current and thus could be used as an AE if the experiment time is kept short. For most stripping analyses, 10 min is sufficient and the current during preconcentration is generally below 10 μA. Thus, a 200 nm thick Cu AE is acceptable for our disposable sensors. For preconcentration duration longer than 10 min with larger current, the Cu AE film may be oxidized completely. In this case the sensor will no longer function as a three-electrode system. This issue could be relieved by depositing a thicker layer of Cu or designing a larger AE. With more sacrificial Cu for oxidation, the stable flat region can be extended to over 1 h, depending on film thickness (Figure 2b). If more robust electrodes are still needed (e.g., for applications with more acidic electrolyte or longer preconcentration time for lower LOD), the electrode could be formed from a thicker layer of Cu. Alternatively, it could be coated by a more-polarizable metal such as palladium (Pd), but this would complicate the fabrication procedure. Having established that the Cu AE is capable of supporting current for the duration sufficient for rapid analysis, we next examined the electrochemical performance of the Cu/CuCl2 RE.
Cu/CuCl2 Reference Electrode
We used CV to evaluate the Cu/CuCl2 RE of our Cu-based sensor and compare it with the commonly used Ag/AgCl RE. CVs were performed in acetate buffer (0.1 M, pH 6) spiked with 10 mM Zn to indicate the position of the stripping peak. We used two sensors for these experiments, one with an integrated Ag/AgCl RE and one with the new Cu/CuCl2 RE. As results in Figure 3 illustrate, the Zn stripping peak on a Cu WE occurs at −970 mV vs Ag/AgCl but shifts more positively to −910 mV for sensors using Cu/CuCl2 RE. The 60 mV difference in peak potential due to differences in RE half-cell potentials is not significant. Overall, the performance of Cu/CuCl2 RE in CV analysis appears to be comparable to sensors with Ag/AgCl RE. In the next set of experiments, we examined stability of the Cu/CuCl2 RE.
Figure 3.
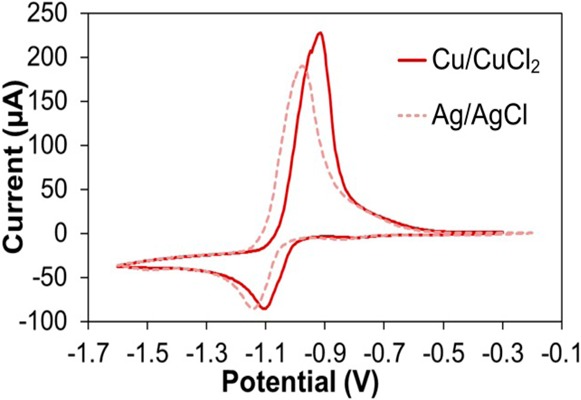
Cyclic voltammetry performed with Cu/CuCl2 (solid) or Ag/AgCl (dashed) as RE, in acetate buffer (0.1 M, pH 6) with 10 mM Zn. Scan rate = 100 mV/s.
To access stability of the Cu/CuCl2 RE, we examined the open circuit potential against a commercially available double-junction Ag/AgCl RE (MI-401F, Microelectrodes Inc.) in saturated KCl solution (4.6 M at 20 °C) to accelerate electrode aging (see the Supporting Information).23 The drift of the Cu/CuCl2 RE is quite large compared to other microscale Ag/AgCl RE electrodes reported in the literature,24−26 but our fabrication procedures, materials, and electrode structure are more advantageous. Thus, additional comparison of the Cu/CuCl2 and Ag/AgCl REs in our sensor is needed before a conclusion can be reached.
Next, and more importantly, we tested performance of the integrated Cu/CuCl2 and Ag/AgCl REs in practical samples by examining their open circuit potentials against the commercial Ag/AgCl RE in acetate buffer (0.1 M, pH 6). To simulate the working environment of our integrated REs in the buffer, no additional Cl– was introduced (except for the minute amount of impurity in NaOH used to adjust pH and any Cl– resulting from the dissolution of CuCl2 and AgCl from the surfaces of the reference electrodes), so both the REs were unpoised and examined directly. The potential difference between the integrated Cu/CuCl2 and the commercial Ag/AgCl REs was −59 ± 3 mV, while the difference between the integrated and commercial Ag/AgCl RE was −36 ± 6 mV (Figure 4a). The Cu/CuCl2 RE exhibited a short ∼28 s response time in stabilizing the potential difference, which was faster than the 46 s observed for the Ag/AgCl RE. This difference in the response time may be due to differences in solubility of CuCl2 and AgCl, which suggests that measurements in the Cu-based electrochemical cell can be performed soon after introducing the sample and does not require a 46 s wait period for stabilization as is the case with the Ag/AgCl RE. The more convenient fabrication process combined with its acceptable stability in buffer makes the integrated Cu/CuCl2 RE an attractive option for this sensor compared to the conventional Ag/AgCl reference electrode.
Figure 4.
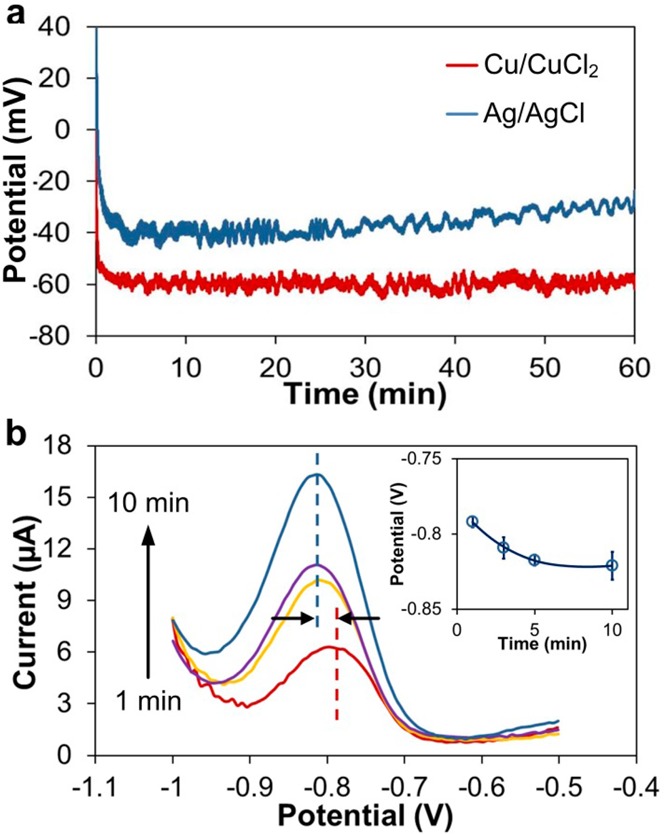
Stability of Cu/CuCl2 reference electrode. (a) Potential of integrated Cu/CuCl2 and Ag/AgCl electrodes in acetate buffer (0.1 M, pH 6) vs commercial (double junction) Ag/AgCl electrode. Each curve is an average of n = 3. (b) ASV of 10 μM Zn in the acetate buffer (0.1 M, pH 6) with increasing duration of preconcentration. The Zn peak is at −809 ± 8.5 mV. The inset illustrates potential of Zn anodic stripping peak vs preconcentration time (n = 3).
To assess stability of the Cu/CuCl2 RE in stripping analysis, we performed ASV on samples containing 10 μM Zn in acetate buffer (0.1 M, pH 6) with preconcentration times ranging from 1 to 10 min. The potential of the resulting Zn peaks (Figure 4b) shifted from −792 to −821 mV, with an increase in the preconcentration time. The average potential of the Zn peaks was −809 ± 8.5 mV, while the peaks slowly drifted at a rate of −2.9 mV/min (inset in Figure 4b). While these results suggest that the Cu/CuCl2 RE is not perfectly stable, this shift does not actually affect our application since we are measuring the amplitude of Zn peak current and the Zn peak potentials do not exhibit direct correlations to the peak amplitudes. For our target sample matrix, which is blood serum, trace metals that exhibit stripping peaks in the potential range of interest are present in blood (Mn and Cd) and could interfere with Zn determination. Other metals present in serum, such as Pb strip at potentials that are substantially more positive than Zn and are not expected to interfere. The Cd and Mn peaks are expected to occur at ∼400 mV more positive and ∼200 mV more negative than Zn, respectively. These stripping peaks however are absent from the voltammograms in our study. Another metal, Cr, is present in trace levels in blood, at approximately 77–500 nM (or 3.6–27 ppb).27 These trace levels are at the LOD of our sensor, and thus any presence in the sample would lead to a minute peak that would not severely affect Zn stripping. Having established that Cu-based auxiliary and reference electrodes are possible, we focused on determining if Cu can be used as a working electrode for ASV.
Cu Working Electrode
Copper has never, to our knowledge, been used as a pure, solid metal working electrode to perform stripping voltammetry, though some previous research has explored using Cu amalgam drop or solid electrode for the determination of trace metals,28,29 and thus its potential window is not known. As the first step in evaluating the Cu WE, we compared it with commonly used Au WE and Bi WE we used in the past,15,16 using a standard three-electrode system (Ag/AgCl RE and external Pt AE). Figure 5a shows the results for CV in the acetate buffer (0.1 M, pH 4.65), illustrating the negative potential working range of the three electrodes. The positive end of the working range of the Cu electrode extends to its oxidation potential of ∼0 V, which is more positive than the stripping potential of Bi. The significant increase in current at negative potentials indicates reduction of water, which leads to degradation of the electrode and gas evolution at the AE. The negative end of the working range of the Cu WE extends to approximately −0.95 V, which is between that of Au and Bi WEs. Despite the water reduction starting at −1.1 V, the potential window of Cu is still sufficiently wide for determination of Zn, offering a 130–190 mV window for Zn predeposition. The actual potential for the Zn peak still depends on the choice of REs.
Figure 5.
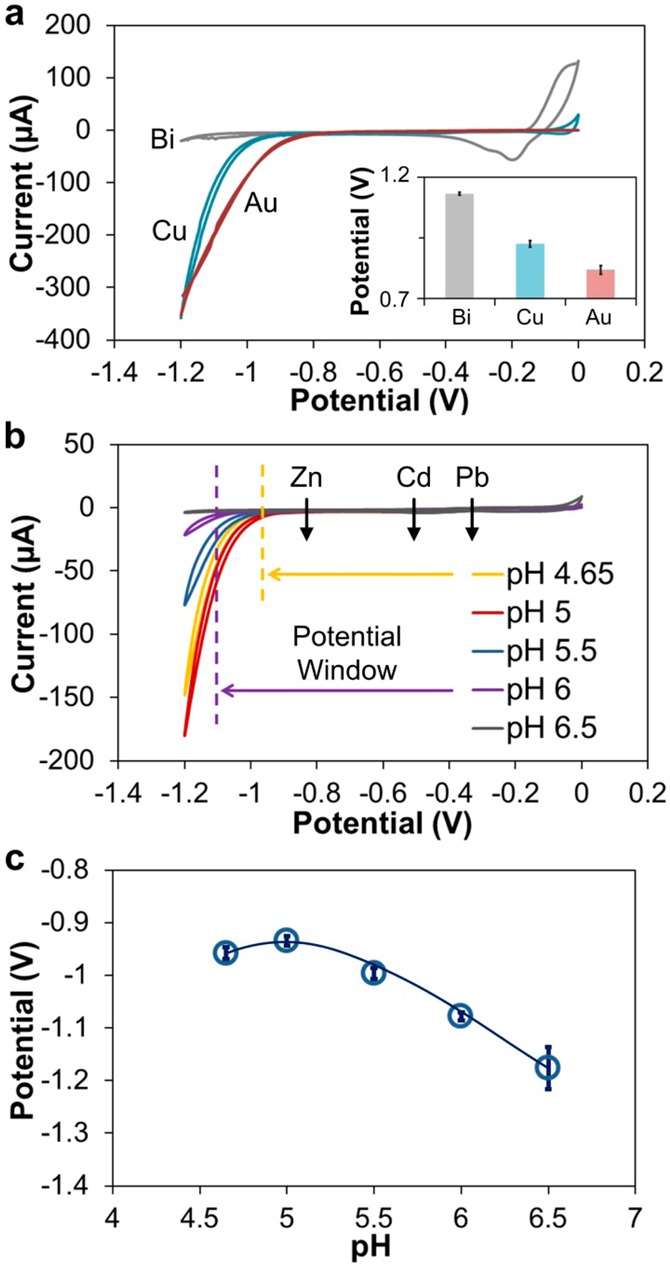
(a) Cyclic voltammetry of different WE materials in the acetate buffer (0.1 M, pH 4.65) with commercial Ag/AgCl (double junction) RE and Pt AE. Scan rate = 100 mV/s. Inset illustrates threshold potentials (i = 10 μA) of different WE materials (n = 3). (b) Cyclic voltammetry of Cu-based sensor in the acetate buffer (0.1 M) at different pH. Scan rate was 100 mV/s. (c) The threshold potential (i = 4 μA) at different pH (n = 3).
The inset of Figure 5a compares the negative potential limits of the three electrodes at 10 μA threshold current, which is typical of ASV analysis. With the Zn stripping peak at −0.8 V, the potential limit of the Cu film is sufficiently negative to make it a suitable electrode material. The potential limit of Bi is −1.2 V. While the Zn stripping peak on the evaporated Bi WE shifts to approximately −1.1 V, Bi is also suitable. Gold, with the least negative potential limit of −0.8 V, does not have the range for Zn detection, as substantial increase in current due to reduction of water drowns the Zn stripping signal. As our analysis of the potential window shows, the Cu WE offers a sufficiently negative range for determination of Zn (and other trace metals with less negative stripping potentials, such as Pb and Cd), without exhibiting too much H+ reduction.
To further explore the electrochemical characteristics of the Cu-based sensor, we investigated the effect of buffer pH on the potential window of the Cu electrode. CV analysis was performed in 0.1 M acetate buffers with pHs in the 4.65–6.5 range. As results in Figure 5b show, the potential window of the sensor expands negatively as pH approaches neutral values, due to decrease in H+/water reduction current with decreased concentration of H+ in the solution as expected. Dependence of the potential window of the Cu WE can be seen in Figure 5c, which plots the negative potential limits for each pH at a threshold current of 4 μA, which is the maximum current at pH 6.5. For acetate buffer with pH < 4.65, water electrolysis begins at a more positive potential than the Zn stripping peak. For buffer with pH > 6.5, Zn2+ forms hydroxides,30 which affects the actual free ion concentration in the solution, and mass transport to the electrode surface to deposit Zn atoms, leading to large variability. Thus, for anodic stripping voltammetry, buffer with a more acidic pH is preferably selected to prevent precipitation of metal hydroxides, especially for Pb or Cd which tend to form less soluble hydroxides than Zn. Compared with the Bi WE, the potential window of the Cu-based sensor is smaller but is sufficiently negative to permit determination of trace metals such as Zn, Cd, or Pb.
ASV in Acetate Buffer
Following optimization of experimental and stripping waveform parameters (see the Supporting Information), a calibration curve was constructed by performing ASV in 100 μL of acetate buffer (0.1 M, pH 6) with Zn spiked from 100 nM to 40 μM, as shown in Figure 6. This range brackets the physiological range of Zn in blood (10–15 μM), while illustrating that the LOD of the sensor allows for multifold dilution, if necessary. We used the optimized square wave ASV (SWASV) parameters, as discussed in Supporting Information. For most concentrations, we repeated experiments three times (n = 3), using a new disposable device each time to obtain standard deviation. Representative stripping voltammograms over the entire concentration range from 100 nM to 40 μM are shown in Figure 6a.
Figure 6.
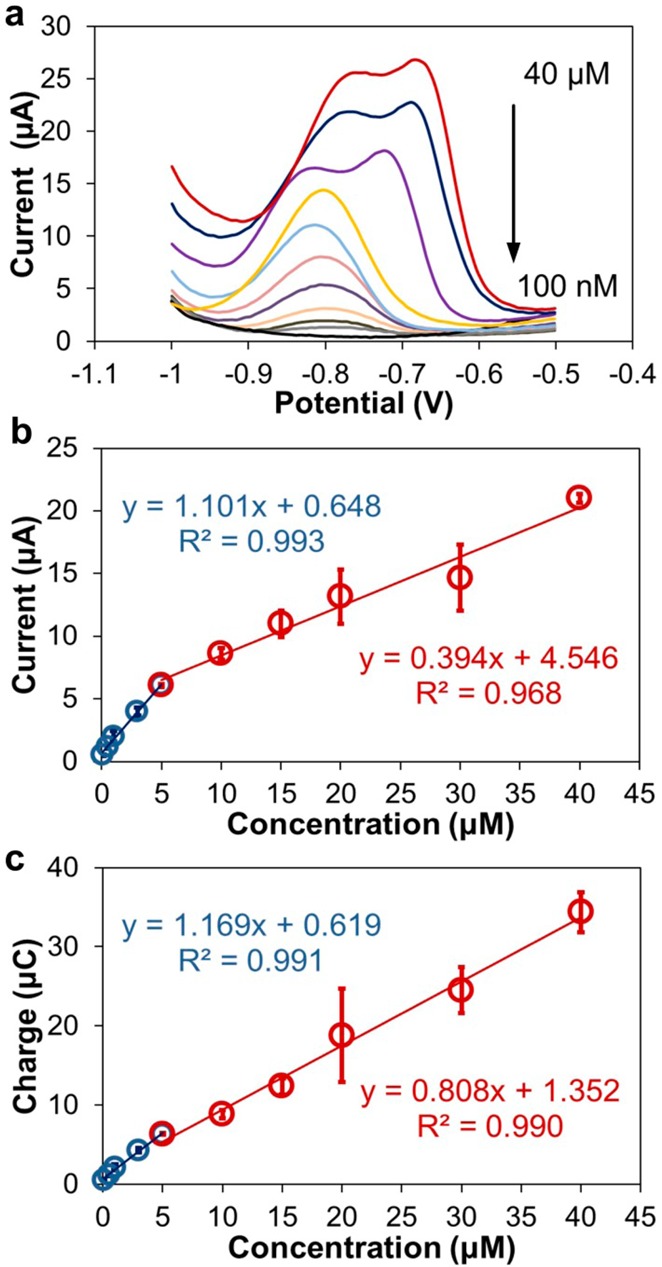
ASV of Zn samples in (a) a range from 100 nM to 40 μM range. Calibration curves for Zn using (b) peak height and (c) peak area of stripping voltammograms. Experiments performed in acetate buffer (0.1 M, pH 6, 100 μL sample volume).
The resulting calibration curves appeared to be bimodal (Figure 6b), with each segment exhibiting strong linearity. The correlation equation is I (μA) = 1.101 × [Zn (μM)] + 0.648 (R2 = 0.993 for 5 data points) for the concentrations below 5 μM, and I (μA) = 0.394 × [Zn (μM)] + 4.546 (R2 = 0.968 for 6 data points) for the concentrations above 5 μM. The calibration plot in the lower range (<5 μM) exhibited higher sensitivity (1.1 μA/μM). For 100 nM, which was the lowest Zn concentration sample, an n = 7 was used to calculate the detection limit LOD = 140 nM (9.0 ppb) based on 3σ/slope. Compared with the Bi sensor we reported previously,16 the calculated LOD of the Cu-based sensor for Zn determination is close, but we were able to experimentally measure much lower Zn concentration (100 nM vs 1 μM). Kefala31 and Demetriades32 also reported much lower detection limits for Zn using bi-coated glassy carbon electrodes or pencil-lead graphite (6 nM or 0.4 ppb), but the inability to microfabricate these electrodes has prevented their use in point-of-care applications. The lower linear range (<5 μM) is below the physiological range of 10–15 μM. This is important since dilution is unavoidable during serum extraction, and the performance of sensors with extracted samples is not as good as that in the buffer, as we discuss below. For the Cu-based sensor, the linear range brackets the physiological range of 10–15 μM Zn in serum with a dilution factor of 3–100×.
We also investigated higher concentrations of Zn from 5–40 μM for complete characterization. Double peaks appeared when concentration exceeded 20 μM, which is a common phenomenon on solid electrodes.33 We attribute this to the difference in stripping potential for Zn that has been deposited on a thin layer of Zn instead of on Cu WE at high concentrations, since the surface of the Cu WE becomes covered with a monolayer of Zn atoms before the deposition is complete. Thus, Zn will be stripped from different surfaces at different potentials, resulting in broadened or doubled stripping peaks. Specifically for voltammograms in the 20–40 μM range, we considered the left shoulder to be related to Zn stripped from the Zn surface, and the peak on the positive side to be attributed to Zn oxidized from the Cu surface. Therefore, we measured the peak height of positive peaks for the 20–40 μM range to plot the calibration curve (red in Figure 6b). As clearly seen from the result, the broad double peaks lead to an almost 3× loss of sensitivity (0.4 μA/μM). Considering the area under each peak (Figure 6c) instead of the peak height leads to improved linearity, but the calibration curve remains bimodal. Nevertheless, peak height is a much simpler measurement and is a good representation of the lower range for our sensor, which is of more importance in our application.
Analysis of Serum for Zn
A critical challenge to detection of Zn in serum is that two-thirds34 is bound by protein. Thus, direct measurement is not possible, since ASV only measures free metal ions,34 which requires Zn to be first released from protein and then be detected with our sensor by ASV. There are a number of options for pretreatments of serum for electrochemical trace metal detection. Digestion of serum is the easiest approach, and will break up proteins and release Zn sequestered within their structure. However, we found that the commercial product Metexchange35 originally developed for ASV detection of Pb, did not work for Zn, most likely due to higher binding affinity between Zn and protein.36 While the commonly used method of acidification by HCl to digest serum worked, the results were not impressive as only spiked samples could be measured and it was impossible to detect Zn in the original sample.15 Thus, a more complex approach that is able to extract metal ions from proteins and remove proteins by phase separation is needed. Herein, we use the extraction procedure with dithizone and trifluoroacetic acid that was reported by our collaborators, which achieves 92–95% recovery of Zn37 in serum by stripping voltammetry.
To demonstrate Zn determination in extracted serum, we used the standard addition approach. ASV was performed in the extracted serum diluted 2× with acetate buffer (0.1 M, pH 6), and samples spiked with additional 1 and 5 μM of Zn (Figure 7a) (n = 3). We used the same stripping parameters as in the buffer, except for double volume of 200 μL and preconcentration time of 600 s. Single, sharp peaks were observed in ASV voltammograms of three identical experiments for each sample, validating the stability and capability of Cu-based sensors for detecting Zn in extracted serum. The background currents for water reduction of the three concentrations overlapped, and the potentials of Zn stripping peaks were −831, −844, and −765 mV for the original and +1 and +5 μM samples, respectively. On the basis of our previous results using Bi WE and Ag/AgCl RE, the several orders of magnitude differences in the chloride concentration between acetate buffer with no chloride added and the serum extract would lead to a positive shift of the Zn peak of several hundred millivolts.16 However, the Zn peaks are at approximately the same position as in the buffer while deviating more from each other. The most likely reason for this is the stability of the Cu/CuCl2 RE. The absence of a large positive shift is due to the longer preconcentration time that will result in a negative shift of the Zn peak as discussed earlier during evaluation of the Cu/CuCl2 RE. The peak deviation shown in Figure 7a is related to the fact that CuCl2 is much more soluble than AgCl, with a ∼105 difference in their solubility.
Figure 7.
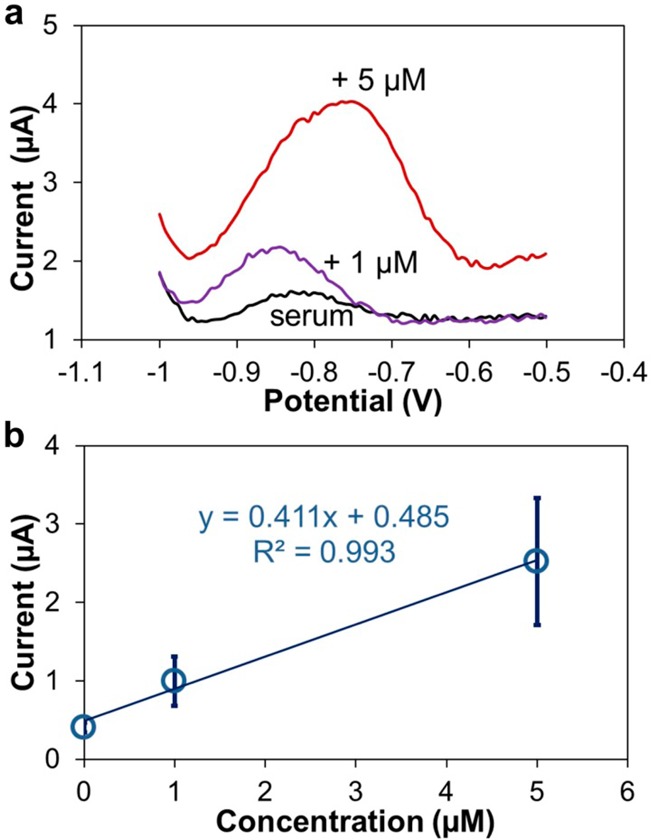
(a) ASV of the Zn extract from bovine serum with Zn additions. (b) Standard addition curve for measurement of Zn concentration.
We calculated the Zn concentration in the original serum extract using the standard addition curve (Figure 7b). The correlation equation I (μA) = 0.411 × [Zn(μM)] + 0.485 (R2 = 0.99 for 3 data points) indicates that sensitivity of the Cu-based sensor for Zn in extracted serum is nearly 3× lower than in the buffer. Considering the larger deviation of potentials and smaller peak amplitudes of Zn stripping peaks, the performance of the Cu WE in extracted serum is not as good as that in the buffer, which is attributed to a significantly higher complexity of serum as the sample matrix. We believe the majority of bound Zn ions were released from protein and organic ligands into the aqueous phase during the extraction procedure, since this technique achieves a high recovery. However, protein components can adsorb on the WE and interfere with the electrode process for Zn determination, which leads to decreased signal current and sensitivity. Nevertheless, we successfully determined the concentration of Zn in blood serum to be 14.8 ± 1.8 μM, using the Cu-based sensor. The same samples were tested in separate ASV experiments using the Bi WE sensor, leading to a comparable value of 12.8 ± 2.2 μM Zn.16 Our Cu-based sensor exhibited the ability to measure Zn at much lower concentrations than the ∼20 μM result reported previously by Kruusma et al.18 using boron-doped diamond or by Kumar et al.38 who used a hanging mercury drop electrode (HMDE) for measurements in the 49–63 μM range. ICP-MS techniques have been reported to detect Zn with a LOD = 61 nM (4.0 ppb) in whole blood or serum by Barany et al.39 Although our miniaturized Cu-based voltammetric sensors are unable to match the precision and limits of detection of modern spectroscopic and mass spectrometry techniques, the measurements that they are able to do are in the physiologically relevant range, and using low-cost materials with simple fabrication, which is more favorable for disposable sensors.
Conclusions
We developed the first Cu-based sensor for ASV and demonstrated the detection of Zn in buffer and extracted serum. Several features make this sensor ideally suited for POC applications. First, Cu is a low-cost electrode material compared to gold or platinum. Though Cu is not a commonly used material for electrochemical systems since it can easily oxidize, preconcentration in ASV helps to maintain the Cu WE in its original metallic state by applying a negative potential. We also demonstrated that the Cu-based sensor with a Cu/CuCl2 reference electrode was stable enough for ASV with a preconcentration time as long as 600 s. Thus, the Cu-based sensors are qualified to be the low-cost disposable sensors for POC instruments. Second, the microfabrication procedure of the Cu-based sensor is quite simple. Microfabrication offers the potential for mass production, which can further reduce the cost of the sensor. Simple fabrication also helps to reduce the variations among individual sensors, which is crucial for disposable applications. Third, Cu-based sensors offer competitive performance in electrochemical detection. By optimizing experimental parameters, the Cu-based sensor exhibits low LOD of 140 nM (9.0 ppb or 0.90 μg/dL), good sensitivity of more than 1 μA/μM, and good linearity in the range below 5 μM. In experiments with extracted serum samples, good quality peaks were observed that can be used to quantify the concentration of Zn using the standard addition approach.
On the other hand, there are also limitations for this sensor. Since the potential window is limited by the oxidation of Cu, Cu-based sensors could only detect those metals that reduce at more negative potentials such as Pb, Cd, and Zn, excluding metals which reduce at more positive potentials, such as As and Ag. A potential solution for this limitation is to electroplate another electrode material on top of Cu in order to extend the potential window without the high costs introduced by metal evaporation. The second limitation is that, compared to bismuth-coated carbon-based electrodes,40−45 the LOD of the Cu-based sensor is still high, although this could be explained by the considerably reduced sample volume and smaller working electrode area. Third, the behavior of sensors in serum extraction samples is still not favorable. The Cu-based sensor is not as robust as carbon-based electrodes in that its behavior is highly dependent on the chemicals used in the extraction procedure. Cu can react with some commonly used acids like sulfuric acid so the chemicals involved have to be well-controlled.
In the future, we envision initial applications in clinics or hospitals, with the test administered by nurses. In such an occupational setting simple sample preparation steps are acceptable. The current method of ASV, and the experimental settings described here are already more convenient, faster, and less expensive as compared to the conventional ICP-MS measurements where samples are sent to a central laboratory facility. However, we are planning to develop an on-chip sample processing system that would be integrated by microfluidics with the ASV technique as a good long-term solution to the sample preparation issue.
Acknowledgments
This work was supported by funds provided by the National Institutes of Health (NIH) awards R21ES019255 and R01ES022933.
Supporting Information Available
Discussion of stability of Cu/CuCl2 RE and the optimization of the experimental parameters (buffer pH, preconcentration potential, and time) and stripping waveform parameters to improve sensor performance (maximize stripping peak current and peak sharpness). This material is available free of charge via the Internet at http://pubs.acs.org.
Author Contributions
§ X.P. and W.K. contributed equally to this work.
The authors declare no competing financial interest.
Funding Statement
National Institutes of Health, United States
Supplementary Material
References
- Smith J.; Butrimovitz G.; Purdy W. Clin. Chem. 1979, 25, 1487–1491. [PubMed] [Google Scholar]
- Jenner G.; Longerich H.; Jackson S.; Fryer B. Chem. Geol. 1990, 83, 133–148. [Google Scholar]
- Vallee B. L.; Falchuk K. H. Physiol. Rev. 1993, 73, 79–118. [DOI] [PubMed] [Google Scholar]
- Tapiero H.; Tew K. D. Biomed. Pharmacother. 2003, 57, 399–411. [DOI] [PubMed] [Google Scholar]
- Wong H. R.; Cvijanovich N.; Allen G. L.; Lin R.; Anas N.; Meyer K.; Freishtat R. J.; Monaco M.; Odoms K.; Sakthivel B. Crit. Care Med. 2009, 37, 1558. [DOI] [PMC free article] [PubMed] [Google Scholar]
- Shanley T. P.; Cvijanovich N.; Lin R.; Allen G. L.; Thomas N. J.; Doctor A.; Kalyanaraman M.; Tofil N. M.; Penfil S.; Monaco M. Mol. Med. 2007, 13, 495. [DOI] [PMC free article] [PubMed] [Google Scholar]
- Cvijanovich N.; Shanley T. P.; Lin R.; Allen G. L.; Thomas N. J.; Checchia P.; Anas N.; Freishtat R. J.; Monaco M.; Odoms K. Physiol. Genomics 2008, 34, 127–134. [DOI] [PMC free article] [PubMed] [Google Scholar]
- Bhutta Z. A.; Bird S. M.; Black R. E.; Brown K. H.; Gardner J. M.; Hidayat A.; Khatun F.; Martorell R.; Ninh N. X.; Penny M. E. Am. J. Clin. Nutr. 2000, 72, 1516–1522. [DOI] [PubMed] [Google Scholar]
- Ruel M. T.; Rivera J. A.; Santizo M.; Lönnerdal B.; Brown K. H. Pediatrics 1997, 99, 808–813. [DOI] [PubMed] [Google Scholar]
- Sazawal S.; Black R. E.; Ramsan M.; Chwaya H. M.; Dutta A.; Dhingra U.; Stoltzfus R. J.; Othman M. K.; Kabole F. M. Lancet 2007, 369, 927–934. [DOI] [PubMed] [Google Scholar]
- Nations S.; Boyer P.; Love L.; Burritt M.; Butz J.; Wolfe G.; Hynan L.; Reisch J.; Trivedi J. Neurology 2008, 71, 639–643. [DOI] [PubMed] [Google Scholar]
- Cuajungco M. P.; Fagét K. Y. Brain Res. Rev. 2003, 41, 44–56. [DOI] [PubMed] [Google Scholar]
- Hotz C.; Peerson J. M.; Brown K. H. Am. J. Clin. Nutr. 2003, 78, 756–764. [DOI] [PubMed] [Google Scholar]
- Jothimuthu P.; Wilson R. A.; Herren J.; Haynes E. N.; Heineman W. R.; Papautsky I. Biomed. Microdevices 2011, 13, 695–703. [DOI] [PMC free article] [PubMed] [Google Scholar]
- Jothimuthu P.; Wilson R. A.; Herren J.; Pei X.; Kang W.; Daniels R.; Wong H.; Beyette F.; Heineman W. R.; Papautsky I. Electroanalysis 2013, 25, 401–407. [DOI] [PMC free article] [PubMed] [Google Scholar]
- Kang W.; Pei X.; Yue W.; Bange A.; Heineman W. R.; Papautsky I. Electroanalysis 2013, 25, 2586–2594. [DOI] [PMC free article] [PubMed] [Google Scholar]
- Ives D. J. G.; George J. J. In Reference Electrodes: Theory and Practice; Academic Press: Amsterdam, 1961; pp 322–392. [Google Scholar]
- Kruusma J.; Banks C. E.; Nei L.; Compton R. G. Anal. Chim. Acta 2004, 510, 85–90. [Google Scholar]
- Kruusma J.; Tomčík P.; Banks C. E.; Compton R. G. Electroanalysis 2004, 16, 852–859. [Google Scholar]
- Ghaedi M.; Shokrollahi A.; Niknam K.; Niknam E.; Derki S.; Soylak M. J. AOAC Int. 2009, 92, 907–913. [PubMed] [Google Scholar]
- Xia Y.; Whitesides G. M. Annu. Rev. Mater. Sci. 1998, 28, 153–184. [Google Scholar]
- Pei X.; Kang W.; Yue W.; Bange A.; Wong H. R.; Heineman W. R.; Papautsky I. Proc. SPIE 2012, 8251, 82510K-1–82510K-8. [Google Scholar]
- Suzuki H.; Hirakawa T.; Sasaki S.; Karube I. Sens. Actuators, B 1998, 46, 146–154. [Google Scholar]
- Matsumoto T.; Ohashi A.; Ito N. Anal. Chim. Acta 2002, 462, 253–259. [Google Scholar]
- Suzuki H.; Shiroishi H.; Sasaki S.; Karube I. Anal. Chem. 1999, 71, 5069–5075. [DOI] [PubMed] [Google Scholar]
- Polk B. J.; Stelzenmuller A.; Mijares G.; MacCrehan W.; Gaitan M. Sens. Actuators, B 2006, 114, 239–247. [Google Scholar]
- Genuis S. J.; Birkholz D.; Rodushkin I.; Beesoon S. Arch. Environ. Contam. Toxicol. 2011, 61, 344–357. [DOI] [PubMed] [Google Scholar]
- Yosypchuk B.; Novotný L. Talanta 2002, 56, 971–976. [DOI] [PubMed] [Google Scholar]
- Piech R.; Kubiak W. W. Electrochim. Acta 2007, 53, 584–589. [Google Scholar]
- Cotton F. A., Wilkinson G. In Advanced Inorganic Chemistry: A Comprehensive Text, 4th ed.; Wiley: Hoboken, NJ, 1980; pp 589–616. [Google Scholar]
- Kefala G.; Economou A.; Voulgaropoulos A. Analyst 2004, 129, 1082–1090. [DOI] [PubMed] [Google Scholar]
- Demetriades D.; Economou A.; Voulgaropoulos A. Anal. Chim. Acta 2004, 519, 167–172. [Google Scholar]
- Costa D. A.; Takeuchi R. M.; Santos A. L. Int. J. Electrochem. Sci. 2011, 6, 6410–6423. [Google Scholar]
- Hambidge K. M.; Krebs N. F. J. Nutr. 2007, 137, 1101–1105. [DOI] [PubMed] [Google Scholar]
- Roda S. M.; Greenland R.; Bornschein R.; Hammond P. Clin. Chem. 1988, 34, 563–567. [PubMed] [Google Scholar]
- Wang F.; Chmil C.; Pierce F.; Ganapathy K.; Gump B. B.; MacKenzie J. A.; Mechref Y.; Bendinskas K. J. Chromatogr., B 2013, 934, 26–33. [DOI] [PubMed] [Google Scholar]
- Yue W.; Bange A.; L Riehl B.; M Johnson J.; Papautsky I.; R Heineman W. Electroanalysis 2013, 25, 2259–2267. [DOI] [PMC free article] [PubMed] [Google Scholar]
- Kumar M. P.; Mouli P. C.; Reddy S. J.; Mohan S. V. Anal. Lett. 2005, 38, 463–475. [Google Scholar]
- Barany E.; Bergdahl I. A.; Schütz A.; Skerfving S.; Oskarsson A. J. Anal. At. Spectrom. 1997, 12, 1005–1009. [Google Scholar]
- Pauliukaitė R.; Brett C. Electroanalysis 2005, 17, 1354–1359. [Google Scholar]
- Cesarino I.; Gouveia-Caridade C.; Pauliukaitė R.; Cavalheiro E. T.; Brett C. Electroanalysis 2010, 22, 1437–1445. [Google Scholar]
- Granado Rico M. Á; Olivares-Marín M.; Gil E. P. Electroanalysis 2008, 20, 2608–2613. [Google Scholar]
- Rico M. Á G.; Olivares-Marín M.; Gil E. P. Talanta 2009, 80, 631–635. [DOI] [PubMed] [Google Scholar]
- Economou A.; Voulgaropoulos A. Electroanalysis 2010, 22, 1468–1475. [Google Scholar]
- Guo Z.; Feng F.; Hou Y.; Jaffrezic-Renault N. Talanta 2005, 65, 1052–1055. [DOI] [PubMed] [Google Scholar]
Associated Data
This section collects any data citations, data availability statements, or supplementary materials included in this article.


