

Abstract
Background
The clinical consequences of low health literacy are not fully understood.
Objectives
We evaluated the relationship between low health literacy and elevated blood pressure (BP) at hospital presentation.
Research Design and Subjects
We conducted a cross-sectional evaluation of adult patients hospitalized at a university hospital between November 1, 2010 and April 30, 2012.
Measures
Health literacy was assessed using the Brief Health Literacy Screen (BHLS). Low health literacy was defined as a BHLS score ≤9. BP was assessed using clinical measurements. The outcome was elevated BP (≥140/90 mmHg; ≥130/80 mmHg with diabetes or renal disease) or extremely elevated BP (>160/100 mmHg) at hospital presentation. Multivariate logistic regression adjusted for age, gender, race, insurance, comorbidities, and antihypertensive medications; pre-planned restricted analysis among patients with diagnosed hypertension was performed.
Results
Of 46,263 hospitalizations, 23% had low health literacy, which occurred more often among patients who were older (61 vs. 54 years), less educated (28.4% vs. 11.2% had not completed high school), and more often admitted through the emergency department (54.3% vs. 48.1%) than those with BHLS>9. Elevated BP was more frequent among those with low health literacy (40.0% versus 35.5%; adjusted Odds Ratio [aOR] 1.06, 95%CI 1.01, 1.12). Low health literacy was associated with extremely elevated BP (aOR 1.08, 95% CI 1.01, 1.16) and elevated BP among those without diagnosed hypertension (aOR 1.09, 95% CI 1.02, 1.16).
Conclusions
More than 1/3 of patients had elevated BP at hospital presentation. Low health literacy was independently associated with elevated BP, particularly among patients without diagnosed hypertension.
Keywords: health literacy, hospitalized patients, hypertension, blood pressure
INTRODUCTION
Undiagnosed and uncontrolled hypertension are at epidemic proportions in the United States.1–3 Efforts are ongoing to increase hypertension awareness, treatment, and control among adults, but the high prevalence of undiagnosed (22%) and uncontrolled (36%) hypertension remains a challenge.2,3 A prediction model demonstrated that for every 10% increase in hypertension treatment, 14,000 deaths are prevented annually among adults age 25–79 years.4 Hypertension treatment and control remains an important goal, although it may be challenging to achieve for the approximately 36% of adult Americans who have low health literacy, which is defined by difficulty obtaining, processing, and understanding basic health information and services needed to make appropriate health decisions.5,6
The Institute of Medicine (IOM) highlighted the need for additional epidemiologic studies to better understand the clinical consequences of inadequate health literacy.5 A number of studies have demonstrated that health literacy status independently predicts patients’ health-related knowledge,7–9 behaviors such as medication adherence,10 and self-reported health status.11 These factors are thought to be important in achieving important clinical outcomes. However, the relationship between literacy and patient-related outcomes (such as blood pressure) have been inconsistent, potentially due to measurement limitations and small sample sizes that limit the statistical power to examine clinically relevant endpoints.11 In particular, some studies have found that higher health literacy is associated with better blood pressure measurements and hypertension control.9,12 However, one study among veterans with hypertension found that higher health literacy was associated with worse blood pressure.13
To better understand the potential relationship between health literacy and the clinical outcome of elevated blood pressure, we evaluated the independent association between a measure of subjective health literacy, the Brief Health Literacy Screen (BHLS),14 and elevated blood pressure at the time of presentation to the hospital among a cohort of adult patients. We hypothesized that low health literacy would be associated with higher odds of elevated blood pressure at the time of initial evaluation for hospitalized patients.
METHODS
Study design and Data sources
As part of the Health Literacy Screening (HEALS) study,15 we conducted a cross-sectional evaluation of hospitalizations among adult patients between November 1, 2010 and April 30, 2012 at a large quaternary care hospital. This hospital receives more than 40,000 hospitalizations per year. All health literacy and blood pressure-related data were extracted from the medical center’s enterprise data warehouse and research derivative databases, where data from the electronic health record (EHR) are stored. The university’s Institutional Review Board approved this study.
Study sample
Each hospitalization during the study period was eligible if the patient was 18 years of age or older, date of birth and gender were present in the medical record, and the nursing admission intake documentation was completed. Inpatient and observation status hospitalizations were included. We excluded hospitalizations for pre–eclampsia or eclampsia (ICD9 CM 642.4–642.7) and alcohol withdrawal (ICD9 CM 291.0, 291.3, 291.4, 291.5, 291.81, 291.89, 291.9), which can influence both blood pressure at presentation and the ability to answer the health literacy screening questions. Hospitalizations were then excluded if the measure of health literacy was incomplete or if blood pressure measurements were missing.
Low health literacy
The primary exposure was subjective low health literacy, as measured by the sum of the three-item Brief Health Literacy Screen (BHLS).16 As part of the HEALS study, the hospital modified the nursing admission form to implement routine assessment of patient subjective health literacy and educational attainment. The implementation of this process is reported elsewhere.15 Briefly, the nurse who conducted the nursing admission intake verbally administered the three BHLS items and also recorded the patient’s highest level of education. The nursing admission intake is generally administered within the first 24 hours of hospitalization. The nurse could opt out of asking the BHLS questions if the patient could not answer the questions due to medical reasons such as intubation or altered mental status. The BHLS questions are: (1) How confident are you filling out medical forms by yourself? (2) How often do you have someone help you read hospital materials? and (3) How often do you have problems learning about your medical condition because of difficulty understanding written information? (Supplemental Table 1).14 Patient BHLS responses were recorded in the EHR on a 5-point response scale. Question (1) was reverse-coded, and the results of the three questions were summed to produce a score between 3 and 15 points, with higher scores indicating higher health literacy.
The BHLS correlates with objective measures of health literacy such as the Short Test of Functional Health Literacy in Adults (S-TOFHLA) and Rapid Estimate of Adult Literacy in Medicine (REALM).17–20 We previously demonstrated that nurse administration of the BHLS in this population is a valid measure of health literacy.21 Based on our work and other prior work,17,21 the response cutoff that optimized sensitivity and specificity for low health literacy defined on each question was ≤ 3 (“somewhat” or “some of the time”) on each 5-point response scale; summing the three items improved discriminatory efficacy (Area under receiver operating characteristic curve=0.71 [95% CI 0.65, 0.77]). Therefore, a summative BHLS score ≤ 9 was used to define low health literacy.
Blood Pressure
The primary outcome was elevated blood pressure defined as blood pressure ≥140/90 mmHg or ≥130/80 mmHg for patients with a history of diabetes or renal disease.1,22 Our primary outcome used the first measurement of blood pressure at the time of presentation to the hospital. This outcome was chosen because it was least likely to be distorted by interventions that occurred after arrival to hospital, such as administration of analgesics, antihypertensives, diuretics, or fluids. We also evaluated secondary outcomes including extremely elevated blood pressure (≥160/100 mmHg; dichotomous), elevated average blood pressure on the first calendar day of hospitalization (dichotomous), and systolic and diastolic blood pressure measurements (continuous). Average blood pressure was computed for the calendar date of hospitalization.
Each blood pressure measurement has a date and time stamp in the EHR. In order to determine the first blood pressure measured upon presentation to the hospital, we included the first blood pressure within the interval of 12 hours before to 6 hours after the date/time stamp of the hospital bed request. Thus, the first blood pressure measured by hospital staff was used for those patients directly admitted to the hospital from the outpatient setting, and the first blood pressure measured in the emergency department was used for patients hospitalized via the emergency department. Patients whose first recorded blood pressure may have been the following calendar day and had no blood pressure recorded on the date of hospitalization were not included in the sensitivity analysis evaluating mean blood pressure on the first day of hospitalization. For example if the patient was hospitalized on Jan 3, 2011 at 11:00PM, first blood pressure measured 1.5 hours later on January 4, 2011 00:30AM. This patient would have a first blood pressure recorded but no mean blood pressure to be calculated on the date of hospitalization. We filtered and rejected probable data entry errors in which the systolic blood pressure was > 400 mmHg, the diastolic blood pressure was < 10 mmHg, or the difference between systolic and diastolic blood pressure was < 10 mmHg, all of which are physiologically implausible.
Covariates
Covariates were chosen a priori based on clinical significance. These included age (continuous), gender, race (White, Black, or other), and insurance type (Medicare [referent], Medicaid, private, self-pay/unknown). We used ICD-9 CM coded diagnostic and procedure information to identify co-morbid conditions for inpatient and outpatient encounters.23 These co-morbid conditions included: cerebrovascular disease; coronary artery disease; heart failure; or history of organ transplantation. We used patient medication lists and the electronic prescription-writer from the EHR to identify prescriptions for antihypertensive medications within 365 days prior to and including the day of the index hospitalization. Antihypertensive medications included angiotensin-converting enzyme inhibitors (ACEI), angiotensin receptor blockers (ARB), thiazide diuretics, calcium channel blockers, beta blockers, alpha adrenergics, loop diuretics, central-acting or other antihypertensives (Supplemental Table 2).
Statistical Analysis
Hospitalization was used as the unit of analysis. Differences between hospitalizations for those with low health literacy and those with adequate health literacy were examined using Student’s t-test or the Chi squared test, as appropriate. We conducted multivariable logistic regression analyses to evaluate the association between low health literacy and elevated blood pressure at the time of hospital presentation, adjusting for age, gender, race, insurance type, co-morbid conditions, and prescribed antihypertensive medications. We used robust standard errors to account for patients who contributed multiple hospitalizations,24 as 30% of the cohort had a second qualifying hospitalization [range 2 to 28 hospitalizations] over the study duration. We report adjusted odds ratios (aOR) and 95% confidence intervals (CI). We also conducted multivariable linear regression between the first systolic blood pressure and BHLS adjusting for the above covariates and accounting for patients with multiple hospitalizations. Finally we conducted multivariable logistic regression analyses adjusting for the above covariates to evaluate the association between low health literacy and extremely elevated blood pressure or elevated average blood pressure on the first calendar day of hospitalization.
Sensitivity and Subgroup analyses
Adjusting for the covariates described above, we performed patient-level analysis using multivariable logistic regression, including only the index hospitalization and thus the first BHLS administration. We also performed pre-planned analyses stratified by: diagnosis of hypertension; diagnosis of diabetes or renal disease; age 65 years and older; educational level of 12th grade or higher; and hospitalization via the emergency department. All data analyses were performed using Stata version 12.0 (Stata Corp, College Station, Texas).
RESULTS
Study Flow
Between November 1, 2010 and April 30, 2012 there were 55,616 hospitalizations for 39,103 patients (Figure 1). Of these, 4,548 (8.2%) of hospitalizations were excluded because of missing a nursing admission form; an additional 397 hospitalizations were excluded for missing gender, age < 18 years, or the presence of a chief complaint of pre-eclampsia/eclampsia or alcohol withdrawal (0.7%). Another 4,171 (7.5%) hospitalizations with a completed nursing admission form, had missing or incomplete BHLS and were also excluded. Finally, 237 hospitalizations were excluded because they had no blood pressure measurements on the date of hospitalization or all available blood pressure measurements were filtered as probable data entry errors (0.5%). Thus, 46,263 hospitalizations were available for analyses. Of these, 10,564 (22.8%) hospitalizations occurred among patients with a BHLS ≤9 and were therefore categorized as having low health literacy.
Figure 1.
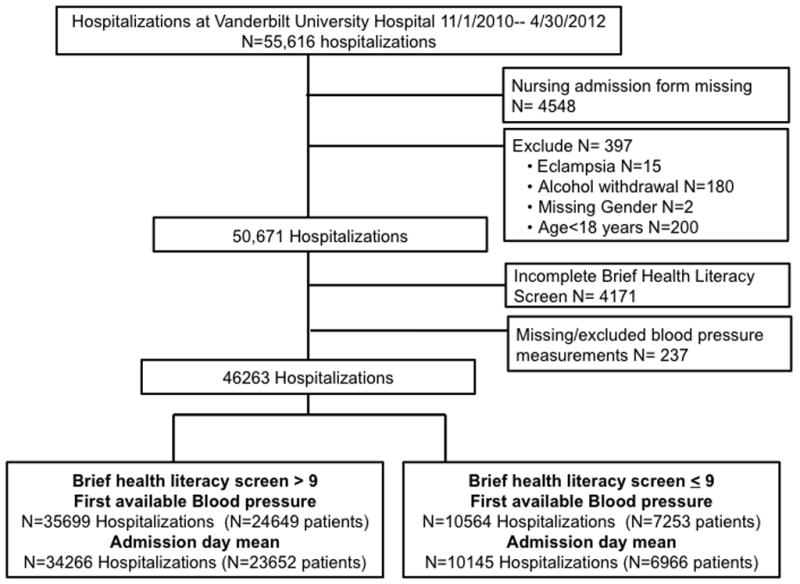
Selection of hospitalizations included in analyses
An average blood pressure for the first calendar day of hospitalization could be calculated for 96% of hospitalizations. A mean of 9 blood pressure measurements were utilized to calculate the average blood pressure for the first calendar day (median 5, interquartile range [IQR] 2, 11 among those with adequate health literacy, versus a median number of blood pressures of 6 [IQR 3, 12] among those with low health literacy).
Characteristics
Compared to hospitalizations for patients with a BHLS>9, hospitalizations for patients with low health literacy (BHLS ≤9) occurred among those who were older (61 vs. 54 years), reported lower education level (28.4% vs. 11.2% had not completed high school), and were more often hospitalized via the emergency department (54.3% vs. 48.1%). Hospitalizations for patients with low health literacy also were more likely to have chronic conditions, including hypertension (34.9% vs. 29.5%), diabetes (19.1% vs. 15.7%), or coronary artery disease (14.1% vs. 12.6%; Table 1). Hospitalizations excluded from the analysis for incomplete BHLS or missing blood pressure were older, had less co-morbidity, and were more often missing an assessment of education (Supplemental Table 3).
Table 1.
Patient characteristics at the time of hospitalization
| Adequate Health Literacy (BHLS>9) N=35,699 |
Low Health Literacy BHLS≤9 N=10,564 |
P value | |
|---|---|---|---|
| Number of hospitalizations, Median (IQR) | 1 (1, 2) | 1 (1, 2) | 0.007 |
| Age, median (IQR) | 54 (41, 65) | 61 (48, 74) | <0.001 |
| Sex, % | <0.001 | ||
| Male | 51.5 | 54.9 | |
| Female | 48.5 | 45.1 | |
| Race, % | <0.001 | ||
| White | 81.4 | 76.7 | |
| Black | 14.6 | 15.8 | |
| Other | 1.4 | 2.3 | |
| Missing race | 2.6 | 5.2 | |
| Insurance, % | <0.001 | ||
| Medicare | 32.0 | 47.3 | |
| Medicaid | 8.7 | 12.3 | |
| Private | 50.6 | 32.3 | |
| Self pay/ Unknown | 8.7 | 8.1 | |
| Education, % | <0.001 | ||
| <12th grade | 11.2 | 28.4 | |
| Completed high school or equivalent | 36.7 | 36.8 | |
| Less than 4 years post high school | 24.5 | 14.5 | |
| 4 or more years post high school | 21.6 | 9.6 | |
| Missing education | 6.0 | 10.7 | |
| Hospitalized via emergency department, % | 48.3 | 54.4 | <0.001 |
| Co-morbidities*, % | |||
| Hypertension | 29.5 | 34.9 | <0.001 |
| Diabetes Mellitus | 15.7 | 19.1 | <0.001 |
| Cerebrovascular disease | 1.4 | 2.6 | <0.001 |
| Coronary artery disease | 12.6 | 14.1 | <0.001 |
| Congestive heart failure | 3.2 | 2.7 | 0.002 |
| Cancer | 18.9 | 15.8 | <0.001 |
| Transplant | 4.4 | 3.9 | 0.011 |
| Renal Disease | 4.1 | 4.8 | <0.001 |
| Creatinine at admission (mg/dL), Median (IQR) | 0.87 (0.70, 1.14) | 0.91 (0.71, 1.25) | <0.001 |
| Missing creatinine, % | 14.1 | 9.5 | |
| Antihypertensives*, % | |||
| ACEI/ARB | 29.4 | 30.9 | 0.003 |
| Thiazide diuretics | 14.8 | 15.2 | 0.372 |
| Calcium channel blocker | 19.3 | 22.1 | <0.001 |
| Beta blocker | 28.3 | 31.7 | <0.001 |
| Alpha adrenergics | 1.6 | 1.8 | 0.126 |
| Loop diuretics | 19.0 | 22.0 | <0.001 |
| Central acting and other antihypertensives | 8.0 | 9.9 | <0.001 |
Definitions of Co-morbidities are available in Supplemental Table 2
Abbreviations: IQR, interquartile range; ACEI, angiotensin converting enzyme inhibitors; ARB, angiotensin receptor blockers
Outcomes: Elevated blood pressure at hospital presentation
Using the first blood pressure at hospital presentation, more hospitalizations for patients with low health literacy had an elevated blood pressure (≥140/90 mmHg, or ≥130/80 mmHg if diabetes/renal disease) compared to those with adequate health literacy (40% vs. 35.5% p<0.0001) (Supplemental Figure). Adjusting for demographics, co-morbidities, and antihypertensive categories and accounting for patient level clustering, the adjusted odds ratio (aOR) of an elevated blood pressure at hospital presentation was 1.06 (95% CI 1.01, 1.12) among those with a BHLS ≤9, compared to those with a BHLS >9 (Table 2). Figure 2 illustrates the fitted association between BHLS and first systolic blood pressure at the time of hospital presentation and demonstrates a steady decline in the blood pressure at hospital presentation with increasing BHLS scores.
Table 2.
Proportion of all hospitalizations and index hospitalizations (patient level analyses) with initial and mean elevated blood pressure readings; unadjusted and adjusted odds of elevated blood pressure (95% confidence intervals [CI]) by low health literacy
| All hospitalizations | First blood pressure | Mean blood pressure on first hospital day | ||
|---|---|---|---|---|
| Adequate Health Literacy (BHLS>9) N=35,699 |
Low Health Literacy (BHLS ≤9) N=10,564 |
Adequate Health Literacy (BHLS>9) N=34,266 |
Low Health Literacy (BHLS ≤9) N=10,145 |
|
| Elevated blood pressure (≥140/90 mmHg)* % | 35.5 | 40.0 | 27.5 | 28.7 |
| Unadjusted Odds Ratio (95% CI) † | Reference | 1.21 (1.16, 1.27) | Reference | 1.06 (1.01, 1.12) |
| Adjusted Odds Ratio (95%CI) ठ| Reference | 1.06 (1.01, 1.12) | Reference | 1.05 (0.99, 1.10) |
| Extremely elevated blood pressure (≥160/100 mmHg), % | 11.2 | 14.1 | 5.6 | 5.9 |
| Unadjusted Odds Ratio (95% CI) † | Reference | 1.30 (1.22, 1.39) | Reference | 1.06 (0.96, 1.17) |
| Adjusted Odds Ratio (95%CI) ठ| Reference | 1.08 (1.01, 1.16) | Reference | 1.06 (0.96, 1.17) |
| Systolic blood pressure, median (IQR) | 126 (111, 142) | 128 (112, 146) | 125 (113, 138) | 125 (113, 139) |
| Diastolic blood pressure, median (IQR) | 72 (62, 82) | 71 (61, 83) | 70 (62, 78) | 70 (62, 79) |
| Index hospitalization/patient analysis | N=24,649 | N=7,253 | N=23,652 | N=6,966 |
| Elevated blood pressure (≥140/90mmHg)*, % | 35.3 | 40.1 | 26.5 | 27.6 |
| Unadjusted Odds Ratio (95% CI) † | Reference | 1.23 (1.16, 1.30) | Reference | 1.05 (0.99, 1.12) |
| Adjusted Odds Ratio (95%CI) ‡|| | Reference | 1.08 (1.02, 1.15) | Reference | 1.04 (0.98, 1.11) |
| Extremely elevated blood pressure (≥160/100 mmHg), % | 11.3 | 14.4 | 5.5 | 5.9 |
| Unadjusted Odds Ratio (95% CI) † | Reference | 1.31 (1.21, 1.42) | Reference | 1.07 (0.96, 1.20) |
| Adjusted Odds Ratio (95%CI) ‡|| | Reference | 1.08 (1.00, 1.18) | Reference | 1.08 (0.96, 1.22) |
| Systolic blood pressure, median (IQR) | 126 (111, 143) | 129 (112, 147) | 125 (113, 138) | 125 (113, 139) |
| Diastolic blood pressure, median (IQR) | 72 (62, 82) | 72 (61, 83) | 70 (62, 78) | 70 (62, 79) |
Blood pressure threshold set at ≥130/80 mmHg for patients with diabetes or renal disease
Robust standard errors used to account for patients who contributed multiple hospitalizations
Logistic regression model with robust standard errors used to account for patients who contributed multiple hospitalizations evaluating the odds of a blood pressure ≥140/90 mmHg (or ≥130/80 mmHg if a known diagnosis of renal disease or diabetes) by low health literacy status adjusted for: age, gender, race, insurance category (Medicare referent), coronary artery disease, cerebrovascular disease, congestive heart failure, transplant status and type of antihypertensive categories prescribed (see Supplemental Table 2).
1486 hospitalizations dropped from model for missing race in first blood pressure analysis; 1417 observations dropped from the mean blood pressure analysis, as described in Methods.
1287 patients dropped from model for missing race in first blood pressure analysis; 1228 patients dropped from the mean blood pressure analysis, as described in Methods
Figure 2.

Fitted systolic blood pressure, by brief health literacy screen among hospitalized patients*
*Linear regression model with robust standard errors to account for patients who contributed multiple hospitalizations, adjusted for: age, gender, race, insurance category (Medicare referent), coronary artery disease, cerebrovascular disease, congestive heart failure, transplant status and antihypertensive categories used; figure generated using local polynomial smoothed line with confidence intervals.
A higher proportion of hospitalizations identified as low health literacy (BHLS ≤9) presented with extremely elevated blood pressure readings (≥160/100mmHg) compared to those with a BHLS >9 (14.1% vs.11.2%, aOR 1.08, 95% CI 1.01, 1.16). More hospitalizations with low health literacy were also classified as having an elevated average blood pressure (28.7% vs. 27.5%) aOR 1.05 (95% CI 0.99, 1.10). (Table 2; Supplemental Figure)
Sensitivity and Subgroup Analyses
Including only index hospitalizations, low health literacy was associated with higher adjusted odds of elevated blood pressure at the time of hospitalization, aOR 1.08 (95% CI 1.02, 1.15) (Table 2). In the planned subgroup analysis of hospitalizations among patients without a known diagnosis of hypertension, low health literacy was independently associated with elevated blood pressure at the time of hospitalization. However, among hospitalizations for patients with a previous diagnosis of hypertension, we found no relationship of health literacy with blood pressure in adjusted analyses (Table 3). Similar effect modification was present in the relationship of health literacy with blood pressure elevation based on whether the hospitalization was among those with previous diagnosis of diabetes, and patient age (Table 3). The adjusted odds of having elevated blood pressure at the time of presentation were lower with low health literacy among hospitalizations that presented via the emergency department (aOR 0.90, 95% CI 0.84, 0.96). There was no evident association between low health literacy and average blood pressure on the first calendar day of hospitalization, after patients received medical care.
Table 3.
Subgroup analysis by comorbid conditions, age, education level, and origin of hospitalization: Proportion with elevated initial blood pressure, mean blood pressure, systolic, and diastolic blood pressure by adequate versus low health literacy
| Subgroups | First blood pressure | Mean blood pressure on first hospital day | ||
|---|---|---|---|---|
|
| ||||
| Adequate Health Literacy (BHLS>9) | Low Health Literacy (BHLS ≤9) | Adequate Health Literacy (BHLS>9) | Low Health Literacy (BHLS ≤9) | |
| Diagnosed Hypertension | N=10,519 | N=3,687 | N=10,109 | N=3,562 |
| Blood pressure ≥140/90mmHg* % | 46.6 | 49.0 | 32.5 | 33.1 |
| Unadjusted Odds Ratio (95% CI) † | Reference | 1.10 (1.02, 1.20) | Reference | 1.03 (0.94, 1.12) |
| Adjusted Odds Ratio (95%CI) ‡ | Reference | 1.00 (0.92, 1.09) | Reference | 1.01 (0.93, 1.10) |
| Systolic blood pressure, median (IQR) | 130 (114, 149) | 132 (114, 151) | 126 (114, 139) | 125 (113, 139) |
| Diastolic blood pressure, median (IQR) | 73 (62, 84) | 71 (60, 83) | 70 (63, 79) | 70 (62, 78) |
| No Diagnosis of Hypertension | N=25,180 | N=6,877 | N=24,157 | N=6,583 |
| Blood pressure ≥140/90mmHg* % | 30.9 | 35.1 | 25.3 | 26.3 |
| Unadjusted Odds Ratio (95% CI) † | Reference | 1.21 (1.14, 1.28) | Reference | 1.05 (0.99, 1.12) |
| Adjusted Odds Ratio (95%CI) ‡ | Reference | 1.09 (1.02, 1.16) | Reference | 1.06 (0.99, 1.13) |
| Systolic blood pressure, median (IQR) | 124 (110, 140) | 126 (111, 143) | 125 (113, 138) | 125 (113, 139) |
| Diastolic blood pressure, median (IQR) | 71 (62, 82) | 71 (62, 82) | 70 (62, 78) | 70 (62, 79) |
|
| ||||
| Diabetes or Renal Disease | N =6,426 | N=2,255 | N=6,174 | N=2,174 |
| Blood pressure ≥130/80mmHg, % | 58.1 | 58.5 | 44.2 | 45.5 |
| Unadjusted Odds Ratio (95% CI) † | Reference | 1.01 (0.91, 1.13) | Reference | 1.05 (0.95, 1.16) |
| Adjusted Odds Ratio (95%CI) ‡ | Reference | 0.96 (0.86, 1.07) | Reference | 1.05 (0.94, 1.17) |
| Systolic blood pressure, median (IQR) | 131 (115, 148) | 132 (114, 150) | 125 (113, 139) | 125 (112, 140) |
| Diastolic blood pressure, median (IQR) | 72 (62, 83) | 70 (59, 82) | 70 (62, 79) | 70 (62, 78) |
| No Diabetes or renal disease | N=29,273 | N=8,309 | N=28,092 | N=7,971 |
| Blood pressure ≥140/90mmHg, % | 30.6 | 34.9 | 23.8 | 24.1 |
| Unadjusted Odds Ratio (95% CI) † | Reference | 1.22 (1.15, 1.29) | Reference | 1.02 (0.96, 1.08) |
| Adjusted Odds Ratio (95%CI) ‡ | Reference | 1.07 (1.01, 1.13) | Reference | 1.02 (0.95,1.08) |
| Systolic blood pressure, median (IQR) | 125 (111, 141) | 127 (111, 144) | 125 (113, 138) | 125 (113, 139) |
| Diastolic blood pressure, median (IQR) | 72 (62, 82) | 72 (62, 83) | 70 (62, 78) | 70 (62, 79) |
|
| ||||
| Age 65 years and older | N=9,621 | N=4,515 | N=9,226 | N=4,331 |
| Blood pressure ≥140/90mmHg* % | 40.3 | 45.9 | 28.3 | 29.4 |
| Unadjusted Odds Ratio (95% CI) † | Reference | 1.26 (1.17, 1.36) | Reference | 1.06 (0.97, 1.15) |
| Adjusted Odds Ratio (95%CI) ‡ | Reference | 1.11 (1.03, 1.20) | Reference | 1.02 (0.94, 1.11) |
| Systolic blood pressure, median (IQR) | 130 (112, 147) | 132 (114, 151) | 125 (113, 138) | 125 (113, 139) |
| Diastolic blood pressure, median (IQR) | 68 (58, 78) | 68 (58, 79) | 70 (62, 79) | 70 (62, 79) |
|
| ||||
| Age less than 65 years | N=26,078 | N=6,049 | N=25,040 | N=5,814 |
| Blood pressure ≥140/90mmHg* % | 33.8 | 35.5 | 27.2 | 28.1 |
| Unadjusted Odds Ratio (95% CI) † | Reference | 1.08 (1.01, 1.15) | Reference | 1.05 (0.98, 1.12) |
| Adjusted Odds Ratio (95%CI) ‡ | Reference | 1.00 (0.93, 1.06) | Reference | 1.06 (0.99, 1.13) |
| Systolic blood pressure, median (IQR) | 125 (111, 141) | 125 (110, 142) | 125 (113, 138) | 125 (113, 139) |
| Diastolic blood pressure, median (IQR) | 73 (64, 84) | 74 (64, 85) | 70 (63, 78) | 70 (62, 79) |
|
| ||||
| Education < 12th grade § | N=3988 | N=3001 | N=3827 | N=2885 |
| Blood pressure ≥140/90mmHg* (%) | 38.5 | 42.2 | 27.2 | 28.9 |
| Unadjusted Odds Ratio (95% CI) † | Reference | 1.16 (1.05, 1.29) | Reference | 1.06 (0.95, 1.18) |
| Adjusted Odds Ratio (95%CI) ‡ | Reference | 1.04 (0.93, 1.16) | Reference | 1.06 (0.94, 1.19) |
| Systolic blood pressure, median (IQR) | 127 (112, 145) | 130 (112, 147) | 125 (113, 138) | 125 (113, 139) |
| Diastolic blood pressure, median (IQR) | 72 (61, 83) | 72 (61, 83) | 70 (62, 78) | 70 (62, 78) |
| Education ≥ 12th grade | N=29580 | N=6436 | N=28384 | N=6176 |
| Blood pressure ≥140/90mmHg* % | 35.3 | 39.2 | 27.5 | 28.5 |
| Unadjusted Odds Ratio (95% CI) † | Reference | 1.18 (1.11, 1.25) | Reference | 1.05 (0.99, 1.12) |
| Adjusted Odds Ratio (95%CI) ‡ | Reference | 1.05 (0.99, 1.12) | Reference | 1.03 (0.97, 1.11) |
| Systolic blood pressure, median (IQR) | 126 (111, 142) | 128 (112, 145) | 125 (113, 138) | 125 (113, 138) |
| Diastolic blood pressure, median (IQR) | 72 (62, 82) | 71 (61, 82) | 70 (62, 78) | 70 (62, 79) |
|
| ||||
| Presented to the emergency department | N=17240 | N=5751 | N=16567 | N=5551 |
| Blood pressure ≥140/90mmHg* % | 44.7 | 46.0 | 28.6 | 30.1 |
| Unadjusted Odds Ratio (95% CI) † | Reference | 1.05 (0.99, 1.12) | Reference | 1.07 (1.00, 1.15) |
| Adjusted Odds Ratio (95%CI) ‡ | Reference | 0.90 (0.84, 0.96) | Reference | 1.04 (0.97, 1.12) |
| Systolic blood pressure, median (IQR) | 132 (116, 148) | 132 (114, 150) | 125 (113, 139) | 126 (113, 139) |
| Diastolic blood pressure, median (IQR) | 75 (65, 86) | 73 (62, 85) | 70 (63, 79) | 70 (62, 78) |
Elevated blood pressure defined as ≥130/80 for patients with diabetes or renal disease
Robust standard errors used to account for patients who contributed multiple hospitalizations
Logistic regression model evaluating the odds of a Blood pressure ≥140/90 mmHg (or ≥130/80 mmHg if renal or diabetes) by low health literacy status adjusted for: age, gender, race, insurance category (Medicare reference), coronary artery disease, cerebrovascular disease, congestive heart failure, transplant status and type of antihypertensive categories used (see Supplemental Table 2) with robust standard errors to account for patients who contributed multiple hospitalizations to the analyses.
Education level missing for 3,258 patients in first blood pressure analyses and 3,139 patients in mean blood pressure on day of hospitalization analyses.
DISCUSSION
In this cross sectional evaluation of a cohort of hospitalized patients with and without diagnosed hypertension, we found that low health literacy as measured by the nurse-administered Brief Health Literacy Screen (BHLS) was associated with elevated blood pressure at the time of hospital presentation. Hospitalizations among patients with low health literacy were associated with both elevated (≥140/90 mmHg) and extremely high blood pressure (≥160/100 mmHg), and this relationship was robust in sensitivity analysis restricted to index hospitalizations and among several subgroups. Interestingly our results demonstrate that among patients with low health literacy and a known diagnosis of hypertension, there was no association between health literacy and elevated blood pressure. However, among those patients without a known diagnosis of hypertension, low health literacy was associated with elevated blood pressure at the time of hospitalization. These findings raise concerns that low health literacy may contribute to the high prevalence of uncontrolled blood pressure in the United States, and moreover, may be associated with undiagnosed hypertension.
This is the first study, to our knowledge, to examine the clinical correlates of health literacy among hospitalized patients using a health literacy measure administered by nurses during the performance of their clinical duties. The scale of this work enables a more definitive assessment of the relationship between health literacy and blood pressure values, where smaller prior studies have had conflicting findings.25,26 Our results further advance the literature on the associations between health literacy and patient outcomes.27 Peterson and colleagues, who also utilized the BHLS, and Wu and colleagues found an association between low health literacy and mortality from congestive heart failure.28,29 Baker and colleagues demonstrated a relationship of health literacy with cardiovascular mortality.30 Schumacher and colleagues31 found that patients with low health literacy had fewer doctor office visits (OR 0.6, 95% CI 0.4–1.0), greater emergency department use, OR 1.6; 95% CI, 1.0–2.4), and had more potentially preventable hospital admissions (OR 1.7; 95% CI, 1.0–2.7) than those with adequate health literacy.
In this study we found that those with lower health literacy more often carry a formal diagnosis of hypertension and more often use antihypertensive treatments, but among those without a diagnosis of hypertension there is an increased odds of having a higher presenting blood pressure. This suggests that patients with low health literacy who are able to access the health care system and have a diagnosis of hypertension or prescribed treatment have no disparities in blood pressure control. However those with low health literacy may be less likely to be diagnosed with hypertension, whether due to difficulty accessing the health care system or lack of recognition once in the medical system. Undiagnosed and uncontrolled hypertension are known to be an important risk factor for cardiovascular disease and mortality in the U.S. and worldwide.3 This study contributes to possible explanatory mechanisms for these observed associations. Literacy may reflect the ability to seek out and access primary care healthcare, obtain follow-up for those conditions and/or comprehend written directions for medications and health information provided,32,33 which are all essential steps in management of one’s health. Our findings should encourage a more coordinated and systematic approach to hypertension care, regardless of the setting of care. In light of evidence that low health literacy is associated with preferential use of the emergency department,31 our findings raise the question: Should the emergency department play a more active role evaluating, diagnosing, or potentially managing chronic conditions? This strategy may be one mechanism to address barriers in care due to low health literacy.
There are limitations to this study. First, in examining the relationship between health literacy and health outcomes, we used blood pressure, which is an intermediary measure of cardiovascular health, not a distal outcome. However, poor blood pressure control is strongly linked with increased risk for cardiovascular and renal disease.34–36 Second, because hospital blood pressure may not accurately reflect outpatient blood pressure, we assessed blood pressure in two ways: upon first presentation to the hospital and the average of all blood pressures for the first calendar day of hospitalization. The average blood pressure may more accurately reflect a patient’s home blood pressure measurements. The average blood pressure, however, is often influenced by care given during the first day of hospitalization, including administration of antihypertensive medication or treatment of the condition for which the patient was hospitalized. Patients presenting with extremely elevated readings may also be more likely to have a medication administered and have additional blood pressure measurements recorded. Third, the BHLS is a subjective measure and was administered and recorded by clinical staff; it is probable that when BHLS was missing or incomplete, the information may not be “missing at random.” Supplemental Table 3 compares patients who were included in the analysis to those who were excluded for missing BHLS or blood pressure and supports this suggestion. Fourth, we excluded the <0.05% of hospitalizations for patients who presented to the hospital for eclampsia, acute stroke, and alcohol withdrawal because these conditions affect both blood pressure and the ability to accurately answer the health literacy questions. Our goal was to maximize generalizability of our findings, thus patients with conditions associated with lower blood pressure were not excluded if the nurse was able to administer the BHLS questions. Even within this heterogeneous patient population, we detected relationships between health literacy and elevated blood pressure. We utilized diagnosis codes in the prior year and the electronic prescription writer to identify co-morbid conditions and treatment for hypertension. This strategy is more likely to identify patients as having a condition who utilize this quaternary care center for their care. Therefore we may have misclassified some patients who did have a diagnosis of hypertension or diabetes as not having the disease. Finally because of the study design, we report associations between low health literacy and elevated blood pressure readings, rather than causation.
In conclusion, we report in a large sample of hospitalized adults that patients with low health literacy had 6% greater odds of elevated blood pressure at the time of presentation. Elevated blood pressure can lead to serious patient morbidity and mortality, including stroke, coronary heart disease, myocardial infarction, congestive heart failure, renal disease and death.1,2 Despite significant progress in hypertension awareness and control, approximately one third of patients had an elevated blood pressure at hospital presentation. Our findings should guide future work to address the potential relationships between health literacy and hypertension awareness, diagnosis, and control among this vulnerable population.
Supplementary Material
Supplemental Table 1: Brief Health Literacy Screen and Scoring
Supplemental Table 2: Definitions of co-morbidities and classification of medications
Supplemental Table 3: Characteristics of patients included in analysis versus those excluded for incomplete/missing Brief Health Literacy Screen or blood pressure
Proportion of patients with low and adequate health literacy that had an elevated or an extremely elevated blood pressure reading. First blood pressure at hospital presentation and average of all blood pressures for the first calendar day of hospitalization are reported.
*≥140/ 90 mmHg or ≥130/80 mmHg for patients with diabetes or renal disease
† ≥160/100 mmHg
Acknowledgments
Funding: This research was funded by award R21 HL096581 to Dr. Kripalani from the National Heart, Lung, and Blood Institute, and in part by grant UL1 RR024975-01 (now 2 UL1 TR000445-06 at the National Center for Advancing Translational Sciences). Dr. McNaughton was supported by the Vanderbilt Emergency Medicine Research Training Program (K12HL109019). Drs. Roumie and McNaughton had full access to all of the data in the study and take responsibility for the integrity of the data and the accuracy of the data analysis. The content is solely the responsibility of the authors and does not necessarily represent the official views of the NIH or the Department of Veterans Affairs.
Footnotes
Conflicts of Interest: Dr. Kripalani acknowledges acting as a consultant for PictureRx, LLC and Pfizer, Inc. Dr. McNaughton acknowledges acting as a consultant for Cornerstone Therapeutics, Inc.
Contributor Information
Candace D. McNaughton, Email: candace.mcnaughton@vanderbilt.edu, Department of Emergency Medicine, Vanderbilt University, 703 Oxford House, 1313 21st Ave S; Nashville, TN 37323; Phone: 615-936-0087; Fax: 615-936-1316.
Sunil Kripalani, Email: sunil.kripalani@vanderbilt.edu, Division of General Internal Medicine and Public Health, Department of Medicine and the Vanderbilt Center for Health Services Research Vanderbilt University; Suite 6000 Medical Center East, North Tower; Nashville, TN 37232-8300; Phone: 615-936-3525, Fax: (615) 936-1269.
Courtney Cawthon, Email: Courtney.cawthon@vanderbilt.edu, Vanderbilt Center for Health Services Research Vanderbilt University; Suite 6000 Medical Center East, North Tower; Nashville, TN 37232-8300; Phone: 615-936-1785 Fax: (615) 936-1269.
Lorraine C. Mion, Email: Lorraine.mion@vanderbilt.edu, School of Nursing, Vanderbilt University, Nashville, TN, 37240; Phone: 615-343-7098, Fax: (615) 343-5898.
Kenneth A. Wallston, Email: ken.wallston@vanderbilt.edu, School of Nursing, Vanderbilt University, Nashville, TN, 37240; Phone: (615) 343-3317, Fax: (615) 343-5898.
Christianne L. Roumie, Email: christianne.roumie@vanderbilt.edu, Division of General Internal Medicine and Public Health, Department of Medicine and Veterans Health Administration-Tennessee Valley Healthcare System Geriatric Research Education Clinical Center (GRECC); Nashville VA Medical Center, 1310 24th Ave South GRECC 4A120, Nashville TN 37212, Phone (615) 873-8013; Fax: (615) 936-6666.
References
- 1.Chobanian AV, Bakris GL, Black HR, et al. The Seventh Report of the Joint National Committee on Prevention, Detection, Evaluation, and Treatment of High Blood Pressure. JAMA. 2003;289:2560–72. doi: 10.1001/jama.289.19.2560. [DOI] [PubMed] [Google Scholar]
- 2.Go AS, Mozaffarian D, Roger VL, et al. Executive summary: Heart disease and stroke statistics--2013 update: a report from the American Heart Association. Circulation. 2013;127:143–52. doi: 10.1161/CIR.0b013e318282ab8f. [DOI] [PubMed] [Google Scholar]
- 3.Roger VL, Go AS, Lloyd-Jones DM, et al. Heart disease and stroke statistics--2012 update: a report from the American Heart Association. Circulation. 2012;125:e2–e220. doi: 10.1161/CIR.0b013e31823ac046. [DOI] [PMC free article] [PubMed] [Google Scholar]
- 4.Yoon S, Ostchega Y, Louis T. Recent trends in the prevalence of high blood pressure and its treatment and control, 1999–2008. NCHS Data Brief, No. 48. Hyattsville, MD: National Center for Health Statistics; 2010. [PubMed] [Google Scholar]
- 5.Institute of Medicine. Health Literacy. A Prescription to End Confusion. Washington, DC: National Academies Press; 2004. [PubMed] [Google Scholar]
- 6.Kutner M, Greenberg E, Jin Y, et al. The Health Literacy of America’s Adults: Results from the 2003 National Assessment of Adult Literacy (NCES 2006-483) Washington, DC: U.S. Department of Education, National Center for Education Statistics; 2006. [Google Scholar]
- 7.Gazmararian JA, Williams MV, Peel J, et al. Health literacy and knowledge of chronic disease. Patient Educ Couns. 2003;51:267–75. doi: 10.1016/s0738-3991(02)00239-2. [DOI] [PubMed] [Google Scholar]
- 8.Williams MV, Baker DW, Parker RM, et al. Relationship of functional health literacy to patients’ knowledge of their chronic disease: a study of patients with hypertension and diabetes. Arch Int Med. 1998;158:166. doi: 10.1001/archinte.158.2.166. [DOI] [PubMed] [Google Scholar]
- 9.Pandit AU, Tang JW, Bailey SC, et al. Education, literacy, and health: Mediating effects on hypertension knowledge and control. Patient Educ Couns. 2009;75:381–5. doi: 10.1016/j.pec.2009.04.006. [DOI] [PubMed] [Google Scholar]
- 10.Gazmararian JA, Kripalani S, Miller MJ, et al. Factors Associated with Medication Refill Adherence in Cardiovascular-related Diseases: A Focus on Health Literacy. J Gen Intern Med. 2006;21:1215–21. doi: 10.1111/j.1525-1497.2006.00591.x. [DOI] [PMC free article] [PubMed] [Google Scholar]
- 11.DeWalt DA, Berkman ND, Sheridan S, et al. Literacy and health outcomes: a systematic review of the literature. J Gen Intern Med. 2004;19:1129–39. doi: 10.1111/j.1525-1497.2004.40153.x. [DOI] [PMC free article] [PubMed] [Google Scholar]
- 12.Kripalani S, Litle H, Bengtzen R, et al. Association between literacy and hypertension control. J Gen Intern Med. 2006;21:16–7. [Google Scholar]
- 13.Powers B, Olsen M, Oddone E, et al. Literacy and blood pressure--do healthcare systems influence this relationship? A cross-sectional study. BMC Health Serv Res. 2008;8:219. doi: 10.1186/1472-6963-8-219. [DOI] [PMC free article] [PubMed] [Google Scholar]
- 14.Chew LD, Griffin JM, Partin MR, et al. Validation of screening questions for limited health literacy in a large VA outpatient population. Journal of General Internal Medicine. 2008;23:561–6. doi: 10.1007/s11606-008-0520-5. [DOI] [PMC free article] [PubMed] [Google Scholar]
- 15.Cawthon C, Mion L, Willens D, et al. Implementation of Routine Health Literacy Assessment in Hospital and Primary Care Patients. Jt Comm J Qual Patient Saf. doi: 10.1016/s1553-7250(14)40008-4. In press. [DOI] [PMC free article] [PubMed] [Google Scholar]
- 16.Chew LD, Griffin JM, Partin MR, et al. Validation of screening questions for limited health literacy in a large VA outpatient population. J Gen Intern Med. 2008;23:561–6. doi: 10.1007/s11606-008-0520-5. [DOI] [PMC free article] [PubMed] [Google Scholar]
- 17.Wallace LS, Cassada DC, Rogers ES, et al. Can screening items identify surgery patients at risk of limited health literacy? J Surg Res. 2007;140:208–13. doi: 10.1016/j.jss.2007.01.029. [DOI] [PubMed] [Google Scholar]
- 18.Wallace LS, Rogers ES, Roskos SE, et al. Screening Items to Identify Patients with Limited Health Literacy Skills. J Gen Intern Med. 2006;21:874–7. doi: 10.1111/j.1525-1497.2006.00532.x. [DOI] [PMC free article] [PubMed] [Google Scholar]
- 19.Chew LD, Bradley KA, Edward BJ. Brief Questions to Identify Patients With Inadequate Health Literacy. Fam Med. 2004;36:588–94. [PubMed] [Google Scholar]
- 20.Powers BJ, Trinh JV, Bosworth HB. Can this patient read and understand written health information? JAMA. 2010;304:76–84. doi: 10.1001/jama.2010.896. [DOI] [PubMed] [Google Scholar]
- 21.Wallston KA, Cawthon C, McNaughton CD, et al. Psychometric properties of the Brief Health Literacy Screen in clinical practice. J Gen Intern Med. 2013 doi: 10.1007/s11606-013-2568-0. [DOI] [PMC free article] [PubMed] [Google Scholar]
- 22.Standards of Medical Care in Diabetes--2011. Diabetes Care. 2010;34:S11–S61. doi: 10.2337/dc11-0174. [DOI] [PMC free article] [PubMed] [Google Scholar]
- 23.International Classification of Diseases, Ninth Revision, Clinical Modification. Washington, DC: Public Health Service, US Dept of Health and Human Services; 1988. [Google Scholar]
- 24.Zeger SL, Liang KY. Longitudinal data analysis for discrete and continuous outcomes. Biometrics. 1986:121–30. [PubMed] [Google Scholar]
- 25.Rothman RL, DeWalt DA, Malone R, et al. Influence of patient literacy on the effectiveness of a primary care-based diabetes disease management program. JAMA. 2004;292:1711–6. doi: 10.1001/jama.292.14.1711. [DOI] [PubMed] [Google Scholar]
- 26.Powers BJ, Olsen MK, Oddone EZ, et al. Literacy and blood pressure--do healthcare systems influence this relationship? A cross-sectional study. BMC Health Serv Res. 2008;8:219. doi: 10.1186/1472-6963-8-219. [DOI] [PMC free article] [PubMed] [Google Scholar]
- 27.Berkman ND, Sheridan SL, Donahue KE, et al. Low health literacy and health outcomes: an updated systematic review. Ann Intern Med. 2011;155:97–107. doi: 10.7326/0003-4819-155-2-201107190-00005. [DOI] [PubMed] [Google Scholar]
- 28.Peterson PN, Shetterly SM, Clarke CL, et al. Health literacy and outcomes among patients with heart failure. JAMA. 2011;305:1695–701. doi: 10.1001/jama.2011.512. [DOI] [PMC free article] [PubMed] [Google Scholar]
- 29.Wu JR, Holmes GM, Dewalt DA, et al. Low literacy is associated with increased risk of hospitalization and death among individuals with heart failure. J Gen Intern Med. 2013 doi: 10.1007/s11606-013-2394-4. [DOI] [PMC free article] [PubMed] [Google Scholar]
- 30.Baker DW, Wolf MS, Feinglass J, et al. Health literacy and mortality among elderly persons. Arch Intern Med. 2007;167:1503–9. doi: 10.1001/archinte.167.14.1503. [DOI] [PubMed] [Google Scholar]
- 31.Schumacher JR, Hall AG, Davis TC, et al. Potentially preventable use of emergency services: the role of low health literacy. Med Care. 2013;51:654–8. doi: 10.1097/MLR.0b013e3182992c5a. [DOI] [PMC free article] [PubMed] [Google Scholar]
- 32.Baker DW, Gazmararian JA, Williams MV, et al. Health literacy and use of outpatient physician services by Medicare managed care enrollees. J Gen Intern Med. 2004;19:215–20. doi: 10.1111/j.1525-1497.2004.21130.x. [DOI] [PMC free article] [PubMed] [Google Scholar]
- 33.Baker DW, Parker RM, Williams MV, et al. The relationship of patient reading ability to self-reported health and use of health services. Am J Pub Health. 1997;87:1027–30. doi: 10.2105/ajph.87.6.1027. [DOI] [PMC free article] [PubMed] [Google Scholar]
- 34.Vasan RS, Larson MG, Leip EP, et al. Impact of high-normal blood pressure on the risk of cardiovascular disease. N Engl J Med. 2001;345:1291–7. doi: 10.1056/NEJMoa003417. [DOI] [PubMed] [Google Scholar]
- 35.Benetos A, Thomas F, Bean K, et al. Prognostic value of systolic and diastolic blood pressure in treated hypertensive men. Arch Intern Med. 2002;162:577–81. doi: 10.1001/archinte.162.5.577. [DOI] [PubMed] [Google Scholar]
- 36.Benetos A, Thomas F, Safar ME, et al. Should diastolic and systolic blood pressure be considered for cardiovascular risk evaluation: a study in middle-aged men and women. J Am Coll Cardiol. 2001;37:163–8. doi: 10.1016/s0735-1097(00)01092-5. [DOI] [PubMed] [Google Scholar]
Associated Data
This section collects any data citations, data availability statements, or supplementary materials included in this article.
Supplementary Materials
Supplemental Table 1: Brief Health Literacy Screen and Scoring
Supplemental Table 2: Definitions of co-morbidities and classification of medications
Supplemental Table 3: Characteristics of patients included in analysis versus those excluded for incomplete/missing Brief Health Literacy Screen or blood pressure
Proportion of patients with low and adequate health literacy that had an elevated or an extremely elevated blood pressure reading. First blood pressure at hospital presentation and average of all blood pressures for the first calendar day of hospitalization are reported.
*≥140/ 90 mmHg or ≥130/80 mmHg for patients with diabetes or renal disease
† ≥160/100 mmHg