Abstract
Background
The National Lung Screening Trial (NLST) demonstrated that low-dose CT screening is an effective way of reducing lung cancer (LC) mortality. However, optimal screening strategies have not been determined yet and it is uncertain whether lighter smokers than those in NLST may also benefit from screening. To address these questions, it is necessary to first develop LC natural history models that can reproduce NLST outcomes and simulate screening programs at the population level.
Methods
Five independent LC screening models were developed using common inputs and calibration targets derived from NLST and the Prostate, Lung, Colorectal and Ovarian Cancer Screening Trial (PLCO). Imputation of missing smoking, histology and stage information for a small fraction of individuals and diagnosed LCs in both trials was performed. Models were calibrated to LC incidence, mortality or both outcomes simultaneously.
Results
Initially, all models were calibrated to NLST and validated against PLCO. Models validated well against PLCO individuals who would have been eligible to NLST. However, all models required further calibration to PLCO to adequately capture LC outcomes in PLCO never and light smokers. Final versions of all models produced incidence and mortality outcomes in the presence and absence of screening consistent with both trials.
Conclusions
We developed five distinct LC screening simulation models based on the evidence in NLST and PLCO. Our analyses demonstrate that NLST and PLCO have produced consistent results. The resulting models can be important tools to generate additional evidence to determine the effectiveness of low-dose CT lung cancer screening strategies.
Keywords: Lung cancer screening, cancer natural history models, smoking and lung cancer
Introduction
The National Lung Screening Trial (NLST) found a significant lung cancer (LC) mortality reduction in its low-dose computed tomography (CT) screening arm in comparison with its chest-radiography (CXR) screening arm1, suggesting that screening heavy smokers with low-dose CT can be effective in early detection of LC. Meanwhile, the Prostate Lung Colorectal and Ovarian Cancer Screening Trial (PLCO) found no statistical difference in LC mortality when comparing a no-screen control arm versus a chest radiography screening arm2. Consequently, several health policy groups have made recommendations endorsing low-dose CT LC screening based on the NLST entry criteria and LC screening programs are being established across the US3. However, there is still uncertainty about the optimal screening strategies, since the NLST evaluated only the impact of three consecutive annual screens among current- and former-smokers between the ages of 55 and 74 at enrollment with an exposure of at least 30-pack years and with no more than 15 years since quitting. It is unknown whether current- and former-smokers with lower levels of exposure would also benefit from screening. Furthermore, screening effectiveness may vary by gender, number of screens and periodicity. In the absence of results from other randomized control trials evaluating these questions, mathematical modeling of the natural history of LC may be the only approach to integrate available evidence and estimate the effectiveness and cost-effectiveness of different LC screening strategies in the general population3, 4.
Mathematical models of cancer natural history have been shown to be valuable in assessing and determining optimal cancer prevention and control strategies. Recent examples include analyses of the impact of tobacco control on LC mortality rates5, comparative studies assessing the effects of different screening modalities in colorectal cancer6, cost-effectiveness analyses of breast cancer screening strategies7, and studies evaluating the impact of PSA screening in reducing prostate cancer rates8, 9. All of these examples used a comparative modeling framework by which researchers across institutions can directly compare and contrast results from distinct models10–12. The conclusions arising from comparative modeling analyses are more robust and reliable than single-model studies and this approach has been cited as an example of Good Modeling Practices13.
To estimate the potential impact of LC screening at the US population level, a consortium of NCI-sponsored investigators, the Cancer Intervention and Surveillance Modeling Network (CISNET, www.cisnet.cancer.gov), developed five independent natural history models of LC and screening. Here we describe the models’ development and calibration approach to NLST and PLCO, the common shared-inputs and calibration targets, and the differences and similarities between models. We compare model predictions versus observed trial outcomes and highlight advantages and challenges of developing natural history models based on large-scale randomized controlled trials (RCTs).
Methods
Data
De-identified data from all NLST and PLCO participants were provided to CISNET after obtaining IRB approvals from each institution. These data included smoking history variables such as the age at the start of smoking, the average number of cigarettes smoked per day (CPDs), and the age at quitting for ex-smokers. Screening variables included the individual’s age at entry into the study, and, for screened-individuals, age at each screen, outcomes of each screen, and the follow-up procedures for positive screens. For each individual the age at death or censoring, and (if applicable) the cause of death were available. For individuals diagnosed with LC, the age at diagnosis, LC histology, and LC stage (AJCC 6th edition) were provided, as well as information about the screen associated with LC diagnosis for screen-detected cancers.
NLST
The NLST was a RCT that compared the impact of low-dose CT versus chest radiography (CXR) screening on LC mortality. From August 2002 through April 2004, 53,454 individuals aged 55–74 years were recruited; follow-up occurred through December 31, 2009. Entry criteria included a minimum exposure of 30 pack-years and no more than 15 years since quitting for ex-smokers. Individuals in both arms received up to three annual screens. The trial found a 20% LC mortality reduction in the low-dose CT versus the CXR arm1.
A small fraction of LCs (50 cases=2.4%) had missing histology and/or stage. To complete the missing data, a multi-step imputation procedure based on observed histology and stage distributions, tumor sizes, and expert opinion was conducted. Final analyses included data from 53,342 individuals, due to exclusion of 112 subjects who died or were diagnosed with lung cancer prior to the first screen (110), or with missing smoking information (age at start and/or time since quitting).
PLCO
The PLCO was a RCT that compared the impact of CXR screening (intervention arm) versus usual care (no-screening control arm) on LC mortality. The trial recruited 154,901 individuals aged 55–74 between November 1993 and July 2001. Participants were followed through December 31, 2009 or for 13 years from enrollment, whichever came first. No minimum smoking exposure was required to enroll. Individuals in the intervention arm received up to four annual CXR screens. The study found no difference in LC mortality between the intervention and control arm2. Contamination (CXR screening) in the control arm was limited (11% contamination rate2)
Additional smoking variables came from a supplemental questionnaire implemented towards the middle of the trial. Missing baseline data about the age at the start of smoking or CPDs for ever-smokers were imputed according to the corresponding US distributions by birth-cohort and age. Final analyses included data from 148,025 individuals, after exclusion of individuals with missing baseline smoking status or (if applicable) age at quitting.
Models
Models were developed by investigators at five institutions: Erasmus Medical Center (model E), Fred Hutchinson Cancer Research Center (model F), Massachusetts General Hospital (model M), University of Michigan (model U), and Stanford University (model S). The models were developed independently but the groups collaborated to develop common inputs and define standardized analyses.
Smoking-Dose Response Module
All models simulate individual LC natural history and include a dose-response module that translates personal cigarette exposure to LC risk. This smoking dose-response module can be used to simulate age-specific LC outcomes given an individual’s smoking history5. Model M uses as dose-response module a probabilistic LC risk model previously calibrated to SEER and US LC data14, 15 and recalibrated to NLST and PLCO, whereas all other groups use multistage carcinogenesis models 16–18. Both multistage 5, 16, 17, 19 and probabilistic models have been used extensively to investigate the effects of smoking on LC risk12, 20, 21. Model E uses a multistage model based on the Nurses’ Health Study (NHS) and Health Professionals’ Follow-up Study (HPFS)16. Model S uses a modified version of this model. Model U uses a LC multistage model by histology, also calibrated to the NHS/HPFS. Model F uses a multistage model calibrated to NLST and PLCO. Three models (F/M/U) use histology-specific smoking dose-response modules, and three models (E/F/M) recalibrated their smoking dose-response to NLST and PLCO. More details are given in Table 1. All models are capable of accommodating detailed individual-level smoking histories, including temporal factors such as age at start, age at cessation, and age-specific changes in CPDs. The variability across dose-response modules reflects the modelers’ judgment regarding the best available data and approaches to capture the complex relationship between smoking and LC. The NHS and HPFS are arguably the best prospective cohorts to investigate smoking-related LC. They have more than 30 and 20 years of follow-up, respectively, and collect smoking information every two years. However, their LC histology information is much less comprehensive than NLST’s and PLCO’s, and staging information was not available. NLST and PLCO are excellent data sources with thorough information about LC histology and staging, but have more limited follow-up and less extensive smoking data than NHS/HPFS. Also, NLST includes only ever-smokers and people in both arms were screened for LC. Half of PLCO was also screened.
Table 1.
Model Comparison
| Model E | Model F | Model U | Model M | Model S | |
|---|---|---|---|---|---|
| Central smoking dose-response model | Two-stage clonal expansion model (TSCE) | Longitudinal multistage observation by histology | Multistage clonal expansion model by histology | Probabilistic by histology | TSCE |
| Central dose-response parameter calibration | NHS/HPFS,SEER,NLST, PLCO | NLST,PLCO;PLuSS CT,CARET | NHS/HPFS | SEER,NLST,PLCO | NHS/HPFS |
| Histological types | Adenocarcinoma, squamous, small cell (SCLC), other non-small cell (ONSCLC) | Adenocarcinoma, large-cell, squamous, BAC, ONSCLC, SCLC | Adenocarcinoma, ONSCLC, SCLC | Adenocarcinoma, BAC, large-cell, squamous, SCLC, and other | Adenocarcinoma, large-cell, squamous, SCLC |
| LC stages | Ia,Ib,II,IIIa,IIIb,IV | Ia1,Ia2,Ib,II,IIIa,IIIb,IV | Ia1,Ia2,Ib,II,IIIa,IIIb,IV | Ia1,Ia2,Ib,II,IIIa,IIIb,IV | early (I–II), advanced (III–IV) |
| Stage progression model | Markov state-transition by histology | Based on tumor size and presence of metastasis | Markov state- transition by histology and gender; rates proportional to tumor size | Based on tumor volume and metastatic burden | Based on tumor volume and metastatic burden |
| LC survival | Based on SEER 17 2004–2008 survival | Based on NLST and PLCO | By gender, histology, stage and age at dx. Based on SEER 17 2004–2008 survival | Calibrated to SEER 17 1973–2008 survival | Based on SEER 17 1988–2003 survival |
| OCMortality | U.S. rates(NCI Smoking History Generator) | As observed in NLST and PLCO | Gompertz-model of OCM calibrated to each trial | Cox-model of OCM calibrated to each trial | Gompertz model of OCM based on NLST |
| Calibration method | Nelder-Mead optimization of likelihood-based deviance criterion | Maximum likelihood approach | MCMC and Nelder-Mead simplex | Simulated annealing based on weighted- sum total deviance | Nelder-Mead simplex for Natural History Model calibration to SEER, and multi- dimensional grid search for calibration to trials |
| Data sources used for calibration | NLST;PLCO;SEER 17 2004–2008 incidence by age, stage, histology; NHS/HPFS | NLST;PLCO; originally fitted to PLuSS CT, CARET | NLST;NHS/HPFS LC incidence by histology;SEER LC survival by gender, age, histology and stage | NLST;SEER 1990–2000 incidence by age, stage, histology; survival by stage; Mayo CT;LSS | NLST;PLCO;NHS/HPFS LC incidence, SEER 1988–2003 survival by histology and gender |
| Number of parameters estimated by calibration | 110 | 90 | 50 | 53 | 13 in natural history, 8 for calibration |
| Screening sensitivity model | By stage and histology | By size (number of cells), histology and gender | By size (number of cells), histology and gender | By size (mm) and location in lung (central/peripherial) | By size (mm) and histology |
| Screening effectiveness mechanism | Cure model | Combination cure model and stage-shift | Stage-shift model, with adjustments for age | Not stage-shift model | Not stage-shift model |
| Positive Nodule Follow-up algorithm | Implicit | Implicit based on NLST follow-up rates | Implicit based on NLST follow-up rates | Explicit. Based on size at diagnosis and smoking history. LCs diagnosed on follow-up are categorized as ‘non-screen detected’ | Explicit |
Histology distribution
Three models (F/M/U) have smoking dose-response modules that are histology specific. In these models, the LC histology distribution is a model outcome that depends on the dose-response module and the participants’ smoking histories. Two models (E/S) have smoking dose-response modules that are not histology-specific, so they calibrated their histology to NLST and PLCO. Histology categories varied by model (Table 1). Differences in histology categorization across models are due partly to differences in dose-response modules, which are based on different datasets that vary in their LC histology classifications (NHS/HPFS, NLST/PLCO, SEER). But they are also due to variations in model structure, and the modelers’ judgment regarding the histology detail needed to characterize screening efficacy.
Stage progression
All models assume that stage progression rates vary by gender and histology. Models E and U use Markov state-transition processes to model stage progression22. Model U further assumes that the progression rate at each stage is dependent on tumor size (cell number). Models F, M and S model stage as a function of tumor size and the presence or absence of metastasis. Variability in stage categorization (Table 1) is due to the underlying data inputs, model structure, and the modelers’ criteria about the stage detail needed to capture the effects of screening on LC mortality.
LC survival
All models assume that LC survival varies by histology and stage. Models F, M, S and U also assume that survival varies by gender. Model U further assumes that survival varies by age at diagnosis.
Models E, M, and U use LC survival modules calibrated to the SEER 17 (2004–2008) survival. Survival in model S was calibrated to SEER 17 (1988–2003) survival. Model F LC survival was calibrated to NLST and PLCO.
Other-cause mortality (OCM)
Model E uses an OCM module based on the NCI’s smoking history generator, which produces OCM rates consistent with the US population23, 24. All other models use OCM based on NLST and PLCO (Table 1).
Screening and follow-up
Screening sensitivities vary by model. In Model E, screen sensitivity varies by modality, stage and histology. Models F and U have screen sensitivities that also vary by tumor size (cell number). Sensitivities in models M and S depend on screening modality, tumor size (mm) and lung nodule location (central vs. peripheral). Model S also considers histology. The variability in assumption is primarily due to differences in model structure (e.g., models that do not model tumor size explicitly, cannot have size-dependent sensitivities). Follow-up exams are defined as those received after a positive screen but prior to diagnosis, if it occurred. Algorithms for following-up a positive screen are simulated with varying detail: models M and S include detailed algorithms based on nodule size thresholds and risk factors (explicit), while models E, F, and U incorporate a global probability of receiving a number of follow-up exams (implicit) based on the observed frequency of imaging exams per positive screen in NLST. Since NLST and PLCO did not specify a follow-up regimen, Models M and S specify less-aggressive protocols than Fleischner guidelines25, to approximate the observed follow-up rate in NLST.
Trial simulations
Four models (E/M/S/U) generate individual LC outcomes using microsimulations26. The simulation depends on individual smoking history, gender, age at enrollment, and arm. The specific simulation approach depends on the model’s structure. Three models (E/M/S) simulate onset ages of lung tumors via their smoking dose-response module and then simulate each tumor’s natural history, including malignant conversion, stage progression (E/M/S), tumor growth (M/S), and clinical and screen detection (E/M/S). Model U simulates the initiation of tumors via mutations of normal cells, and then the premalignant and malignant tumor cell dynamics (cell division, death, stage progression, clinical and screen detection). Model F uses a likelihood-based approach to estimate LC outcomes and death via a longitudinal multistage-observation model18. All models simulate all trial participants and then compare their aggregate modeled outcomes with the trials’ (LC incidence and mortality and OCM by arm, gender, histology and stage).
Screening effectiveness and mortality reduction
All models evaluate screening effectiveness, but based on different assumptions that depend on model structure. Model M assumes that patients with early-stage non-small cell LC (NSCLC) would undergo resection (lobectomy, consistent with practice guidelines), which removes the primary cancer. In model M, therefore, for patients without undetected distant metastases or additional primary LCs in another lobe, resection is curative for LC. In Model U, the benefit of screening is due to early detection of LC, leading to improved cure probabilities and survival times, which depend on histology, stage, gender, and diagnosis age, but not on detection mode. Model F assumes that screen-detected cancers are treated according to clinical practice guidelines with cure rates that vary by tumor stage and histology. In Model E, screen-detected cases experience a reduced risk of LC mortality versus clinically detected cases. This improved prognosis is represented as a cure fraction (dependent on stage and screening modality for stages IA, IB and II) calibrated to the trials. Model S estimates probabilities of lethal metastases as function of tumor size, histology and gender. All advanced-stage LCs are, by definition, detected after the onset of lethal metastases. Some early-stage cancers may have occult lethal metastases at detection. For early- and late-stage tumors detected after the onset of lethal metastases, LC survival is not affected by screening. However, with screening, patients are more likely to be detected at early stages before the onset of lethal metastases, thus cured of their disease following standard care.
Model calibration and validation approach
Models were first calibrated to the NLST LC incidence and mortality by arm, gender, histology, stage, and detection mode. Models were then validated against PLCO by first comparing model predictions and observed LC incidence and mortality by gender and arm in the subset of PLCO individuals who would have been eligible for NLST (PLCO-NLST-eligible). Model predictions were consistent with the observed outcomes in the PLCO-NLST-eligible group, demonstrating the consistency between the two trials. However, model outcomes did not consistently match against observed outcomes among PLCO participants not eligible for the NLST (never- and lighter-smokers). As a result, models were further calibrated to fit the whole PLCO dataset to ensure that they could be used with confidence to extrapolate the effects of CT screening to smokers with lower exposure (below 30 pack-years). Calibration methods (targets, measures of goodness of fit and optimization algorithms) varied by model and are described in Table 1.
Results
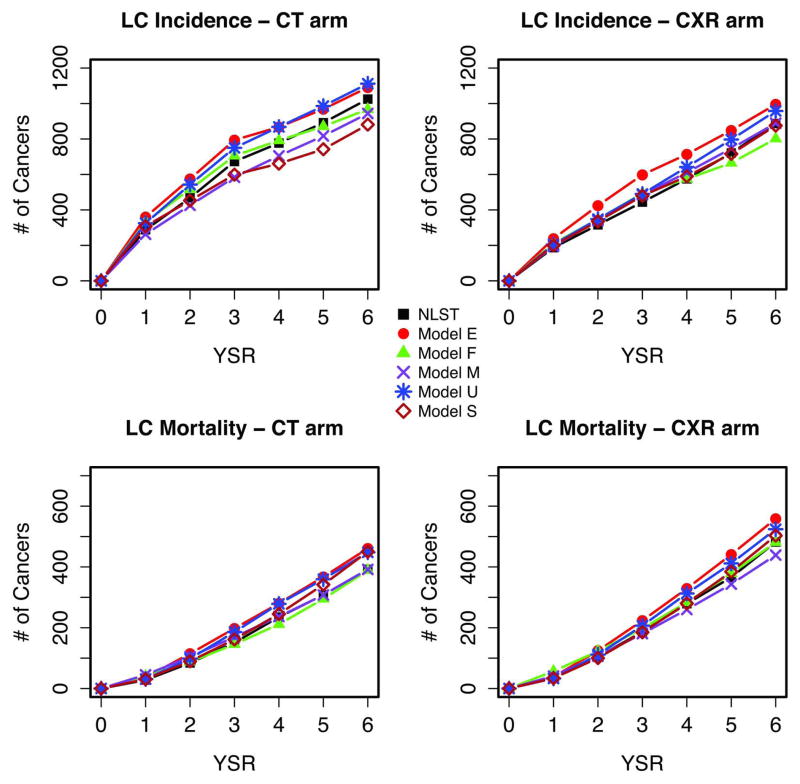
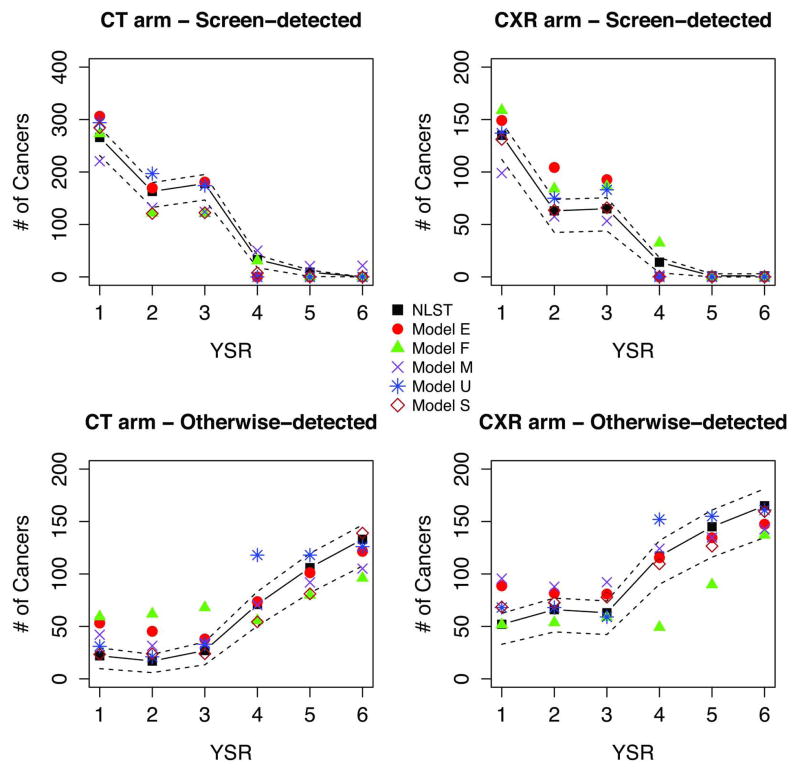
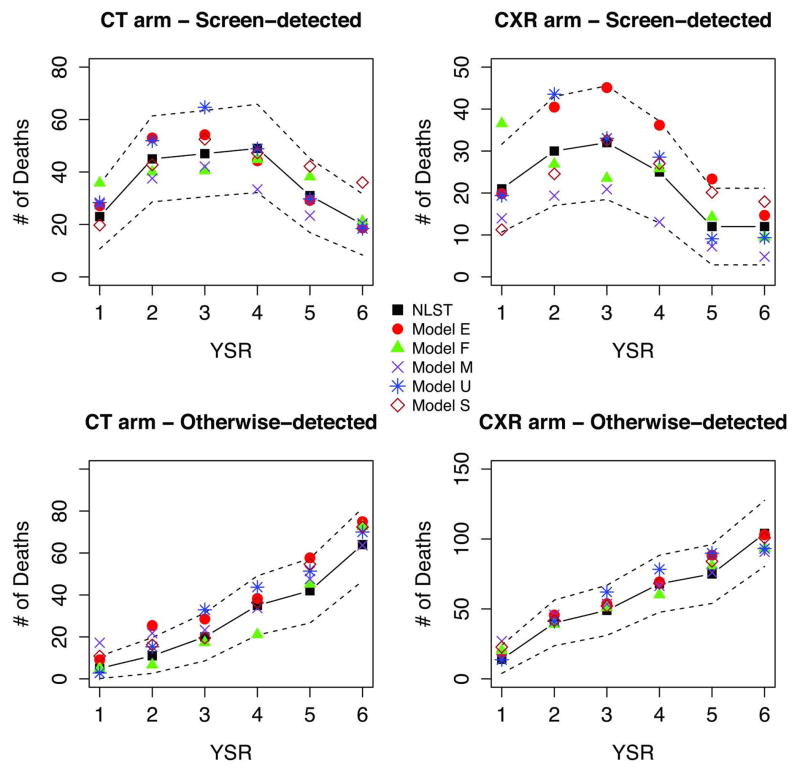
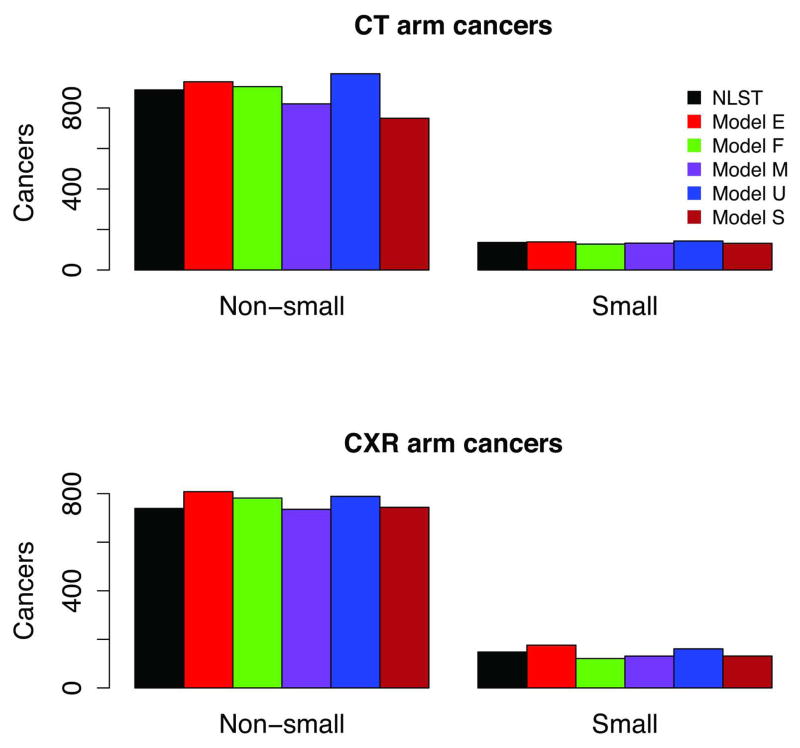
After final calibration, all models produced LC outcomes consistent with both trials (within the confidence intervals of the data). We show several measures of LC incidence and mortality in NLST and PLCO for both genders combined and compare observed and model outcomes. Calibration targets varied by model, so the modeling results shown in each figure include combinations of calibrated outcomes and model predictions/extrapolations. Modeled outcomes were computed using the ‘final’ version of each model.
Figure 1 shows NLST observed and modeled incidence and mortality by arm and year since randomization (YSR). The figure shows that as previously reported1 the observed cumulative LC incidence was higher in the CT arm, whereas the cumulative mortality was higher in the CXR arm. Figures 2 and 3 display observed versus modeled LC cases and deaths in NLST by detection modality (screen vs non-screen detected), arm and YSR. The figures show the contrasting pattern between screen and non-screen-detected cancers, with an early increase and peaking by YSR for screen-detected cancers in both arms, in contrast with the slow progressive rise for non-screen detected cancers. The figures show that the models reproduce the general patterns of incidence and mortality by arm, detection modality and YSR.
Figure 1.
Figure 2.
Figure 3.
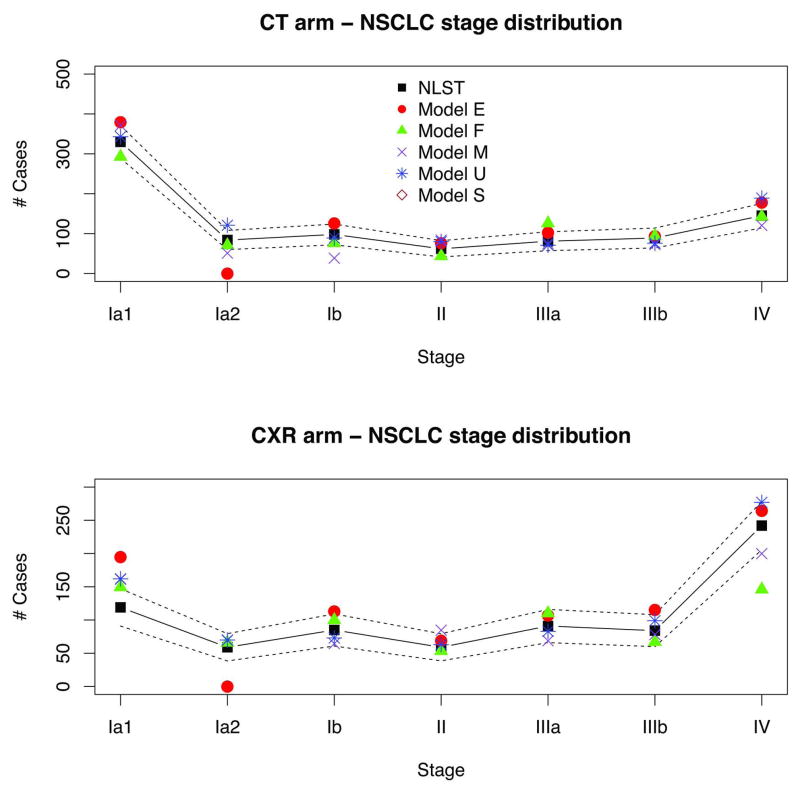
Figure 4 shows observed versus model predicted LCs in NLST by histology. Because models have varying LC histology categories, we grouped them here as small cell (SCLC) and non-small cell LCs (NSCLC). The figure shows that the observed NSCLC incidence was higher in the CT arm, whereas the SCLC incidence was roughly similar in both arms. Modeled histology distributions match well with the observed. Figure 5 shows NLST observed versus predicted NSCLC incidence by clinical stage and arm. The figure demonstrates the shift to earlier stages in NSCLC incidence in the CT versus CXR arm.
Figure 4.
Figure 5.
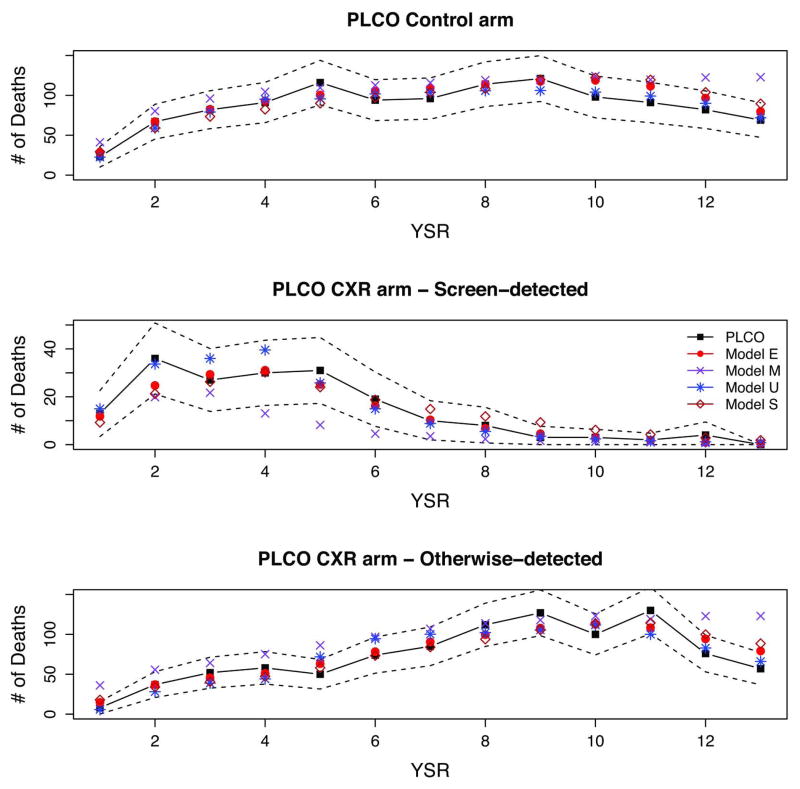
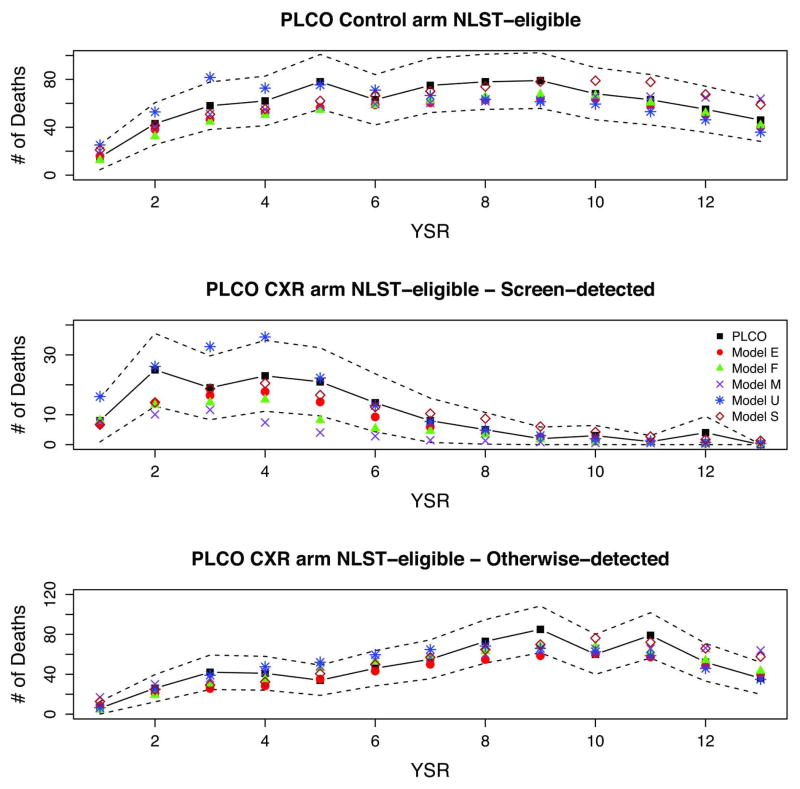
Figures 6 and 7 show full PLCO and PLCO-NLST-eligible observed and modeled deaths by arm, detection mode (CXR arm), and YSR. The figures display the early increase and peaking of screen-detected cancers in the CXR arm by YSR, and the slower increase of otherwise-detected cancers in the CXR arm and for all cancers in the control arm. The figures show a decrease in the non-screen detected CXR and control arm cancers towards the end of the trial, likely due to the weeding-out and loss to follow-up of high-risk individuals. All models reproduce the general patterns of incidence and mortality in PLCO.
Figure 6.
Figure 7.
Discussion
Main Findings
We derived five independent LC and screening natural history models calibrated to the two largest screening trials to date, NLST and PLCO. The five models are diverse in structure, assumptions, and additional data inputs. All models produce outcomes that are generally consistent with the trial results. We found that models calibrated only to NLST validated well against the PLCO-NLST-eligible population, demonstrating the consistency between the two trials. However calibrating only to NLST may be insufficient for the purposes of evaluating screening protocols allowing for lower smoking exposures and making projections for the US population. This is particularly true for models that base their smoking dose-response fully on NLST and also for models with histology distributions based on observed trial data, since NLST only includes information about heavy-current and former smokers and it is well-documented that smoking LC risk varies greatly by histology27, 28. To derive models that could be used with confidence to extrapolate the impact of low-dose CT screening to smokers with lower exposures (<30 pack-years) and to the US population, it is essential to calibrate such models to datasets with information on LC risk for light and never smokers, such as NHS/HPFS or PLCO.
Study limitations and strengths
The study has some limitations. First, as in any mathematical modeling approach, our models are simplifications of the biological complexity of lung carcinogenesis and neglect the influence of various endogenous and exogenous LC risk factors such as family history, COPD, residential radon, occupational exposures, race, and socio-economic status. However, it is well-known that smoking still accounts for the large majority of LC deaths (≥90%29) and our models do capture the complex relationship between smoking and LC via their smoking dose-response module. Furthermore, in contrast with most LC risk models in the literature, several of our models do account explicitly for the differential impact of smoking on LC risk by histology. The diversity in model structure, assumptions, and data sources provides additional strength (and an assessment of model uncertainty) to the conclusions of our comparative modeling analysis, as does the long-history of collaboration between the CISNET groups.
Another potential limitation is that the screening mortality reductions predicted by each model are largely dependent on the findings of NLST and PLCO. NLST and PLCO are currently the best existing studies of LC screening reporting on the main outcome of LC mortality (reduction), so calibrating models to these trials is the best available option. Some other studies, particularly in Europe, have been underpowered to show benefits of low-dose CT screening while others are still ongoing30. Once data from other trials becomes available, not expected for a few years, the models could be validated against new trials and if deemed necessary, further calibrated particularly if applied to non-US populations. In any case, the models will be helpful to compare trial results and, if needed, to investigate the reasons behind any potential discrepancies.
Finally, this work highlights the benefits of modeling as a way to synthesize information coming from diverse and complex data sources. The models developed use individual data from RCTs (NLST and PLCO), prospective cohort studies (e.g., NHS/HPFS), and cancer registry data (NCI-SEER). These data sources are extremely valuable on their own, and provide information about different aspects of LC. However, it is only through modeling that they can be integrated and jointly inform the biology and epidemiology of LC, as well as the potential benefits of LC screening at the population level.
Implications and future research
Our analyses demonstrate that the NLST and PLCO-Trial produced consistent results, and suggest that it is critical to use data covering a wide-range of smoking histories (never, light, and heavy smokers) to develop models that can extrapolate the effects of screening to the general population. The five models presented here are currently being used to evaluate the impact of alternative low-dose CT screening protocols on LC mortality in the US. Specifically, we are assessing the effectiveness of screening programs with varying age-eligibility, exposure criteria, and screening frequency31. In the near future, we will use the models to predict the potential levels of overdiagnosis due to LC screening and determine optimal screening strategies at the US and state level. Using models calibrated to NLST and PLCO will enhance the validity of effectiveness and cost-effectiveness analyses of LC screening.
Supplementary Material
Acknowledgments
Funding sources: This report is based on research conducted by the NCI’s Cancer Intervention and Surveillance Modeling Network (CISNET) through support from an interagency agreement with the Agency for Healthcare Research and Quality (AHRQ) (Administrative Supplement to NCI U01-CA152956).
Footnotes
Conflicts of interest: All investigators involved report no conflicts of interest with objectively conducting this research.
Financial disclosures: Harry J. de Koning is PI of the NELSON-trial. The NELSON-trial received workstations from Siemens Germany for uniform reading across all sites, and funding for a side-study on proteomics by Roche. Roche Diagnostics paid 1,500 Euro to the Department of Public Health, Erasmus MC for a Medical Advisory Board meeting.
References
- 1.Aberle DR, Adams AM, et al. National Lung Screening Trial Research Team. Reduced lung-cancer mortality with low-dose computed tomographic screening. N Engl J Med. 2011;365:395–409. doi: 10.1056/NEJMoa1102873. [DOI] [PMC free article] [PubMed] [Google Scholar]
- 2.Oken MM, Hocking WG, Kvale PA, et al. Screening by chest radiograph and lung cancer mortality: The prostate, lung, colorectal, and ovarian (PLCO) randomized trial. JAMA. 2011;306:1865–1873. doi: 10.1001/jama.2011.1591. [DOI] [PubMed] [Google Scholar]
- 3.Bach PB, Mirkin JN, Oliver TK, et al. Benefits and harms of CT screening for lung cancer: A systematic Review Benefits and harms of CT screening for lung cancer. JAMA. 2012:1–12. doi: 10.1001/jama.2012.5521. [DOI] [PMC free article] [PubMed] [Google Scholar]
- 4.Bach PB, Gould MK. When the average applies to no one: Personalized decision making about potential benefits of lung cancer screening. Ann Intern Med. 2012 doi: 10.7326/0003-4819-157-8-201210160-00524. [DOI] [PubMed] [Google Scholar]
- 5.Moolgavkar SH, Holford TR, Levy DT, et al. Impact of reduced tobacco smoking on lung cancer mortality in the united states during 1975–2000. J Natl Cancer Inst. 2012;104:541–548. doi: 10.1093/jnci/djs136. [DOI] [PMC free article] [PubMed] [Google Scholar]
- 6.Zauber AG, Winawer SJ, O’Brien MJ, et al. Colonoscopic polypectomy and long-term prevention of colorectal-cancer deaths. N Engl J Med. 2012;366:687–696. doi: 10.1056/NEJMoa1100370. [DOI] [PMC free article] [PubMed] [Google Scholar]
- 7.Mandelblatt JS, Cronin KA, Bailey S, et al. Effects of mammography screening under different screening schedules: Model estimates of potential benefits and harms. Ann Intern Med. 2009;151:738–747. doi: 10.1059/0003-4819-151-10-200911170-00010. [DOI] [PMC free article] [PubMed] [Google Scholar]
- 8.Etzioni R, Gulati R, Tsodikov A, et al. The prostate cancer conundrum revisited : Treatment changes and prostate cancer mortality declines. Cancer. 2012;118:5955–5963. doi: 10.1002/cncr.27594. [DOI] [PMC free article] [PubMed] [Google Scholar]
- 9.Heijnsdijk EA, Wever EM, Auvinen A, et al. Quality-of-life effects of prostate-specific antigen screening. N Engl J Med. 2012;367:595–605. doi: 10.1056/NEJMoa1201637. [DOI] [PMC free article] [PubMed] [Google Scholar]
- 10.Feuer EJ, Etzioni R, Cronin KA, Mariotto A. The use of modeling to understand the impact of screening on U.S. mortality: Examples from mammography and PSA testing. Stat Methods Med Res. 2004;13:421–442. doi: 10.1191/0962280204sm376ra. [DOI] [PubMed] [Google Scholar]
- 11.Kuntz KM, Lansdorp-Vogelaar I, Rutter CM, et al. A systematic comparison of microsimulation models of colorectal cancer: The role of assumptions about adenoma progression. Med Decis Making. 2011;31:530–539. doi: 10.1177/0272989X11408730. [DOI] [PMC free article] [PubMed] [Google Scholar]
- 12.McMahon PM, Hazelton WD, Kimmel M, Clarke LD. Chapter 13: CISNET lung models: Comparison of model assumptions and model structures. Risk Anal. 2012;32 (Suppl 1):S166–78. doi: 10.1111/j.1539-6924.2011.01714.x. [DOI] [PMC free article] [PubMed] [Google Scholar]
- 13.Weinstein MC, O’Brien B, Hornberger J, et al. Principles of good practice for decision analytic modeling in health-care evaluation: Report of the ISPOR task force on good research practices--modeling studies. Value Health. 2003;6:9–17. doi: 10.1046/j.1524-4733.2003.00234.x. [DOI] [PubMed] [Google Scholar]
- 14.McMahon PM, Kong CY, Johnson BE, et al. Estimating long-term effectiveness of lung cancer screening in the mayo CT screening study. Radiology. 2008;248:278–287. doi: 10.1148/radiol.2481071446. [DOI] [PMC free article] [PubMed] [Google Scholar]
- 15.McMahon PM, Kong CY, Johnson BE, et al. The MGH-HMS lung cancer policy model: Tobacco control versus screening. Risk Anal. 2012;32 (Suppl 1):S117–24. doi: 10.1111/j.1539-6924.2011.01652.x. [DOI] [PMC free article] [PubMed] [Google Scholar]
- 16.Meza R, Hazelton WD, Colditz GA, Moolgavkar SH. Analysis of lung cancer incidence in the nurses’ health and the health professionals’ follow-up studies using a multistage carcinogenesis model. Cancer Causes Control. 2008;19:317–328. doi: 10.1007/s10552-007-9094-5. [DOI] [PubMed] [Google Scholar]
- 17.Hazelton WD, Clements MS, Moolgavkar SH. Multistage carcinogenesis and lung cancer mortality in three cohorts. Cancer Epidemiol Biomarkers Prev. 2005;14:1171–1181. doi: 10.1158/1055-9965.EPI-04-0756. [DOI] [PubMed] [Google Scholar]
- 18.Hazelton WD, Goodman G, Rom WN, et al. Longitudinal multistage model for lung cancer incidence, mortality, and CT detected indolent and aggressive cancers. Math Biosci. 2012;240:20–34. doi: 10.1016/j.mbs.2012.05.008. [DOI] [PMC free article] [PubMed] [Google Scholar]
- 19.Schollnberger H, Manuguerra M, Bijwaard H, et al. Analysis of epidemiological cohort data on smoking effects and lung cancer with a multi-stage cancer model. Carcinogenesis. 2006;27:1432–1444. doi: 10.1093/carcin/bgi345. [DOI] [PMC free article] [PubMed] [Google Scholar]
- 20.Tammemagi MC, Lam SC, McWilliams AM, Sin DD. Incremental value of pulmonary function and sputum DNA image cytometry in lung cancer risk prediction. Cancer Prev Res (Phila) 2011;4:552–561. doi: 10.1158/1940-6207.CAPR-10-0183. [DOI] [PubMed] [Google Scholar]
- 21.Spitz MR, Hong WK, Amos CI, et al. A risk model for prediction of lung cancer. J Natl Cancer Inst. 2007;99:715–726. doi: 10.1093/jnci/djk153. [DOI] [PubMed] [Google Scholar]
- 22.Siebert U, Alagoz O, Bayoumi AM, et al. State-transition modeling: A report of the ISPOR-SMDM modeling good research practices task force-3. Med Decis Making. 2012;32:690–700. doi: 10.1177/0272989X12455463. [DOI] [PubMed] [Google Scholar]
- 23.Jeon J, Meza R, Krapcho M, Clarke LD, Byrne J, Levy DT. Actual and counterfactual smoking prevalence rates in the U.S. population via microsimulation. Risk Anal. 2012;32 (Suppl 1):S51–68. doi: 10.1111/j.1539-6924.2011.01775.x. [DOI] [PMC free article] [PubMed] [Google Scholar]
- 24.Rosenberg MA, Feuer EJ, Yu B, et al. Cohort life tables by smoking status, removing lung cancer as a cause of death. Risk Anal. 2012;32 (Suppl 1):S25–38. doi: 10.1111/j.1539-6924.2011.01662.x. [DOI] [PMC free article] [PubMed] [Google Scholar]
- 25.MacMahon H, Austin JH, Gamsu G, et al. Guidelines for management of small pulmonary nodules detected on CT scans: A statement from the fleischner society. Radiology. 2005;237:395–400. doi: 10.1148/radiol.2372041887. [DOI] [PubMed] [Google Scholar]
- 26.Rutter CM, Zaslavsky AM, Feuer EJ. Dynamic microsimulation models for health outcomes: A review. Med Decis Making. 2011;31:10–18. doi: 10.1177/0272989X10369005. [DOI] [PMC free article] [PubMed] [Google Scholar]
- 27.Haiman CA, Stram DO, Wilkens LR, et al. Ethnic and racial differences in the smoking-related risk of lung cancer. N Engl J Med. 2006;354:333–342. doi: 10.1056/NEJMoa033250. [DOI] [PubMed] [Google Scholar]
- 28.Kenfield SA, Wei EK, Stampfer MJ, Rosner BA, Colditz GA. Comparison of aspects of smoking among the four histological types of lung cancer. Tob Control. 2008;17:198–204. doi: 10.1136/tc.2007.022582. [DOI] [PMC free article] [PubMed] [Google Scholar]
- 29.Centers for Disease Control and Prevention (CDC) Smoking-attributable mortality, years of potential life lost, and productivity losses--united states, 2000–2004. MMWR Morb Mortal Wkly Rep. 2008;57:1226–1228. [PubMed] [Google Scholar]
- 30.Humphrey LL, Deffebach M, Pappas M, et al. Screening for lung cancer with low-dose computed tomography: A systematic review to update the u.s. preventive services task force recommendation. Ann Intern Med. 2013;159:411–420. doi: 10.7326/0003-4819-159-6-201309170-00690. [DOI] [PubMed] [Google Scholar]
- 31.de Koning HJ, Meza R, Plevritis SK, et al. AHRQ Publication No 13-05196-EF-2. Rockville, MD: Agency for Healthcare Research and Quality; 2013. Benefits and harms of computed tomography lung cancer screening programs for high-risk populations. [Google Scholar]
Associated Data
This section collects any data citations, data availability statements, or supplementary materials included in this article.


