Abstract
Cerebral development involves a complex cascade of events which are difficult to visualize and quantify in vivo. In this study we combine information from Diffusion Tensor Imaging (DTI) and Quantitative Susceptibility Mapping (QSM) to analyze developing mouse brains at five stages up to 56 days postnatal. Susceptibility maps were calculated using frequency shifts in gradient echo MR images acquired at 9.4 T. Mean apparent magnetic susceptibility and magnetic susceptibility anisotropy of major white matter tracts were evaluated as a function of age. During the first two weeks, susceptibility of white matter appeared paramagnetic relative to surrounding gray matter; it then gradually became more diamagnetic. While diffusion anisotropy was already apparent and high at postnatal day 2, susceptibility anisotropy only became significant during the third week. This mismatch indicated different microstructural underpinnings for diffusion anisotropy and susceptibility anisotropy. Histological exams were also performed to evaluate myelin and iron content. It is confirmed that the main source of susceptibility contrast in WM is the myelin content. The ability to quantify the magnetic properties of white matter will provide valuable information on the architecture of the brain during development and potentially a more specific indicator for myelin degenerative diseases.
Keywords: Quantitative susceptibility mapping (QSM), Susceptibility tensor imaging (STI), Brain development, Iron, Myelin
Introduction
Phase images of gradient echo (GRE) MRI show high tissue contrast generated mainly from magnetic susceptibility differences (Duyn et al., 2007; Rauscher et al., 2005). The source of this contrast is complex and is still under investigation. Some suggested molecular sources that are naturally present in the brain include: non-heme iron (mostly in the form of ferritin), deoxy-hemoglobin and myelin (Haacke et al., 2005; Liu et al., 2011; Shmueli et al., 2009), oxygenation (Lu and Ge, 2008), calcium (Schweser et al., 2010a), macroscopic geometry (Schäfer et al., 2009a; Shmueli et al., 2009), micro structural orientation (Bender and Klose, 2010; He and Yablonskiy, 2009; Liu, 2010; Schäfer et al., 2009b) and chemical exchange (Luo et al., 2010; Zhong et al., 2008). In general, magnetic susceptibility of white matter appears diamagnetic relative to gray matter and is anisotropic, meaning that its value depends on the orientation of the applied magnetic field. Myelin is considered the dominate source of this anisotropic diamagnetic susceptibility. Imaging magnetic susceptibility thereby provides a potential non-invasive method for mapping myelination that is crucial to the development and functioning of the brain.
The importance of myelin in forming the diamagnetism and susceptibility anisotropy of white matter has been demonstrated in a number of recent studies. In one study, it was shown that the strong susceptibility contrast between white and gray matter disappeared in the dysmyelinating shiverer mouse whose myelin was not properly developed due to genetic modification (Liu et al, 2011). This contrast also decreased when mice were fed with a cuprizone diet that resulted in demyelination in the central nervous system (Lee et al, 2012). The developing brain offered another vehicle to test this myelin hypothesis. It was shown that phase contrast was reduced in the human neonates whose brains are known to be not well myelinated yet (Zhong et al., 2011). In the developing mouse brain from postnatal day (PND4) to day 40 (PND40), it was also observed that phase contrast between gray and white matter was correlated with the optical intensity of myelin stained histological slides (Lodygensky et al., 2012). However, both studies are based on phase contrast rather than the more intrinsic tissue property, i.e. the local quantitative susceptibility value. In a recent study of quantitative susceptibility mapping (QSM) in a large population from 1 to 83 years of age, it was further revealed that magnetic susceptibility of white matter first becomes more diamagnetic as the brain develops followed by a continuing decreasing of diamagnetism as the brain ages (Li et al, in press). This developmental trajectory was explained by the myelination and demyelination process which occurs in normal brain development and aging.
Besides the diamagnetism, another important characteristic of magnetic susceptibility of white matter is that it is anisotropic (Lee et al., 2010; Liu, 2010). When the orientation of the applied magnetic field is changed, the measured apparent magnetic susceptibility of the white matter also changes. The origin of this anisotropy is intimately tied to the myelin sheath that surrounds the axons. Li et al showed that molecular susceptibility anisotropy of myelin lipids and the ordered arrangement of these molecules in the lipid bilayer structure can largely explain the bulk susceptibility anisotropy observed in MRI (Li et al., 2012). It was further shown that magnetic susceptibility anisotropy of white matter is directly proportional to myelin concentration. In the extreme case of shiverer mouse, not only susceptibility contrast but also susceptibility anisotropy of the white matter disappears.
While previous studies have indicated a correlation between myelination and gradient-echo phase in early brain development, the quantitative relationship between myelination and the underlying susceptibility value and susceptibility anisotropy in early brain development remains unknown. During this period of development, the brain undergoes rapid changes in size, morphology, microstructure and molecular composition. In particular, axonal growth, pruning and myelination all profoundly affect the biophysical properties of the white matter. At the same time, iron is also critical for proper myelination, resulting in a potentially competing mechanism for susceptibility of white matter.
The aim of the study is to quantitatively evaluate susceptibility and susceptibility anisotropy of the white matter in the mouse brain as a function of age from postnatal day 2 (PND2) to day 56 (PND56). Histological staining is used to determine the quantitative relationship between myelin and iron content with susceptibility. Diffusion tensor imaging (DTI) is conducted to evaluate the development of axonal organization. It is shown that susceptibility of the white matter is highly correlated (R2 = 0.9329, p = 0.0036) with the optical intensity of Luxol Fast Blue staining (myelin staining) and is uncorrelated with Perl’s Prussian Blue staining (iron staining) (R2 = 0.0065, p = 0.4510). Interestingly, white matter appears paramagnetic relative to gray matter during the first two weeks after birth. While susceptibility anisotropy increases as the brain develops, it only becomes significant after the second week.
Materials and Methods
Animal preparation
All procedures were approved by the Duke Institutional Animal Care and Use Committee. Pregnant C57BL/6 dams were obtained from the Jackson Laboratories (The Jackson Laboratory, Bar Harbor, ME). Food and water were provided to the dam ad libitum. Mouse neonates at PND2, 7, 14 and 22 (n = 4 for each postnatal stage) and PND56 (n = 2) were anesthetized with Nembutal and perfusion fixed. Briefly, a catheter was inserted into the left ventricle of the mouse heart. The animal was perfused with a peristaltic pump with 20 cc of warm (37 °C) 0.9% saline followed by 20 cc of 10% buffered formalin (Buffered Formalde-Fresh; Fisher Scientific) (Johnson et al., 2002). After perfusion fixation, the heads of the mice were stored in 20% buffered formalin overnight before imaging experiments in the following day. The perfused mouse brain was kept within the skull to prevent any potential damage to the brain caused by surgical removal. Each age group contained animals from all litters to minimize litter effect.
MRI
The specimens were sealed tightly inside a cylindrical tube (length 30mm and diameter 11mm) filled with Fomblin. The perfusion-fixed mouse brains were scanned on a 9.4 T (400 MHz) 89-mm-diameter vertical bore Oxford magnet with shielded coil providing gradients of 1600 mT/m and a GE EXCITE MR imaging console (GE Healthcare, Waukesha, WI). To obtain magnetic susceptibility maps, the specimens were scanned with a 3D gradient echo sequence (GRE), TE = 20 ms, TR = 200 ms, FOV = 22×11×11 mm3, matrix size = 368×184×184 and flip angle 40°. After a GRE acquisition, the tube that contained the brain was rotated by some angles along the long axis of the tube which was perpendicular to the B0. A total of 7 to 9 orientations were imaged. For the DTI maps a 3D spin echo sequence was used with parameters: matrix size = 165×82×82 with a b-value = 1000 s/mm2, TE = 12 ms, TR = 2.5 s. Six encoding directions were used. The encoding directions are (1, 0, 1), (1, 0, −1), (1, 1, 0), (1, −1, 0), (0, 1, 1), and (0, 1, −1).
Image processing and analysis
The pixel size was adjusted by k-space truncation to isotropic 60µm for all gradient echo images. Phase data from the GRE were reconstructed, unwrapped and large background phase was removed with the spherical-mean-value filter followed by a deconvolution operation (Schweser and Lehr, 2010) using a 3D-mask that segments the brain from the skull. The mask was created with ITK-SNAP (Yushkevich et al., 2006). Quantitative magnetic susceptibility value was computed for each voxel iteratively using the LSQR algorithm (Liu, 2010) by inverting the following formula:
| [1] |
where Δf is the frequency shift (after unwrapping and background phase removal) and χ is the quantitative and macroscopic magnetic susceptibility (Salomir et al., 2003). Note that susceptibility calculated this way is relative to the Larmor frequency (the mean of the whole brain). Any paramagnetic and diamagnetic susceptibility is relative to this reference.
Regions-of-interest (ROI) in three white matter structures-corpus callosum (CC), anterior commissure (AC), and fornix system (FS) (including the fimbria) - were manually and conservatively segmented using ITK-SNAP based on FA maps. These regions-of-interest were then scaled onto the QSM maps to match their resolution using Convert3D (part of ITK-SNAP). The weighted average of each ROI and its standard deviation were calculated, giving us quantitative data for the susceptibility, anisotropy and diffusivity of each structure.
Gradient echo images acquired different orientations were registered to the first orientation using FSL-FLIRT. The resulting transformation matrix was used to coregister susceptibility maps with FSL-FLIRT (Jenkinson et al., 2002). Fiber orientation of each ROI was obtained from major eigenvectors of the diffusion tensor, thus allowing us to evaluate the dependence of susceptibility on the angle of the fibers with respect to B0. The process was repeated for each of the 5 different postnatal stages. Due to the spatial constraints of the small solenoid RF coil used to achieve maximal SNR, the brain was only rotated around the anterior-posterior axis. This setup is sufficient to evaluate susceptibility anisotropy but insufficient to evaluate the full susceptibility tensor as described by Eq. 7 of Li et al (Li et al., 2012) which requires rotation around two axes perpendicular to B0.
Diffusion tensor images were analyzed as described previously (Basser and Pierpaoli, 1996). To minimize variations induced by potential temperature fluctuations, the mean diffusivity was normalized by ensuring that the mean diffusivity of the fluid within the ventricles was the same at all ages. The ventricles of PND2 were used as the reference. This normalization did not affect FA values.
All numerical analyses were performed in Matlab R2010a (Mathworks, Natick, MA). The calculations were performed on a Linux cluster comprised of 61 computing nodes with 8 CPU cores and a total of 1.76TB of memory, although they can be performed on a typical desktop computer as well (Li et al., 2011).
Histological analysis
Histological examinations were performed after the MRI scans. Coronal 2-µm thick slices were stained with either a myelin staining agent (LFB-Luxol Fast Blue) or an iron staining agent (PPB - Perl’s Prussian Blue) only (no eosin or other counter-stain was used). As a control for iron staining, three slices of human liver tissue were also stained with PPB with the same protocol simultaneously. Slides were imaged using Axioscop2 FSmot optical microscope with EC Plan-Neofluar Zeiss Lens at 10 × magnification, 0.3 aperture under the same settings and light conditions. The other settings were: pixel size = 1.96 µm, 12-Bit depth RGB color, matrix size = 456×344 with 3×3 binning, 5-ms exposure time in tile mode. Background shading effects of picture tiling were removed using a blank image with Matlab. Using ImageJ (US National Institutes of Health) the mean transmitted light intensity (luminosity) of a specific white matter region (external capsule) was assessed with age in contrast to a neighboring gray matter area (contrast = 1 − [(lumWM − lumGM)/maxlum]) and weighted to the white background. Note that lumWM represents the luminosity of white matter, lumGM for luminosity of gray matter and maxlum for maximum luminosity.
X-Ray Spectroscopy
Scanning electron microscopy (SEM) with energy dispersive X-ray spectroscopy (EDS) was performed on a PND22 slice using a Hitachi S-4700 Cold Field Emission Scanning Electron Microscope to detect iron. At first the slice was coated with gold in a vacuum chamber. Then SEM was used to draw an accurate FOV on the white matter structure (external capsule) and an adjacent gray matter area, the atoms of which were later excited with an electron beam. The resulting X-rays are measured by an energy-dispersive spectrometer to create a histogram of all the detected element percentages by weight.
Statistics
Magnetic susceptibility and diffusion measurements were correlated with histological data. Statistical analysis for the correlation was performed with SPSS (16.0.2 SPSS Inc.).
Results
DTI
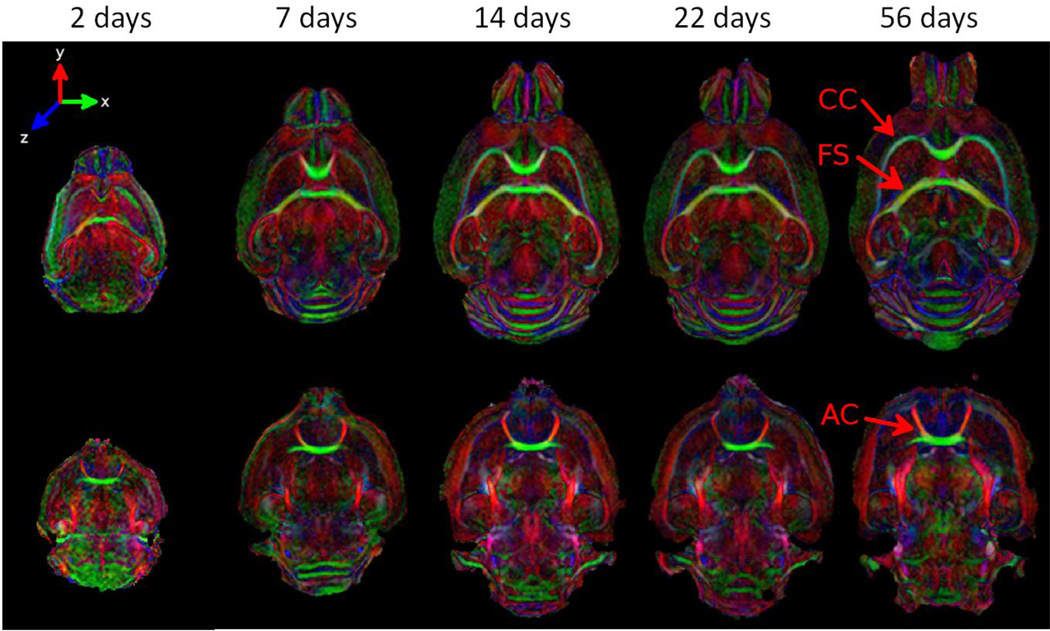
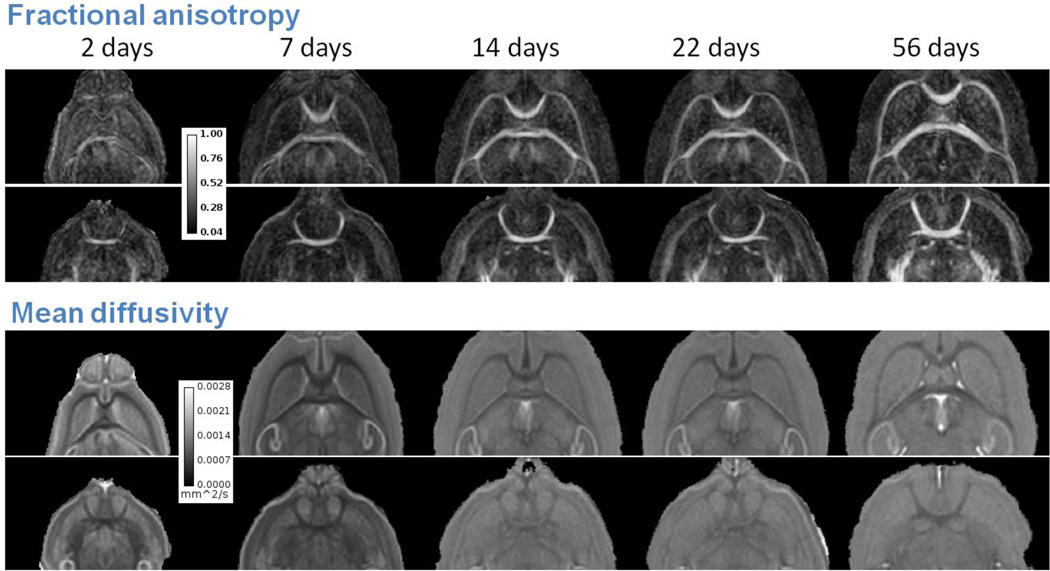
Figure 1 shows two representative slices of color coded fractional anisotropy (FA) maps for progressively older mouse brains from left to right. Color coding was based on the orientation of the major principal eigenvector of the diffusion tensor with green representing left-right, red representing anterior-posterior and blue representing dorsal-ventral. The top row shows coronal slices at the level of corpus callosum (CC), fornix system (FS); the bottom row shows coronal slices of anterior commissure (AC). The same coronal slices are shown in Fig. 2 in grayscale. Top two rows are the FA maps; bottom two rows are the mean diffusivity (trace of the tensor divided by 3) maps. White matter structures including CC, FS and AC have already developed high contrast in FA and mean diffusivity maps even at PND2. The orientations of the white matter structures appear consistent for all ages.
Figure 1.
Color-coded DTI FA maps of the developing mouse brain from PND2 to PND56. Major white matter tracts appear coherently organized at PND2. Red arrows point to the three major white matter regions in green which will be studied (AC: anterior commissure; CC: corpus callosum; FS: fornix system).
Figure 2.
DTI FA and mean diffusivity maps of the developing mouse brain. White matter shows high FA contrast throughout PND2 and PND56. There are only small visual differences of FA contrast among the brains.
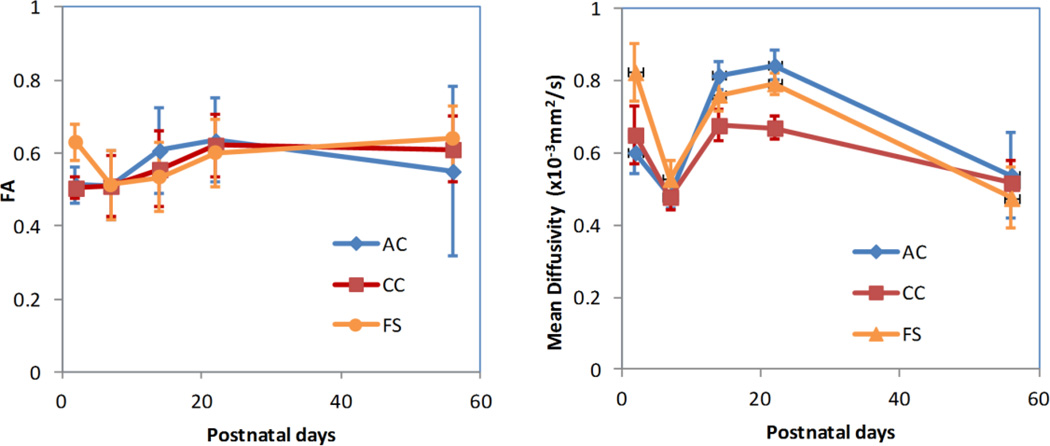
Figure 3 shows the mean values of FA (left) and mean diffusivity (right) for AC, CC and FS as a function of age. Overall, there was an increasing trend for FA and a decreasing trend for the mean diffusivity as brain develops. Interestingly, there appeared to be a dip in FA for FS and especially in mean diffusivity at around PND7.
Figure 3.
FA and mean diffusivity of white matter regions-of-interest as a function of age. There is a slight increase of FA from PND2 to PND56 while the mean diffusivity decreases. A noticeable dip of mean diffusivity is seen at PND7. AC: anterior commissure; CC: corpus callosum; FS: fornix system.
Frequency Shift and Magnetic Susceptibility
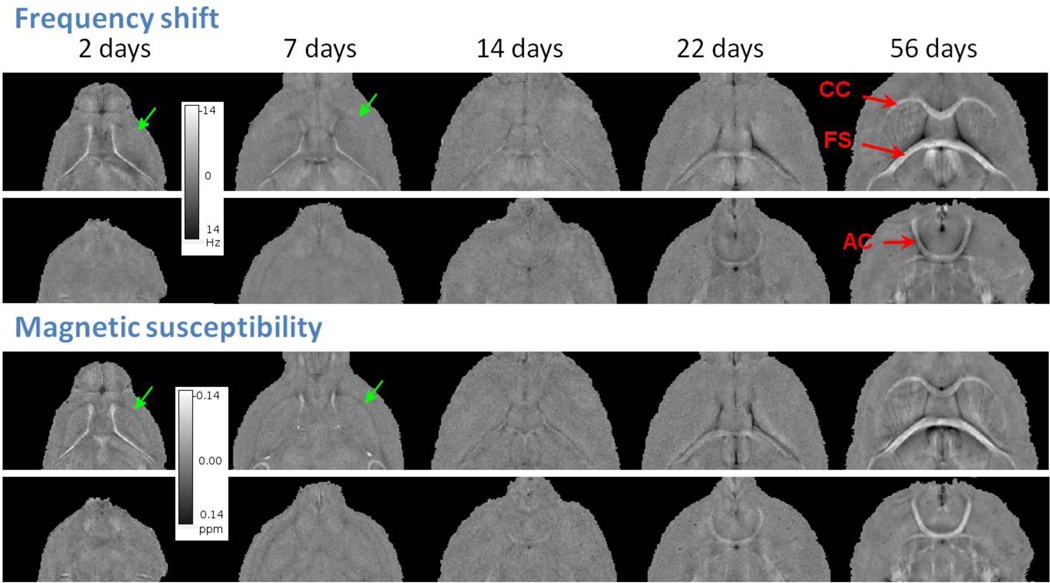
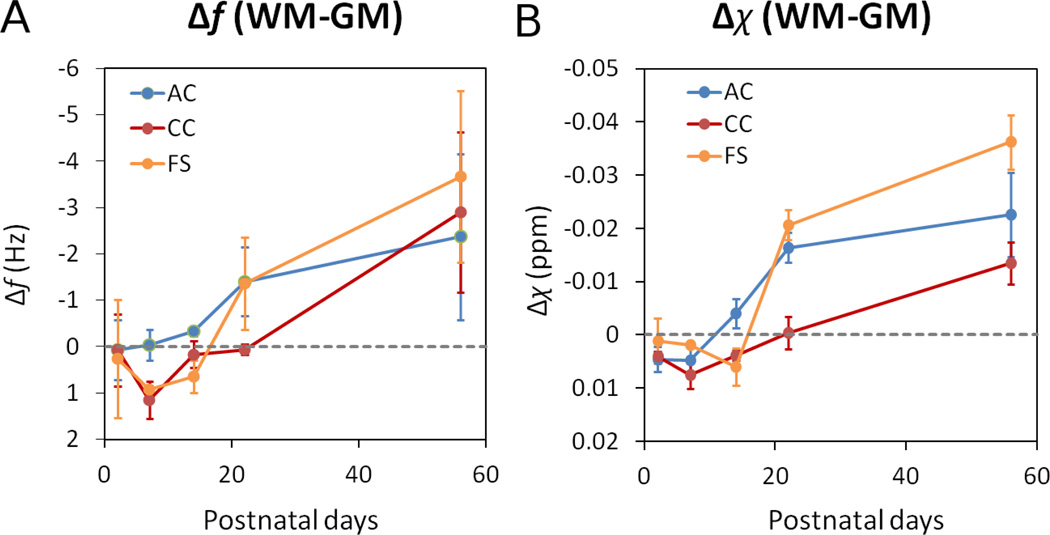
Fig. 4 shows representative frequency shift and quantitative magnetic susceptibility maps of all ages. The slice locations are the same as in Fig. 2. It can be seen that magnetic susceptibility provides more localized depiction of tissue property compared to frequency shift, since frequency shift is affected by the long-range dipole field effect as shown for example in AC. As the brain develops, white matter becomes noticeably more diamagnetic (brighter). At PND2&7, white matter appears in fact paramagnetic relative to surrounding gray matter; at the same time, the ventricles appear highly diamagnetic relative to gray matter at these ages. Fig. 5 plots the quantitative evolution of frequency and susceptibility relative to surrounding gray matter as a function of age. There is a clear reverse of contrast sometime between the second and the third week for all three major white matter regions.
Figure 4.
Examples of frequency shift and magnetic susceptibility maps of the developing mouse brain. Susceptibility provides better delineation of white matter structures such as the external capsule (green arrows). White matter largely appears paramagnetic relative to gray matter in PND2&7 while contrast is weak at PND14. At PND22&56, white matter appears diamagnetic.
Figure 5.
Frequency contrast (A) and magnetic susceptibility contrast (B) of selected white matter regions relative to neighboring gray matter as a function of age. Overall, susceptibility becomes more diamagnetic. The rate of change varies from structure to structure.
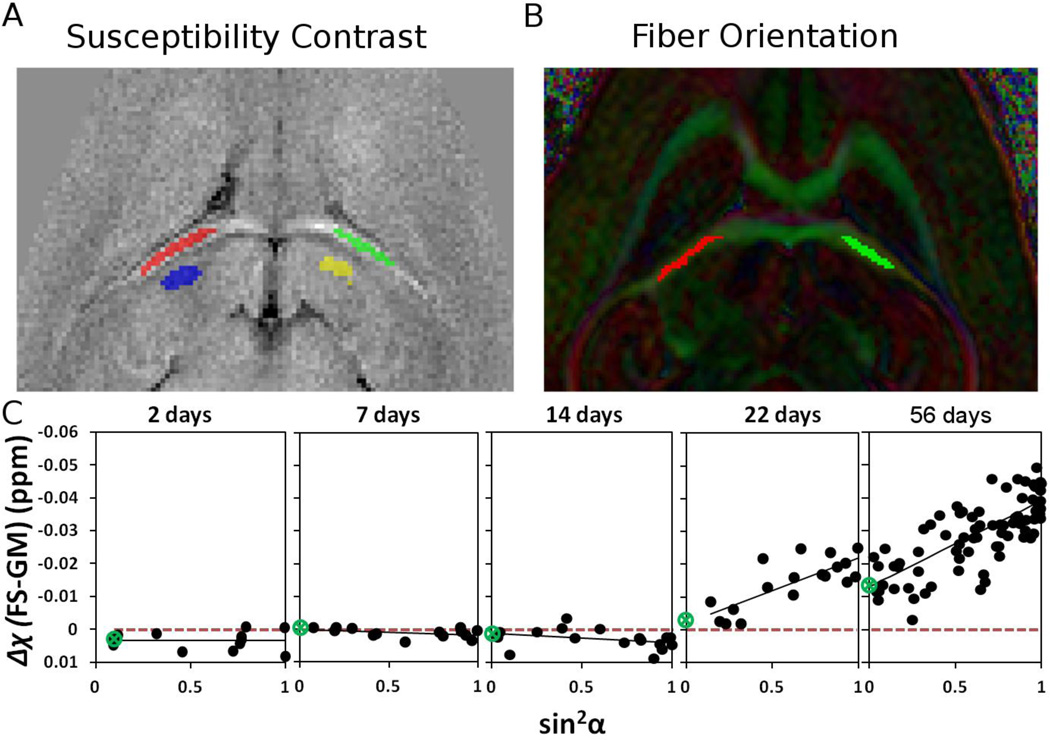
Figure 6 evaluated susceptibility anisotropy as a function of age in the fornix system. Fig. 6A shows the locations of the ROI in bilateral areas of the fornix system (red and green) and neighboring grey matter regions (blue and yellow) respectively that was used as the reference. Fiber orientation is obtained for the same structure from DTI maps on Fig. 6B. Fig. 6C plots the apparent magnetic susceptibility contrast (FS - GM) as a function of sin2α where α is the fiber angle. The fitted equations are summarized in Table 1. The green circle in Fig. 6C indicates the point at which the fitted line intercepts the Δχ axis. As shown in Fig. 6C and Table 1, there is a dramatic increase of susceptibility anisotropy as the brain develops. The fitted curves show negative but close to zero and statistically insignificant (p > 0.09) magnetic susceptibility anisotropy (χ// − χ⊥) during the first two weeks postnatal (Table 1). However, there is a rapid increase of MSA and sign reversal in the third week. By PND22, MSA has reached to 0.02 compared to just −0.0028 at PND14. MSA continues to grow through PND56 reaching 0.026.
Figure 6.
Susceptibility anisotropy in a white matter ROI as a function of age. (A) ROI location in FS and reference ROI in neighboring gray matter; (B) the same ROI selection on color-coded FA maps for determining the corresponding fiber bundle orientation; (C) apparent magnetic susceptibility of the fornix system as function of sin2α where α is the fiber angle with respect to B0. The slope of the fitted trend line increases as the brain develops indicating increasing anisotropy. Only weak anisotropy is present during the first two weeks. The green circle indicates the location of zero crossing.
Table 1.
Magnetic susceptibility anisotropy (MSA) in the fornix system.
| Δχ = −MSA*sin2α + χ0 | R2 | p | |
|---|---|---|---|
| PND2 | Δχ=0.0002*sin2α+0.0033 | R2=0.0004 | p=0.4767 |
| PND7 | Δχ=0.0016*sin2α+0.0002 | R2=0.1489 | p=0.0964 |
| PND14 | Δχ=0.0028*sin2α+0.0010 | R2=0.1082 | p=0.0987 |
| PND22 | Δχ=−0.0200*sin2α−0.0019 | R2=0.5822 | p=0.0002 |
| PND56 | Δχ=−0.0260*sin2α−0.0130 | R2=0.5584 | p=0.000001 |
Histology and X-Ray Spectroscopy
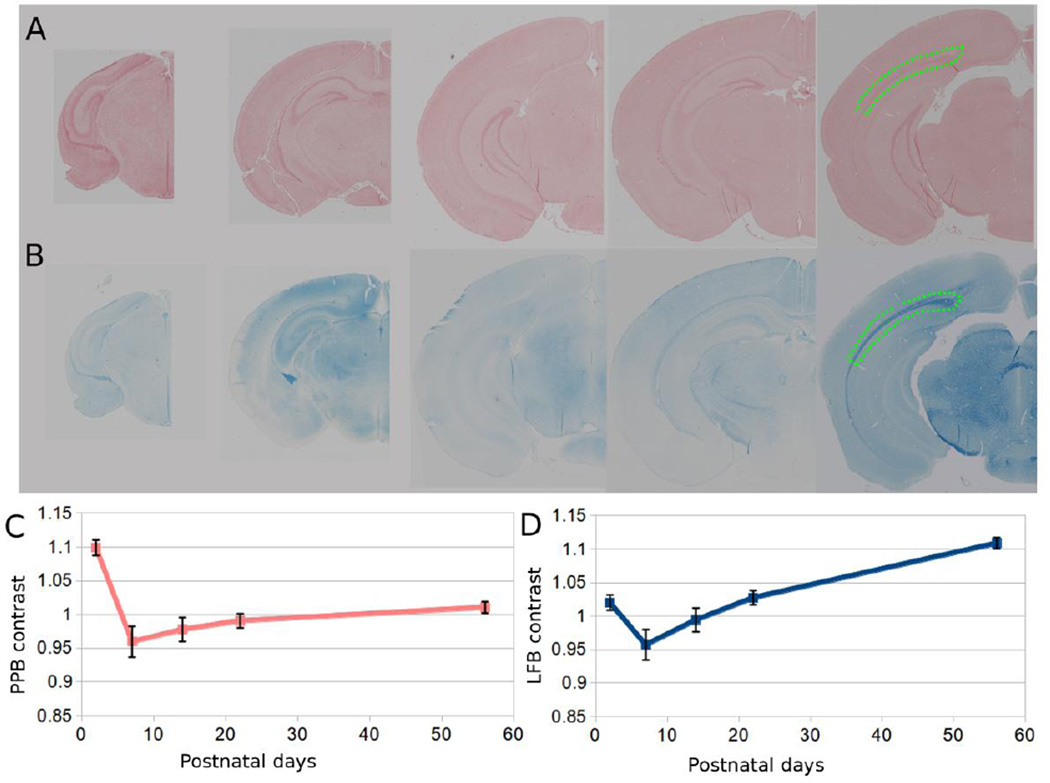
The control liver PPB slides show clear positive iron staining (Supplementary Figure 1). Fig. 7A shows a representative brain slice around bregma −2.5 mm stained with Perl’s Prussian blue; Fig. 7B shows the corresponding staining with LFB. Fig. 7C plots the corresponding PPB contrast as a function of age showing relatively weaker changes in contrast. Fig. 7D plots the LFB contrast of a selected ROI in the external capsule relative to neighboring gray matter region as a function of age. There is a clear trend of increasing LFB contrast as the brain develops.
Figure 7.
Examples of histological slices at different ages. (A) 2-µm PPB stained and (B) LFB stained coronal slices under light microscopy. (C) PPB contrast of the external capsule (inside green dotted area) relative to neighboring gray matter as function of age; (D) corresponding LFB contrast as a function of age.
Fig. 8 shows an SEM image of an ROI over the external capsule as indicated on the histological slide (Fig. 8A). Fig. 8B shows the EDS of a small region (spot 4) within this ROI. The EDS reveals the following elemental composition by weight percentage: C @ 44.17%, O @ 26.71%, Na @ 3.23%, Mg @ 1.17%, Si @ 20.86%, K @ 0.77% and Ca @ 3.09%. The high silicon percentage comes from the glass plate of the histological slide, not the brain specimen itself. Similar values were found in adjacent ROIs. Overall, the iron level was low and not detectable by EDS.
Figure 8.
EDS of an ROI over the external capsule. (A) A LFP stained slice showing the location of the ROI; (B) SEM image of the ROI with “spot 4” indicating where the EDS was measured; (C) EDS showing elemental composition within “spot 4”. No iron is detected on the EDS.
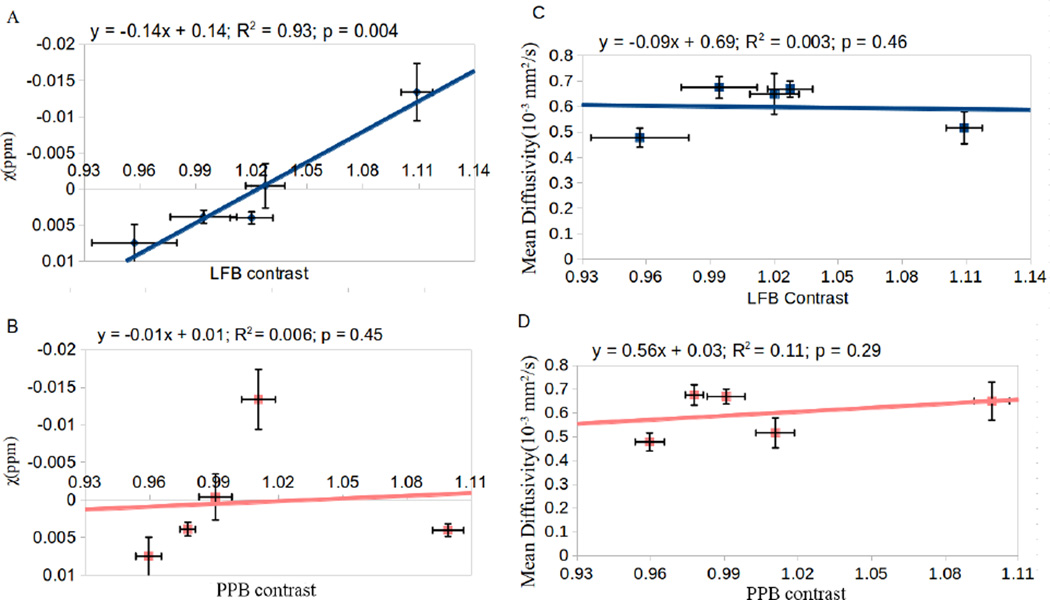
Fig. 9 shows the correlation of susceptibility vs. LFB contrast (Fig. 9A), susceptibility vs. PPB contrast (Fig. 9B), mean diffusivity vs. LFB (Fig. 9C) and mean diffusivity vs. PPB contrast (Fig. 9D) in the corpus callosum (including the external capsule). There is a strong and statistically significant correlation between susceptibility and LFB contrast (R2=0.9329, p=0.0036). The other three correlations are weak and statistically insignificant (p > 0.05).
Figure 9.
Figure 9. Correlation of MRI quantities with histology. (A) Correlation of susceptibility contrast vs. LFB; (B) susceptibility vs. PPB; (C) mean diffusivity vs. LFB and (D) mean diffusivity vs. PPB. Strong correlation was observed for susceptibility vs. LFB (A).
Discussion
In this study, we evaluated the temporal evolution of magnetic susceptibility in the white matter of mouse C57BL/6 from PND2 to PND56. We have several key findings: 1) magnetic susceptibility becomes increasingly diamagnetic as the brain develops; 2) MSA increases monotonically as a function of age; 3) there is a sign change for susceptibility around the third week; and 4) diamagnetic susceptibility is highly correlated with myelin staining intensity. While this study further confirms myelin as the dominant source of the diamagnetism in brain white matter, it provides the first experimental evidence of developmentally evolving MSA. Both susceptibility and MSA indicate a characteristic structural change in the white matter around the 3rd week postnatal. These findings suggest that susceptibility imaging may complement other MRI techniques, such as DTI, T2 quantification and magnetization transfer, to provide a more complete picture of brain development.
Diffusion and susceptibility changes in brain development
DTI is a powerful tool for depicting white matter changes during brain development (Mori and Zhang, 2006). DTI parameters such as FA, mean diffusivity and radial diffusivity are sensitive to macroscopic changes in fiber tracts involving coherence and compaction as well as microscopic changes such as intracellular components and fiber thickness (Beaulieu, 2002; Neil et al., 2002). It is generally reported that during brain maturation mean diffusivity decreases while FA increases (Bockhorst et al., 2008; Chahboune et al., 2007). The changes in FA observed here (Fig. 3) agree with previous findings (Baloch et al., 2009) that show an increase from 0.5 to 0.6 for CC and AC. In addition, we observed a small decline of FA in FS at PND7. Similarly, a small drop of FA around PND12 in live mice was also reported in (Larvaron et al., 2007) and around PND7 in (Baloch et al, 1991). We also observed consistently lower diffusivity in all three white matter regions at PND7. However, this was only a single time point. More time points will be needed to verify the physiological significance. A dip in diffusivity accompanied by increased FA (in CC and AC) would seem to suggest potential effects of axon pruning and/or apoptosis on top of myelination (Bockhorst et al., 2008). These results indicate that while it is generally true that during white matter maturation diffusivity decreases and anisotropy increases, the detailed picture may vary due to the competing biological processes affecting diffusion properties. Although it is sometimes tempting to link changes in DTI solely to myelination during development, the evidence in the literature indicates that it would certainly be an oversimplification.
While the color coded FA maps (Fig. 1) shows visually small variations in white matter orientation, the changes of magnetic susceptibility is dramatic (Fig. 4). The color-coded FA maps indicate that axonal orientation is well organized in major white matters even as early as PND2, although it is clear that the brains were not well myelinated in the first three weeks of age. This will support the idea that diffusion FA does not primarily originate from myelination; rather it’s from the axon itself. This is consistent with early findings that FA is only reduced by about 10% in the shiverer mouse, in which myelin is nearly absent (Liu et al., 2011). Histological data also did not reveal significant correlation between diffusion and myelination in this age range (Fig. 9C). On the other hand, the increasing diamagnetism correlates very well (R2 = 0.93) with the increase of myelin as depicted by LFB staining (Fig. 9). Because of this strong correlation, magnetic susceptibility is able to differentiate the rates of myelination for different structures as illustrated by Fig. 5B. The myelination process for CC appears to be much slower compared to AC and FS.
Brain volume change may also play a role in affecting tissue magnetic susceptibility especially during early brain development when the brain volume increases rapidly (Holmes-Hampton et al., 2012). The rapid growth in volume may explain the decline of LFB staining around PND7 (Fig. 7D). Rapid volume increase accompanied by increased water content could lead to a paramagnetic shift of the apparent magnetic susceptibility (Fig. 5B), as lipids and proteins are more diamagnetic relative to water.
Development of MSA and myelination
Our study also revealed a striking difference between diffusion anisotropy and susceptibility anisotropy in their respective developmental timelines. While diffusion anisotropy is already well developed at PND2 (~0.5 at PND2 vs. ~0.6 at PND56) (Fig. 3), susceptibility anisotropy only become significant around the third week postnatal (Fig. 6C). This dramatic difference supports the notion that diffusion anisotropy and susceptibility anisotropy are governed by different microstructural components. This is consistent with the report by Li et al who showed a lack of correlation between diffusion anisotropy and susceptibility anisotropy in the adult human brain at 7T (Li et al., 2012).
During the first 4 weeks of mouse postnatal brain development, axons go through rapid myelination. Myelin at the molecular level, as most biomolecules, is known to have anisotropic magnetic susceptibility which is used to determine structures in NMR and EPR spectroscopy (Bertini et al., 2002). In the white matter, the ordered arrangement of myelin lipids results in a macroscopic magnetic susceptibility anisotropy that is measurable on a voxel level. This macroscopic manifestation is due to the cylindrical pattern of the phospholipid bilayers which align around the axons during maturation. The continuing myelination process enables us to observe the increase in anisotropy as it is represented by the increase of the slope in the successive plots of Fig.6C. According to Li et al (Li et al., 2012), MSA is related to the molecular susceptibility of myelin lipids (χm) following where flipid is the volume fraction of myelin lipids, χ0 is the baseline susceptibility due to choice of frame of reference and isotropic susceptibility effects.
The magnitude of MSA during the first two weeks is about 10 times smaller than that at PND22. One interesting observation is the slightly negative MSA during early brain development (first two weeks) (Table 1). The reversed sign coincides with the paramagnetic appearance (opposite of that at PND22 and beyond) in the white matter during the same period. Future experiments will be needed to further verify the existence of negative MSA during this early period of brain development.
The role of iron in the white matter
Iron has been considered the main source of paramagnetic susceptibility in deep brain nuclei (Haacke et al., 2005; Hopp et al., 2010; Schweser et al., 2011; Zheng et al., 2013). We initially considered the possibility of iron contributing to the apparent paramagnetic susceptibility and slightly negative but close to zero MSA during the first two weeks of brain development. However, neither iron staining nor EDS seems to support this hypothesis. It is apparent that very little iron is present. With our current staining protocol, iron staining with Perl’s Prussian Blue remains pink and doesn’t turn blue because there is so little iron. A counter-stain such as eosin was not used. Future studies will require improved staining protocols. Nevertheless, the level of iron is so low that it is below the 0.1% detectability threshold of EDS. As can be seen from Fig. 8C, iron is not present in the histogram at its expected K-alpha 6.4 keV energy level. Although iron levels in human brain tissues have been measured with x-ray based spectroscopy or mass spectrometry (Stueber et al., 2012, Schweser et al., 2010b, Zheng et al., 2013), iron concentration can be 10 times lower in the rodent brain (Connor and Benkovic, 1992). This is consistent with the report that iron concentrations in the human brain correlate with QSM much better (R2=0.81) than in the mouse brain (Hopp et al., 2010).
Limitations
Magnetic susceptibility measured by MRI is relative; it is affected by the RF carrier frequency and phase filtering procedures. While previous studies have used CSF or white matter as internal reference, the rapidly changing nature of early brain development makes them unsuitable as stable reference. Clearly, myelination changes the susceptibility of white matter. Recent studies have also shown rapidly changing molecular content in CSF during early brain development (Falcao et al., 2012; Lehtinen et al., 2011). Although our data indicate more diamagnetic CSF relative to the parenchyma towards early ages, we cannot exclude the possibility of contamination by the fixative and soaking solutions. Because of these concerns, we decided to use the mean value of the whole brain as the reference. Given the large volume of the brain, the mean value is likely to be more stable. Nevertheless, reference remains an unresolved issue in quantifying susceptibility. However, MSA is not affected by reference.
Luxol Fast Blue and Perl’s Prussian blue staining, although commonly used, are not quantitative or absolute measures of molecular concentration. They are also affected by staining agent density and durations of reaction. More sensitive iron staining protocols are also needed to detect low levels of iron to better understand its roles in white matter. Due to the labor intensive nature of histological analysis, we are only able to acquire a limited number of slices instead of the whole brain. In addition, shearing and tearing of the thin sliced tissue is common. As a result, we were only able to visually match histological slices with MRI. Future studies may benefit from registering a stack of histological slices with MRI in 3D. Nevertheless, this serves as an indication of the potential advantage of QSM for studying myelination in brain development as it is noninvasive and can be applied both ex vivo and in vivo.
Conclusion
Our study of quantitative susceptibility mapping in developing mouse brains revealed a transition from paramagnetic susceptibility to diamagnetic susceptibility relative to gray matter in major white matter fiber bundles. It revealed further a characteristic developmental trajectory of magnetic susceptibility anisotropy where significant anisotropy starts to appear during the third week postnatal. This characteristic evolution of susceptibility and susceptibility anisotropy reflects myelination and structural changes in the white matter. Mapping those changes could potentially be applied in vivo to study pathologies related to myelination and microstructure.
Supplementary Material
Acknowledgement
This study is supported in part by the National Institutes of Health (NIH) through grants NIBIB P41 EB015897, R01 MH096979 and by the National Multiple Sclerosis Society (RG4723). The authors thank discussions with Carlo Pierpaoli, MD, PhD, on the origins of the apparent paramagnetic susceptibility during early brain development.
Footnotes
Publisher's Disclaimer: This is a PDF file of an unedited manuscript that has been accepted for publication. As a service to our customers we are providing this early version of the manuscript. The manuscript will undergo copyediting, typesetting, and review of the resulting proof before it is published in its final citable form. Please note that during the production process errors may be discovered which could affect the content, and all legal disclaimers that apply to the journal pertain.
References
- Baloch S, Verma R, Huang H, Khurd P, Clark S, Yarowsky P, Abel T, Mori S, Davatzikos C. Quantification of brain maturation and growth patterns in C57BL/6J mice via computational neuroanatomy of diffusion tensor images. Cerebral cortex (New York, N.Y.: 1991) 2009;19:675–687. doi: 10.1093/cercor/bhn112. [DOI] [PMC free article] [PubMed] [Google Scholar]
- Basser PJ, Pierpaoli C. Microstructural and physiological features of tissues elucidated by quantitative-diffusion-tensor MRI. Journal of magnetic resonance. Series B. 1996;111:209–219. doi: 10.1006/jmrb.1996.0086. [DOI] [PubMed] [Google Scholar]
- Beaulieu C. The basis of anisotropic water diffusion in the nervous system - a technical review. NMR in biomedicine. 2002;15:435–455. doi: 10.1002/nbm.782. [DOI] [PubMed] [Google Scholar]
- Bender B, Klose U. The in vivo influence of white matter fiber orientation towards B(0) on T2* in the human brain. NMR in biomedicine. 2010;23:1071–1076. doi: 10.1002/nbm.1534. [DOI] [PubMed] [Google Scholar]
- Bertini I, Luchinat C, Parigi G. Magnetic susceptibility in paramagnetic NMR. Progress in Nuclear Magnetic Resonance Spectroscopy. 2002;40:249–273. [Google Scholar]
- Bockhorst KH, Narayana Pa, Liu R, Ahobila-Vijjula P, Ramu J, Kamel M, Wosik J, Bockhorst T, Hahn K, Hasan KM, Perez-Polo JR. Early postnatal development of rat brain: in vivo diffusion tensor imaging. Journal of neuroscience research. 2008;86:1520–1528. doi: 10.1002/jnr.21607. [DOI] [PubMed] [Google Scholar]
- Chahboune H, Ment LR, Stewart WB, Ma X, Rothman DL. Neurodevelopment of C57B / L6 mouse brain assessed by in vivo diffusion tensor imaging. NMR in Biomedicine. 2007:375–382. doi: 10.1002/nbm.1130. [DOI] [PubMed] [Google Scholar]
- Connor JR, Benkovic Sa. Iron regulation in the brain: histochemical, biochemical, and molecular considerations. Annals of neurology. 1992;32(Suppl):S51–S61. doi: 10.1002/ana.410320710. [DOI] [PubMed] [Google Scholar]
- Duyn JH, van Gelderen P, Li T-Q, de Zwart Ja, Koretsky AP, Fukunaga M. High-field MRI of brain cortical substructure based on signal phase. Proceedings of the National Academy of Sciences of the United States of America. 2007;104:11796–11801. doi: 10.1073/pnas.0610821104. [DOI] [PMC free article] [PubMed] [Google Scholar]
- Falcao AM, Marques F, Novais A, Sousa N, Palha JA, Sousa JC. The path from the choroid plexus to the subventricular zone: go with the flow! Front Cell Neuroscience. 2012;6:34. doi: 10.3389/fncel.2012.00034. [DOI] [PMC free article] [PubMed] [Google Scholar]
- Haacke EM, Cheng NYC, House MJ, Liu Q, Neelavalli J, Ogg RJ, Khan A, Ayaz M, Kirsch W, Obenaus A. Imaging iron stores in the brain using magnetic resonance imaging. Magnetic resonance imaging. 2005;23:1–25. doi: 10.1016/j.mri.2004.10.001. [DOI] [PubMed] [Google Scholar]
- He X, Yablonskiy Da. Biophysical mechanisms of phase contrast in gradient echo MRI. Proceedings of the National Academy of Sciences of the United States of America. 2009;106:13558–13563. doi: 10.1073/pnas.0904899106. [DOI] [PMC free article] [PubMed] [Google Scholar]
- Holmes-Hampton GP, Chakrabarti M, Cockrell AL, McCormick SP, Abbott LC, Lindahl LS, Lindahl Pa. Changing iron content of the mouse brain during development. Metallomics: integrated biometal science. 2012;4:761–770. doi: 10.1039/c2mt20086d. [DOI] [PMC free article] [PubMed] [Google Scholar]
- Hopp K, Popescu BFG, McCrea RPE, Harder SL, Robinson Ca, Haacke ME, Rajput AH, Rajput A, Nichol H. Brain iron detected by SWI high pass filtered phase calibrated with synchrotron X-ray fluorescence. Journal of magnetic resonance imaging: JMRI. 2010;31:1346–1354. doi: 10.1002/jmri.22201. [DOI] [PMC free article] [PubMed] [Google Scholar]
- Jenkinson M, Bannister P, Brady M, Smith S. Improved Optimization for the Robust and Accurate Linear Registration and Motion Correction of Brain Images. NeuroImage. 2002;17:825–841. doi: 10.1016/s1053-8119(02)91132-8. [DOI] [PubMed] [Google Scholar]
- Johnson G, Cofer G, Gewalt S, Hedlund L. Morphologic Phenotyping with MR Microscopy: The Visible Mouse1. Radiology. 2002 doi: 10.1148/radiol.2223010531. [DOI] [PubMed] [Google Scholar]
- Larvaron P, Boespflug-tanguy O, Renou J, Bonny J. In vivo analysis of the post-natal development of normal mouse brain by DTI. Gene. 2007:413–421. doi: 10.1002/nbm.1082. [DOI] [PubMed] [Google Scholar]
- Lee J, Shmueli K, Fukunaga M, van Gelderen P, Merkle H, Silva AC, Duyn JH. Sensitivity of MRI resonance frequency to the orientation of brain tissue microstructure. Proceedings of the National Academy of Sciences of the United States of America. 2010;107:5130–5135. doi: 10.1073/pnas.0910222107. [DOI] [PMC free article] [PubMed] [Google Scholar]
- Lehtinen MK, Zappaterra MW, Chen X, Yang YJ, Hill AD, Lun M, Maynard T, Gonzalez D, Kim S, Ye P, D'Ercole AJ, Wong ET, LaMantia AS, Walsh CA. The cerebrospinal fluid provides a proliferative niche for neural progenitor cells. Neuron. 2011;69:893–905. doi: 10.1016/j.neuron.2011.01.023. [DOI] [PMC free article] [PubMed] [Google Scholar]
- Li W, Wu B, Avram AV, Liu C. Magnetic susceptibility anisotropy of human brain in vivo and its molecular underpinnings. NeuroImage. 2012;59:2088–2097. doi: 10.1016/j.neuroimage.2011.10.038. [DOI] [PMC free article] [PubMed] [Google Scholar]
- Li W, Wu B, Batrachenko A, Bancroft-Wu V, Morey RA, Shashi V, Langkammer C, de Bellis MD, Ropele S, Song AW, Liu C. Differential developmental trajectories of magnetic susceptibility in human brain gray and white matter over lifespan. Human Brain Mapping. doi: 10.1002/hbm.22360. in press. [DOI] [PMC free article] [PubMed] [Google Scholar]
- Li W, Wu B, Liu C. Quantitative susceptibility mapping of human brain reflects spatial variation in tissue composition. NeuroImage. 2011;55:1645–1656. doi: 10.1016/j.neuroimage.2010.11.088. [DOI] [PMC free article] [PubMed] [Google Scholar]
- Li X, Vikram DS, Lim IAL, Jones CK, Farrell JaD, van Zijl PCM. Mapping magnetic susceptibility anisotropies of white matter in vivo in the human brain at 7 T. NeuroImage. 2012;62:314–330. doi: 10.1016/j.neuroimage.2012.04.042. [DOI] [PMC free article] [PubMed] [Google Scholar]
- Liu C. Susceptibility tensor imaging. Magnetic resonance in medicine : official journal of the Society of Magnetic Resonance in Medicine / Society of Magnetic Resonance in Medicine. 2010;63:1471–1477. doi: 10.1002/mrm.22482. [DOI] [PMC free article] [PubMed] [Google Scholar]
- Liu C, Li W, Johnson GA, Wu B. High-field (9.4T) MRI of brain dysmyelination by quantitative mapping of magnetic susceptibility. NeuroImage. 2011;56:930–938. doi: 10.1016/j.neuroimage.2011.02.024. [DOI] [PMC free article] [PubMed] [Google Scholar]
- Lodygensky Ga, Marques JP, Maddage R, Perroud E, Sizonenko SV, Hüppi PS, Gruetter R. In vivo assessment of myelination by phase imaging at high magnetic field. NeuroImage. 2012;59:1979–1987. doi: 10.1016/j.neuroimage.2011.09.057. [DOI] [PubMed] [Google Scholar]
- Lu H, Ge Y. Quantitative evaluation of oxygenation in venous vessels using T2-Relaxation-Under-Spin-Tagging MRI. Magnetic resonance in medicine : official journal of the Society of Magnetic Resonance in Medicine / Society of Magnetic Resonance in Medicine. 2008;60:357–363. doi: 10.1002/mrm.21627. [DOI] [PMC free article] [PubMed] [Google Scholar]
- Luo J, He X, d’Avignon DA, Ackerman JJH, Yablonskiy Da. Protein-induced water 1H MR frequency shifts: contributions from magnetic susceptibility and exchange effects. Journal of magnetic resonance (San Diego, Calif. 1997) 2010;202:102–108. doi: 10.1016/j.jmr.2009.10.005. [DOI] [PMC free article] [PubMed] [Google Scholar]
- Mori S, Zhang J. Principles of diffusion tensor imaging and its applications to basic neuroscience research. Neuron. 2006;51:527–539. doi: 10.1016/j.neuron.2006.08.012. [DOI] [PubMed] [Google Scholar]
- Neil J, Miller J, Mukherjee P, Hüppi PS. Diffusion tensor imaging of normal and injured developing human brain - a technical review. NMR in biomedicine. 2002;15:543–552. doi: 10.1002/nbm.784. [DOI] [PubMed] [Google Scholar]
- Rauscher A, Sedlacik J, Barth M, Mentzel H-J, Reichenbach JR. Magnetic susceptibility-weighted MR phase imaging of the human brain. AJNR. American journal of neuroradiology. 2005;26:736–742. [PMC free article] [PubMed] [Google Scholar]
- Salomir R, de Senneville BD, Moonen CT. A fast calculation method for magnetic field inhomogeneity due to an arbitrary distribution of bulk susceptibility. Concepts in Magnetic Resonance. 2003;19B:26–34. [Google Scholar]
- Schäfer A, Wharton S, Gowland P, Bowtell R. Using magnetic field simulation to study susceptibility-related phase contrast in gradient echo MRI. NeuroImage. 2009a;48:126–137. doi: 10.1016/j.neuroimage.2009.05.093. [DOI] [PubMed] [Google Scholar]
- Schäfer A, Wiggins CJ, Turner R. Understanding the orientation dependent T2 * contrast of the cingulum in ultra high fields Introduction : Methods : Magnetic resonance in medicine: official journal of the Society of Magnetic Resonance in Medicine / Society of Magnetic Resonance in Medicine. 2009b;17:49. [Google Scholar]
- Schweser F, Deistung A, Lehr BW, Reichenbach JR. Differentiation between diamagnetic and paramagnetic cerebral lesions based on magnetic susceptibility mapping. Medical Physics. 2010a;37:5165. doi: 10.1118/1.3481505. [DOI] [PubMed] [Google Scholar]
- Schweser F, Deistung A, Lehr BW, Reichenbach JR. Quantitative imaging of intrinsic magnetic tissue properties using MRI signal phase: An approach to in vivo brain iron metabolism? NeuroImage. 2010b;54:2789–2807. doi: 10.1016/j.neuroimage.2010.10.070. [DOI] [PubMed] [Google Scholar]
- Schweser F, Deistung A, Lehr BW, Sommer K, Reichenbach JR. SEMI-TWInS: Simultaneous Extraction of Myelin and Iron using a T 2 * -Weighted Imaging Sequence. 2011;104:11796. [Google Scholar]
- Schweser F, Lehr B. A novel approach for separation of background phase in SWI phase data utilizing the harmonic function mean value property. Vol. 18. Sweden: Stockholm; 2010. p. 2010. [Google Scholar]
- Shmueli K, de Zwart Ja, van Gelderen P, Li T-Q, Dodd SJ, Duyn JH. Magnetic susceptibility mapping of brain tissue in vivo using MRI phase data. Magnetic resonance in medicine: official journal of the Society of Magnetic Resonance in Medicine / Society of Magnetic Resonance in Medicine. 2009;62:1510–1522. doi: 10.1002/mrm.22135. [DOI] [PMC free article] [PubMed] [Google Scholar]
- Stueber C, Schaefer A, Waehnert M, Vogt J. Iron and Myelin in Human Brain Tissue: Histology, PIXE and Ultra-High-Field MRI Susceptibility Maps. 2012:23–24. ww4.aievolution.com. [Google Scholar]
- Yushkevich Pa, Piven J, Hazlett HC, Smith RG, Ho S, Gee JC, Gerig G. User-guided 3D active contour segmentation of anatomical structures: significantly improved efficiency and reliability. NeuroImage. 2006;31:1116–1128. doi: 10.1016/j.neuroimage.2006.01.015. [DOI] [PubMed] [Google Scholar]
- Zheng W, Nichol H, Liu S, Cheng Y-CN, Haacke EM. Measuring iron in the brain using quantitative susceptibility mapping and X-ray fluorescence imaging. NeuroImage. 2013;78C:68–74. doi: 10.1016/j.neuroimage.2013.04.022. [DOI] [PMC free article] [PubMed] [Google Scholar]
- Zhong K, Ernst T, Buchthal S, Speck O, Anderson L, Chang L. Phase contrast imaging in neonates. NeuroImage. 2011;55:1068–1072. doi: 10.1016/j.neuroimage.2010.11.086. [DOI] [PMC free article] [PubMed] [Google Scholar]
- Zhong K, Leupold J, von Elverfeldt D, Speck O. The molecular basis for gray and white matter contrast in phase imaging. NeuroImage. 2008;40:1561–1566. doi: 10.1016/j.neuroimage.2008.01.061. [DOI] [PubMed] [Google Scholar]
Associated Data
This section collects any data citations, data availability statements, or supplementary materials included in this article.


