

Abstract
In this paper, we establish the mathematical framework of a novel imaging technique, namely Photo-magnetic Imaging (PMI). PMI uses laser to illuminate biological tissues and measure the induced temperature variations using magnetic resonance imaging (MRI). PMI overcomes the limitation of conventional optical imaging and allows imaging of optical contrast at MRI spatial resolution. The image reconstruction for PMI, using a finite element-based algorithm with iterative approach, is presented in this paper. The quantitative accuracy of PMI is investigated for various inclusion sizes, depths and absorption values. Then, a comparison between conventional Diffuse Optical Tomography (DOT) and PMI is carried out to illustrate the superior performance of PMI. An example is presented showing that two 2 mm diameter inclusions embedded 4.5 mm deep and located side by side in a 25 mm diameter circular geometry medium is recovered as a single 6 mm diameter object with DOT. However, these two objects are not only effectively resolved with PMI, but their true concentration are also recovered successfully.
3.1 Introduction
Diffuse Optical Tomography (DOT) is a non-invasive imaging modality that uses near-infrared (NIR) light to investigate mainly tissue absorption properties. By using multi-wavelength measurements, the spatial distribution of a number of physiologically significant chromophores, mainly water, fat, oxy- and deoxyhemoglobin can be obtained using DOT (Corlu et al., 2005; Wang et al., 2006; Srinivasan et al., 2005). Therefore, DOT can provide valuable functional information such as total hemoglobin and oxygen saturation maps with high sensitivity. Due to this reason, recent advances have led DOT to a variety of applications, in particular imaging of the breast cancer (Brooksby et al., 2006; Culver et al., 2003; Durduran et al., 2002; Intes et al., 2003; Dierkes et al., 2005; Tromberg et al., 2008; Fang et al., 2010; Zhu et al., 2010). For example, total hemoglobin concentration was found to be three to four fold higher while the oxygen saturation levels were lower compared to the normal tissue (Blyschak et al., 2004; Srinivasan et al., 2003).
Despite its high sensitivity in providing valuable functional information, the spatial resolution of DOT remains low. First, the ill-posedness of the DOT inverse problem makes its solution non-unique and sensitive to measurement noise (Arridge, 1999b). In addition, the number of measurements is usually much less than the number of unknowns making the problem further under-determined. One of the reasons that the DOT inverse problem is ill-posed and underdetermined is that the measurements can only be obtained from the boundary. It would be ideal if internal measurements could be obtained non-invasively. For example, it has been demonstrated that internal measurements significantly improve the reconstruction performance of MRI-Electrical Impedance Tomography (MR-EIT) (Woo and Seo, 2008; Seo et al., 2005). In this work, we introduce a new method of obtaining internal measurements for optical imaging and demonstrate that the spatial resolution is remarkably improved.
When tissue absorbs light, photon energy is transformed into heat. Formerly, this effect has led to the development of photoacoustic imaging that can provide the same functional information with conventional diffuse optical imaging but at ultrasound resolution (∼1mm) (Li and Wang, 2009). In photoacoustic tomography (PAT), a short-pulsed laser is used to irradiate the sample. The sound wave produced by the thermo-elastic expansion of the tissue is a result of transformation of the photon energy from the incident laser light to thermal energy. The sound wave is then detected using ultrasound transducers at the boundary. PAT is becoming a widespread optical imaging modality because it provides optical functional contrast with ultrasound's high spatial resolution (Changhui and Lihong, 2009; Yao and Wang, 2011; Filonov et al., 2012; Akers et al., 2012). In PAT, the ultrasound pressure map is first reconstructed, and then the thermal energy from laser irradiation is considered to be proportional to the pressure map. On the other hand, it could be ideal if the temperature increase from laser irradiation could be measured directly.
For that purpose, we explored the feasibility of using MRI to obtain temperature distribution spatially and temporally, a technique termed MR thermometry. It has been successfully used to monitor the temperature rise during ablation therapy (McDannold and Jolesz, 2000). Proton resonance frequency (PRF)-based methods are the most widely used MR thermometry techniques due to their sensitivity, independency of different tissue types and speed (up to 10 frames per second) (Kickhefel et al., 2010). Using a phase sensitive MRI sequence such as gradient echo, asymmetric spin echo or echo planar imaging (EPI), the phase change accumulated between excitation and data acquisition (i.e. the TE time) is directly related to the temperature change between these two times (Kickhefel et al., 2010; Rieke and Butts Pauly, 2008).
In this paper, we present the theoretical framework of an entirely new imaging modality, Photo Magnetic Imaging (PMI). For this technique, photon migration is modeled by the diffusion equation in conventional DOT, while heat transfer is modeled by a Pennes bio-heat transfer equation (Wissler, 1998). After establishing the forward and inverse problem for the first time in this work, we first carry out a simulation study to determine the optimum temperature measurement strategy for PMI. Then we evaluate the size, depth and concentration dependence of PMI. Finally, we compare the spatial resolution of PMI and DOT using two absorptive inclusions located side by side.
3.2 Method
2.1 The forward problem
The forward problem of PMI mainly consists of two steps: (1) laser light propagation in tissue, and (2) thermal propagation in tissue due to the laser heating. The photon propagation in tissue can be described using a diffusion equation (Arridge, 1999a):
| (1) |
where Φ(r) is the photon density (W/mm2). The reduced scattering and the absorption coefficients of the medium are represented as μs′ (mm-1) and μa (mm-1), respectively. The diffusion coefficient (mm-1) is defined by D(r) = 1/3(μa +μs′). The light source distribution is represented by S(r). The thermal energy absorbed from the laser heating depends on the light fluence rate and the absorption distribution and can be written as (Diaz et al., 2001):
| (2) |
The Pennes' bio-heat thermal model is used to describe the temperature distribution dynamics (Wissler, 1998):
| (3) |
where the density (g/mm3), specific heat (J/(g·°C)) and thermal conductivity (W/(mm·°C)) of tissue are represented as ρ, c and k, respectively. The second term on the right side of the equation represents the blood perfusion term where, ωb is the blood perfusion rate (g/(mm3·s)), cb is the blood specific heat (J/(g·°C)) and Ta is the supplying arterial blood temperature (°C). The third term on the right side of the equation is the external energy input term, which is the thermal energy (W/mm3) due to the laser irradiation E(r). In the current stage of development, the heat sink term ωbcb(T(r)-Ta) is neglected to simplify the problem. The main purpose of the investigation in this paper is to 1) establish the forward and inverse solver for the PMI technique and 2) optimize the phantom experiment parameters through simulations in the absence of blood perfusion. In the future in vivo studies, the blood perfusion term can be determined for different tissue types according to literature values.
The boundary condition for heat transfer is very complex. In this study, we consider only heat convection at the boundary, which is:
| (4) |
where h is the heat transfer coefficient (W/(mm2·°C)) between the surface of the medium and the surrounding medium at temperature Tf (°C).
A finite element method (FEM) is used to solve the time-dependent partial differential equation numerically. FEM has been used to solve bio-heat model for various application such as HIFU, conformal transurethral ultrasound therapy and laser ablation (Marqa et al., 2011; Mathieu et al., 2010; Burtnyk et al., 2009). We assume the surrounding phantom temperature (Tf) to be room temperature 22 °C. To simplify the formation of the weak form of the heat transfer equation, let
| (5) |
Integrate by parts and replace the boundary integral by boundary condition Eq (4), the weak form then can be expressed as:
| (6) |
where the solution of temperature is expanded in FEM basis as: . The test function is chosen to be a piecewise linear function. The time step is chosen to be one second. The numerical solver is implemented in MATLAB, and the software is carried out on a customized core 2 duo 3.0 GHz single-board computer equipped with 8 GB of memory.
2.2 The inverse problem
The inverse problem for photo-magnetic imaging is solved by minimizing the difference between the measured temperature and calculated temperature map from forward solver according to the following objective function:
| (7) |
Here, i represents the number of sources and j represents the number of temperature measurements. First, the synthetic MRI measurement data (Tijm) from the forward solver is created. Then the error function is minimized between the synthetic data and the calculated temperature measurement from the forward solver (Pij(μa)) using the spatial distribution of μa. To avoid inverse crime, different meshes are used for forward and inverse solver. Experimentally, the laser-induced heating is measured using a MR thermometry technique. Briefly, a laser is used to illuminate and heat the medium inside the MRI. Dynamic MR phase maps are obtained before, during and after heating to monitor spatially and temporally varying temperature. This temperature change is directly proportional to the optical energy absorbed at each point and thereby provides optical absorption contrast (Thayer et al., 2012).
We iteratively update the unknown μa using Levenberg-Marquardt method by
| (8) |
where for PMI. X represents the unknown matrix of μa, whose dimension is N. N represents the number of nodes in the FEM mesh. The Jacobian matrix J is calculated numerically.
In all simulation studies, a dual mesh method is used to reduce the computational time. A fine mesh (4225 nodes and 8192 elements) is used for forward solver, while a coarse mesh (1089 nodes and 2048 elements) is used for inverse problem. The forward and inverse solvers for DOT have been explained in previous works (Arridge, 1999a; Lin and et al., 2007).
2.3 Simulation Studies
Three simulation studies were undertaken to demonstrate the feasibility of PMI technique. Mice-sized 25 mm diameter circular phantom geometry was used. The background absorption and scattering coefficient of the phantoms was set to 0.010 mm-1 and 0.85 mm-1, respectfully to simulate small animal tissue. Inclusions with different sizes located at various depths were used. The density and specific heat of the phantom was set to be the same as water values, 1000 kg/m3 and 4200 J/(kg.C°), and the thermal conductivity, k, was set to be 0.5×10⁻³ W/(mm·°C). We adopted the laser power, wavelength and illumination pattern from our previous experiments (Thayer et al., 2012).
For PMI, an area illumination pattern was employed to irradiate a 25 mm diameter circular object from surface (Figure 1.a). The synthetic temperature measurements were generated with the following steps. First, photon density distribution in the medium was calculated using Eq (1). After that, the thermal energy deposition due to the photons propagating in the tissue was calculated using Eq (2). Finally, the temperature map at a certain time point of the medium was calculated using Eq (3) and Eq (4).
Figure 1.

The laser irradiation pattern for PMI and DOT and the FEM mesh used for simulations (coarse mesh for reconstruction). (a) In PMI, an area illumination pattern was used to irradiate the phantom. MR thermometry map is acquired across the entire imaging area, and each nodal point on the mesh is selected as the detector position for temperature measurement. (b) 8-source and 8-detector positions equally spaced over 360 degrees were used for DOT.
The PMI technique was compared with conventional DOT reconstruction in Results section 3.3. The source and detector geometry was different for DOT and PMI. For DOT, 8-source and 8-detector positions equally spaced over 360 degrees were used, as shown in Figure 1.b. Such geometry was adopted from our previous development of a MRI-compatible DOT system. More details can be found in our previous publications (Lin et al., 2011). To generate the synthetic optical measurements, the photon density distribution was calculated using Eq (1), yielding 64 continuous wave amplitude measurements. Laser illumination geometry used for PMI and DOT are different. DOT is most optimized for spatial resolution using circular point illumination (Pogue et al., 1999), while area illumination in PMI allows the maximum heating without exceeding American National Standards Institute (ANSI) limits.
3. Results
3.1 Measurement points selection
Theoretically, a series of temperature maps can be obtained throughout the laser heating and cooling period. The aim of this study is to determine the optimum measurement points. The inclusion size is 2 mm and located 7 mm away from the center the object. The absorption coefficient of the inclusion is 0.02 mm-1, which make the target to background contrast 2. The object is heated with laser for ten seconds. Then the laser is turned off and the object is allowed to cool down in room temperature for another 25 seconds.
The temperature profile at the center of the inclusion is plotted in Figure 2. Due to the limitation of ANSI limit, the temperature increase is only around 1.5 °C, indicating PMI is a safe imaging modality. Six cases were used to determine how the selection of measurement time point affects the reconstruction result. The first five cases were chosen at t = 5s, 10s, 15s, 20s and 30s, indicated as P1, P2, P3, P4 and P5 in Figure 2 and 3, respectively. The corresponding temperature difference map, which was generated by subtracting the temperature map from the baseline temperature at t=0, is also shown in the first column of Figure 3. For the sixth case, the temperature measurements at both P2 and P3 were used for reconstruction.
Figure 2.

The temperature profile at the center of the inclusion plotted at different time points. P1 and P2 are acquired at the heating duration, while P3, P4 and P5 are acquired at the cooling period.
Figure 3.

The result for simulation study section 3.1. The left column is the temperature increase at the selected temperature measurement point. The right column is the reconstructed absorption map for the six cases. The recovered mean absorption coefficient for the inclusion is listed beside the reconstructed images. The percentage indicates that the heat diffusion can diminish the quantitative accuracy if the measurements are acquired during the laser-off phase.
The reconstructed absorption maps from the six cases are shown in the second column of Figure 3. The recovered absorption coefficient of the inclusion is also listed next to the reconstructed maps. As shown in the first and second cases, when the measurement point is selected while the laser is on, the full width half maximum of reconstructed inclusion size is 3 mm, and the mean absorption coefficient is recovered to 95% of the true value. However, when the measurement point is selected after the laser is turned off, the size of the reconstructed inclusion increases and the accuracy of the recovered absorption value decreases. For instance, the concentration of the inclusion can be recovered to 85% of the true value if the temperature measurement is taken 5 seconds after the laser is turned off (P3). However, the recovered concentration reduces to 65% of the true value if the temperature measurement is taken 15 seconds after the laser is turned off (P5). The result shows that the longer we wait to perform the measurement, the less accurate the reconstructed absorption value is.
Furthermore, we explored whether using temporal evolution of the signal, i.e. utilizing measurements at multiple time points simultaneously, can improve the accuracy. One measurement (P2) during the laser-on phase and the other one (P3) during the laser-off phase were both selected for reconstruction in the sixth case. As shown in the last row of Figure 3, the recovered inclusion size is again 3 mm while the absorption coefficient can be recovered up to 95% of the true value. The result shows that as long as at least one measurement is acquired during laser-on phase, the inclusion can be accurately recovered.
The result implies that the heat diffusion can diminish the quantitative accuracy and spatial resolution of PMI especially if the measurements are acquired during the laser-off phase. The longer measurement is performed after the laser is turned off, the less accurate the reconstructed absorption value is. The best temperature measurements for PMI should be taken during the laser heating phase to minimize the thermal diffusion. Based on this result, the following simulation studies in Result section 2.2 and 2.3 are carried out by selecting the temperature measurements at P2.
3.2 Size, depth and concentration dependence
In this study, again, the inclusion is embedded in a 25 mm object and the contrast to background ratio is set to be two for Cases 1-3 and four for Case 4. First, inclusions located 7 mm off the center were reconstructed for two sizes, 2 mm and 4 mm (Cases 1 and 2). Then 2 mm diameter inclusions were reconstructed at two different depths, 7 mm and 4 mm off the center (Cases 1 and 3).
The recovered absorption coefficient of the inclusion is listed in Figure 4 below the reconstructed absorption maps. The percentage value for recovered absorption is also shown in the figure. For PMI, the recovered inclusion absorption coefficient is independent of inclusion size and location. The absorption of the inclusion is recovered to at least 95% of the true value for all the cases. As reported in the literature, the recovered absorption coefficient of an inclusion is highly dependent on its size and depth for conventional optical imaging modalities such as DOT, Fluorescence Tomography and Bioluminescence Tomography (Kepshire et al., 2007; Lin et al., 2010; Lin and et al., 2011; Pogue et al., 2006; Davis et al., 2005). In contrast, through the internal measurements acquired in PMI, the size and depth dependence is alleviated, and thus better quantitative accuracy is achieved.
Figure 4.
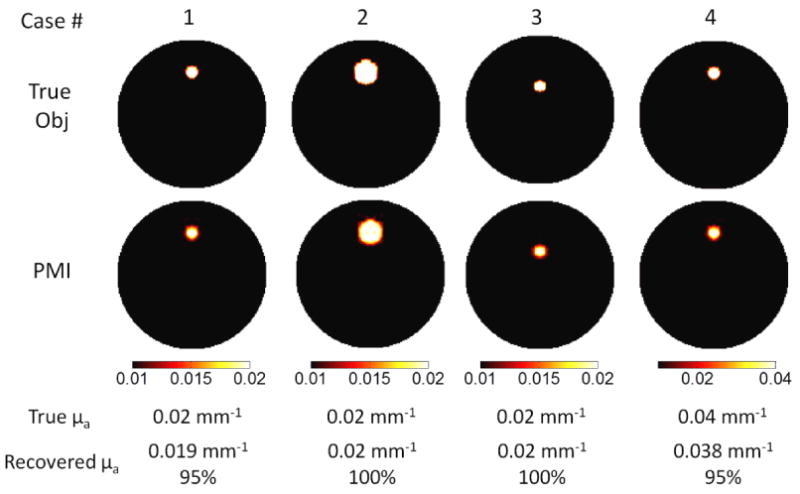
The results for simulation study section 3.2. The first row is true size, depth and concentration of the inclusion. The reconstructed absorption maps for each case are shown in the second row. The color map is scaled from 0.01 mm-1 to 0.02 mm-1 for cases 1-3, from 0.01 mm-1 to 0.04mm-1 for case 4. The unit for all the color bars is mm-1. As seen in the images, the recovered absorption coefficient does not depend on the size, depth and concentration of the inclusion. The recovered absorption coefficient is listed below the reconstructed images. The percentage indicates that the size and depth dependence for quantitative accuracy is alleviated in PMI technique.
3.3 Spatial resolution test: comparison with DOT
In the last case, we compared the PMI with conventional DOT. In this case, two 2 mm inclusions at the same depth and 1 mm apart, were present in a 25 mm diameter synthetic phantom. The absorption of both inclusions is set to be 0.03 mm-1. Both inclusions are 7.5 mm away from the center of object. The true absorption map is shown in Figure 5 (a).
Figure 5.

The results for simulation study section 3.3. The true size, depth and concentration of the inclusions are shown in (a). The reconstructed absorption maps from DOT and PMI is shown in (b) and (c), respectively. As seen in the images, the two inclusions cannot be resolved in DOT reconstruction images due to the spatial resolution limitation, while they can be well separated in PMI images.
The DOT and PMI reconstruction results are shown in Figure 5 (b) and (c). DOT cannot resolve two objects that are located close to each other due to its low spatial resolution. Instead, there appears to be one big inclusion in the reconstructed DOT image and the recovered absorption value is 0.015 mm-1 (50% of the true value). The On the contrary, inclusions are successfully separated with PMI, and their concentrations are recovered with superior quantitative accuracy, i.e. with less than 5% error (0.029 mm-1 for both inclusions).
4. Discussion and Conclusion
Extensive efforts have been spent combining DOT with other high spatial resolution anatomical imaging modalities. With such an approach, the location and size of the lesion are determined from the high resolution imaging modality and used as structural a priori to obtain more accurate functional parameters. The improved quantification or diagnostic value has been observed from hybrid systems such as combined optical and MRI, combined optical and X-ray Tomosynthesis and combined optical and ultrasound (Carpenter et al., 2007; Pogue et al., 2011; Fang et al., 2010; Zhu et al., 2010). However, the major weakness is that it loses its accuracy when the target is not visible on the anatomical image or the optical contrast does not correlate with anatomical contrast (Pogue et al., 2011). In contrast, PMI technique breaks through this limitation because the MR thermometry directly measures the temperature elevation caused by optical contrast. We have shown the feasibility of resolving optical contrast using MR thermometry in our previous exploratory work (Thayer et al., 2012). The work presented in this paper is our initial attempt to recover the quantitative value of the absorption inclusion.
High resolution optical imaging in thick tissue can also be achieved by photoacoustic tomography (PAT). The ultrasound waves scatter much less in biological tissue than optical waves and this improves the overall resolution drastically. Similarly in PMI, the photon density map is acquired using MRI, whose inverse problem is well-posed in contrast to severely ill-posed optical inverse problem. The tissue temperature will be elevated to less than 41 degrees, which is sufficient to be measured by MR thermometry, and low enough not to cause protein denaturation. Furthermore, keeping the laser power under the American National Standards Institute (ANSI) limits will enable PMI to perform in vivo. The ANSI limits are adjusted for any particular wavelength and duration of laser illumination and hence, this will alleviate any concern about tissue thermal damage. Besides, our results showed that if the images are acquired while the laser is on phase the effect of diffusion is negligible. Meanwhile, from the experiment perspective, major effort should be spent to improve the sensitivity for MR thermometry. Thayer et al (Thayer et al., 2012) has demonstrated the feasibility of PMI using 4T MRI, the sensitivity be further evaluated with 1.5 T MRI, which is more common in most hospitals.
In DOT, both absorption and scattering can be obtained using time-resolved measurements. However, it is difficult to separate them in PMI, which also occurs in PAT. Recently, Bal and Uhlmann studied the reconstruction uniqueness and stability of PAT and concluded that reconstruction stability can be guaranteed when the object is illuminated with two excitations with additional geometric constraints such as irradiation of tissue from using at least two different views (Guillaume and Gunther, 2010; Guillaume and Kui, 2011). And the Bregman method has been utilized to achieve the reconstruction of both absorption and scattering for both 2D and 3D quantitative PAT (Gao et al., 2012). However, the simultaneous reconstruction of both absorption and scattering coefficient is beyond the scope of current study.
As a conclusion, the theoretical framework of a new imaging modality, photomagnetic imaging (PMI), is demonstrated in this work. PMI combines the superior sensitivity of optical imaging and the spatial resolution of MRI. The forward and inverse problem of this new method is presented in this work and the simulation studies are performed to demonstrate the feasibility of quantitative PMI. The work presented in this study serves important guidance for designing future experiment set up.
Acknowledgments
This research is supported in part by the National Institutes of Health (NIH) grants R01EB008716, R21/33 CA120175, R01CA1429898, R21EB013387 and by Susan G. Komen Foundation training grant: KG101442.
References
- Akers WJ, Edwards WB, Kim C, Xu B, Erpelding TN, Wang LV, Achilefu S. Multimodal sentinel lymph node mapping with single-photon emission computed tomography (SPECT)/computed tomography (CT) and photoacoustic tomography. Translational Research. 2012;159:175–81. doi: 10.1016/j.trsl.2011.09.006. [DOI] [PMC free article] [PubMed] [Google Scholar]
- Arridge SR. Optical tomography in medical imaging. Inverse Problems. 1999a;15:R41. [Google Scholar]
- Arridge SR. Optical tomography in medical imaging. Inverse Problems. 1999b;15:R41–R93. [Google Scholar]
- Blyschak K, Simick M, Jong R, Lilge L. Classification of breast tissue density by optical transillumination spectroscopy: optical and physiological effects governing predictive value. Med Phys. 2004;31:1398–414. doi: 10.1118/1.1738191. [DOI] [PubMed] [Google Scholar]
- Brooksby B, Pogue BW, Jiang S, Dehghani H, Srinivasan S, Kogel C, Tosteson TD, Weaver J, Poplack SP, Paulsen KD. Imaging breast adipose and fibroglandular tissue molecular signatures by using hybrid MRI-guided near-infrared spectral tomography. Proceedings of the National Academy of Sciences of the United States of America. 2006;103:8828–33. doi: 10.1073/pnas.0509636103. [DOI] [PMC free article] [PubMed] [Google Scholar]
- Burtnyk M, Chopra R, Bronskill MJ. Quantitative analysis of 3-D conformal MRI-guided transurethral ultrasound therapy of the prostate: Theoretical simulations. International Journal of Hyperthermia. 2009;25:116–31. doi: 10.1080/02656730802578802. [DOI] [PubMed] [Google Scholar]
- Carpenter CM, Pogue BW, Jiang S, Dehghani H, Wang X, Paulsen KD, Wells WA, Forero J, Kogel C, Weaver JB, Poplack SP, Kaufman PA. Image-guided optical spectroscopy provides molecular-specific information in vivo: MRI-guided spectroscopy of breast cancer hemoglobin, water, and scatterer size. Opt Lett. 2007;32:933–5. doi: 10.1364/ol.32.000933. [DOI] [PubMed] [Google Scholar]
- Changhui L, Lihong VW. Photoacoustic tomography and sensing in biomedicine. Physics in Medicine and Biology. 2009;54:R59. doi: 10.1088/0031-9155/54/19/R01. [DOI] [PMC free article] [PubMed] [Google Scholar]
- Corlu A, Choe R, Durduran T, Lee K, Schweiger M, Arridge SR, Hillman EM, Yodh AG. Diffuse optical tomography with spectral constraints and wavelength optimization. Applied Optics. 2005;44:2082–93. doi: 10.1364/ao.44.002082. [DOI] [PubMed] [Google Scholar]
- Culver JP, Choe R, Holboke MJ, Zubkov L, Durduran T, Slemp A, Ntziachristos V, Chance B, Yodh AG. Three-dimensional diffuse optical tomography in the parallel plane transmission geometry: Evaluation of a hybrid frequency domain/continuous wave clinical system for breast imaging. Medical Physics. 2003;30:235–47. doi: 10.1118/1.1534109. [DOI] [PubMed] [Google Scholar]
- Davis SC, Pogue BW, Dehghani H, Paulsen KD. Contrast-detail analysis characterizing diffuse optical fluorescence tomography image reconstruction. Journal of Biomedical Optics. 2005;10:050501–3. doi: 10.1117/1.2114727. [DOI] [PubMed] [Google Scholar]
- Diaz SH, Aguilar G, Lavernia EJ, Wong BJF. Modeling the thermal response of porcine cartilage to laser irradiation. Selected Topics in Quantum Electronics, IEEE Journal of. 2001;7:944–51. [Google Scholar]
- Dierkes T, Grosenick D, Moesta KT, Moller M, Schlag PM, Rinneberg H, Arridge S. Reconstruction of optical properties of phantom and breast lesion in vivo from paraxial scanning data. Physics in Medicine and Biology. 2005;50:2519–42. doi: 10.1088/0031-9155/50/11/006. [DOI] [PubMed] [Google Scholar]
- Durduran T, Choe R, Culver JP, Zubkov L, Holboke MJ, Giammarco J, Chance B, Yodh AG. Bulk optical properties of healthy female breast tissue. Physics in Medicine and Biology. 2002:2847–61. doi: 10.1088/0031-9155/47/16/302. [DOI] [PubMed] [Google Scholar]
- Fang Q, Selb J, Carp SA, Boverman G, Miller EL, Brooks DH, Moore RH, Kopans DB, Boas DA. Combined Optical and X-ray Tomosynthesis Breast Imaging. Radiology. 2010 doi: 10.1148/radiol.10082176. [DOI] [PMC free article] [PubMed] [Google Scholar]
- Filonov GS, Krumholz A, Xia J, Yao J, Wang LV, Verkhusha VV. Deep-Tissue Photoacoustic Tomography of a Genetically Encoded Near-Infrared Fluorescent Probe. Angewandte Chemie International Edition. 2012;51:1448–51. doi: 10.1002/anie.201107026. [DOI] [PMC free article] [PubMed] [Google Scholar]
- Gao H, Osher S and Zhao H 2012 ed H Ammari: Springer Berlin / Heidelberg) pp 131-58
- Guillaume B, Gunther U. Inverse diffusion theory of photoacoustics. Inverse Problems. 2010;26:085010. [Google Scholar]
- Guillaume B, Kui R. Multi-source quantitative photoacoustic tomography in a diffusive regime. Inverse Problems. 2011;27:075003. [Google Scholar]
- Intes X, Ripoll J, Chen Y, Nioka S, Yodh AG, Chance B. In vivo continuous-wave optical breast imaging enhanced with Indocyanine Green. Medical physics. 2003;30:1039–47. doi: 10.1118/1.1573791. [DOI] [PubMed] [Google Scholar]
- Kepshire DS, Davis SC, Dehghani H, Paulsen KD, Pogue BW. Subsurface diffuse optical tomography can localize absorber and fluorescent objects but recovered image sensitivity is nonlinear with depth. Appl Opt. 2007;46:1669–78. doi: 10.1364/ao.46.001669. [DOI] [PubMed] [Google Scholar]
- Kickhefel A, Roland J, Weiss C, Schick F. Accuracy of real-time MR temperature mapping in the brain: A comparison of fast sequences. Physica Medica. 2010;26:192–201. doi: 10.1016/j.ejmp.2009.11.006. [DOI] [PubMed] [Google Scholar]
- Li C, Wang LV. Photoacoustic tomography and sensing in biomedicine. Physics in Medicine and Biology. 2009;54:R59–R97. doi: 10.1088/0031-9155/54/19/R01. [DOI] [PMC free article] [PubMed] [Google Scholar]
- Lin Y, Barber WC, Iwanczyk JS, Roeck W, Nalcioglu O, Gulsen G. Quantitative fluorescence tomography using a combined tri-modality FT/DOT/XCT system. Opt Express. 2010;18:7835–50. doi: 10.1364/OE.18.007835. [DOI] [PMC free article] [PubMed] [Google Scholar]
- Lin Y, et al. Fluorescence diffuse optical tomography with functional and anatomical a priori information: feasibility study. Physics in Medicine and Biology. 2007;52:5569. doi: 10.1088/0031-9155/52/18/007. [DOI] [PubMed] [Google Scholar]
- Lin Y, et al. A photo-multiplier tube-based hybrid MRI and frequency domain fluorescence tomography system for small animal imaging. Physics in Medicine and Biology. 2011;56:4731. doi: 10.1088/0031-9155/56/15/007. [DOI] [PMC free article] [PubMed] [Google Scholar]
- Lin Y, Thayer D, Nalcioglu O, Gulsen G. Tumor characterization in small animals using magnetic resonance-guided dynamic contrast enhanced diffuse optical tomography. Journal of Biomedical Optics. 2011;16:106015–4. doi: 10.1117/1.3643342. [DOI] [PMC free article] [PubMed] [Google Scholar]
- Marqa MF, Colin P, Nevoux P, Mordon S, Betrouni N. Focal Laser Ablation of Prostate Cancer: Numerical Simulation of Temperature and Damage Distribution. BioMedical Engineering OnLine. 2011;10:45. doi: 10.1186/1475-925X-10-45. [DOI] [PMC free article] [PubMed] [Google Scholar]
- Mathieu B, William Apoutou ND, Ilya K, Michael B, Rajiv C. 3D conformal MRI-controlled transurethral ultrasound prostate therapy: validation of numerical simulations and demonstration in tissue-mimicking gel phantoms. Physics in Medicine and Biology. 2010;55:6817. doi: 10.1088/0031-9155/55/22/014. [DOI] [PubMed] [Google Scholar]
- McDannold NJ, Jolesz FA. Magnetic Resonance Image-Guided Thermal Ablations. Topics in Magnetic Resonance Imaging. 2000;11:191–202. doi: 10.1097/00002142-200006000-00005. [DOI] [PubMed] [Google Scholar]
- Pogue B, McBride T, Osterberg U, Paulsen K. Comparison of imaging geometries fordiffuse optical tomography of tissue. Opt Express. 1999;4:270–86. doi: 10.1364/oe.4.000270. [DOI] [PubMed] [Google Scholar]
- Pogue BW, Davis SC, Leblond F, Mastanduno MA, Dehghani H, Paulsen KD. Implicit and explicit prior information in near-infrared spectral imaging: accuracy, quantification and diagnostic value. Philosophical Transactions of the Royal Society A: Mathematical, Physical and Engineering Sciences. 2011;369:4531–57. doi: 10.1098/rsta.2011.0228. [DOI] [PMC free article] [PubMed] [Google Scholar]
- Pogue BW, Davis SC, Song X, Brooksby BA, Dehghani H, Paulsen KD. Image analysis methods for diffuse optical tomography. Journal of Biomedical Optics. 2006;11:033001–16. doi: 10.1117/1.2209908. [DOI] [PubMed] [Google Scholar]
- Rieke V, Butts Pauly K. MR thermometry. Journal of Magnetic Resonance Imaging. 2008;27:376–90. doi: 10.1002/jmri.21265. [DOI] [PMC free article] [PubMed] [Google Scholar]
- Seo JK, Kwon O, Woo EJ. Magnetic resonance electrical impedance tomography (MREIT): conductivity and current density imaging. Journal of Physics: Conference Series. 2005;12:140–55. [Google Scholar]
- Srinivasan S, Pogue BW, Brooksby B, Jiang S, Dehghani H, Kogel C, Wells WA, Poplack SP, Paulsen KD. Near-infrared characterization of breast tumors in vivo using spectrally-constrained reconstruction. Technology in cancer research & treatment. 2005;4:513–26. doi: 10.1177/153303460500400505. [DOI] [PubMed] [Google Scholar]
- Srinivasan S, Pogue BW, Jiang S, Dehghani H, Kogel C, Soho S, Gibson JJ, Tosteson TD, Poplack SP, Paulsen KD. Interpreting hemoglobin and water concentration, oxygen saturation, and scattering measured in vivo by near-infrared breast tomography. Proc Natl Acad Sci U S A. 2003;100:12349–54. doi: 10.1073/pnas.2032822100. [DOI] [PMC free article] [PubMed] [Google Scholar]
- Thayer DA, Lin Y, Luk A, Gulsen G. Laser-induced photo-thermal magnetic imaging. Applied Physics Letters. 2012;101:083703–5. doi: 10.1063/1.4742158. [DOI] [PMC free article] [PubMed] [Google Scholar]
- Tromberg BJ, Pogue BW, Paulsen KD, Yodh AG, Boas DA, Cerussi AE. Assessing the future of diffuse optical imaging technologies for breast cancer management. Medical physics. 2008;35:2443–51. doi: 10.1118/1.2919078. [DOI] [PMC free article] [PubMed] [Google Scholar]
- Wang X, Xie X, Ku G, Wang LV, Stoica G. Noninvasive imaging of hemoglobin concentration and oxygenation in the rat brain using high-resolution photoacoustic tomography. Journal of Biomedical Optics. 2006;11:024015. doi: 10.1117/1.2192804. [DOI] [PubMed] [Google Scholar]
- Wissler EH. Pennes' 1948 paper revisited. Journal of Applied Physiology. 1998;85:35–41. doi: 10.1152/jappl.1998.85.1.35. [DOI] [PubMed] [Google Scholar]
- Woo EJ, Seo JK. Magnetic resonance electrical impedance tomography (MREIT) for high-resolution conductivity imaging. Physiological Measurement. 2008;29:R1–R26. doi: 10.1088/0967-3334/29/10/R01. [DOI] [PubMed] [Google Scholar]
- Yao J, Wang LV. Photoacoustic tomography: fundamentals, advances and prospects. Contrast Media & Molecular Imaging. 2011;6:332–45. doi: 10.1002/cmmi.443. [DOI] [PMC free article] [PubMed] [Google Scholar]
- Zhu Q, Hegde PU, Ricci A, Kane M, Cronin EB, Ardeshirpour Y, Xu C, Aguirre A, Kurtzman SH, Deckers PJ, Tannenbaum SH. Early-Stage Invasive Breast Cancers: Potential Role of Optical Tomography with US Localization in Assisting Diagnosis1. Radiology. 2010 doi: 10.1148/radiol.10091237. [DOI] [PMC free article] [PubMed] [Google Scholar]