

Abstract
The purpose of this study was to test the hypothesis that porous poly-l-lactic acid (PLLA) sensor coatings reduce fibrosis and promote blood microvessel formation in tissue adjacent to the sensor surface. Porous PLLA coatings were produced using ammonium bicarbonate as the gas foaming/salt leaching agent, and deployed on functional and nonfunctional sensors. The porous coatings minimally affected sensor accuracy and response rate in vitro. Three-week subcutaneous rat studies of nonfunctional glucose sensors showed the anticipated effect of porous coatings enhancing vascularity and decreasing collagen deposition. In contrast, percutaneous functional sensors with and without porous coatings showed no significant difference in terms of histology or sensor response. In spite of the observation that texturing increases the vascularity of the tissue that surrounds implanted sensors, other factors such as the additional mechanical stresses imposed by percutaneous tethering may override the beneficial effects of the porous coatings.
Keywords: glucose sensors, PLLA, subcutaneous, porous, in vivo
INTRODUCTION
Efforts to create a reliable, long-term implantable glucose sensor have been stymied by the effects of wound healing that introduce delayed response times as well as unpredictable sensor performance.1–3 Originally it was felt that adsorbed protein and adherent cells that foul the sensor membranes were the primary sources of failure. Attempts to improve sensor performance have included surface chemical modification, various coatings, release of molecular mediators, and surface topography.3,4 Coating strategies that have been employed include phospholipid-based biomimicry, Nafion™ membranes, surfactant modified sensors, naturally derived membranes, covalently modified membranes, diamond-like carbons, and surface topology considerations.3
More recently it has been shown that the composition of the tissue that surrounds the sensor plays a significant and possibly more important role in sensor performance.4,5 Coatings that release tissue response modifiers which affect the surrounding tissue have been developed, such as nitric oxide to minimize bacterial adhesion and biofouling,6–8 anti-inflammatory drugs, and/or angiogenic growth factors.9–11 The effect of surface texturing on the tissue that surrounds implanted biomaterials is well documented for devices such as total joint arthroplasty12,13 and percutaneous access devices.14–16 Sieminski and Gooch17 reviewed tissue responses to several porous materials of varying pore sizes noting that pore size, not chemical composition of the material, appears to determine the biomaterial–microvasculature interactions.
Topographical approaches for sensors were first proposed by Woodward18 who suggested that the best coating for an implanted glucose sensor was a sponge that encourages tissue in-growth and disrupts fibrosis. Efforts to create tissue-modifying textured coatings for implantable sensors are attractive because their impact is not dependent upon a depletable drug reservoir. To our knowledge, there are no FDA approved glucose sensors that employ this strategy.
The seminal experimental work for porous coatings was performed by Brauker et al.19 who examined the vascularity of tissues that formed around fully subcutaneous implanted expanded PTFE membranes of various pore sizes. Brauker et al. developed a bilayer sensor membrane with a porous outer layer to promote tissue in-growth and to interfere with cell monolayer formation, and a cell impermeable inner layer to prevent cell attachment and penetration into the underlying device.20 Materials employed for this membrane include polytetrafluoroethylene copolymers, silicone, nonwoven polyester or polypropylene fibers, polyurethane, and polyvinylpyrrolidone.20 DexCom, Inc., claims that vascularization is maximized with pores in the range of 25–500 μm with interpore distances between 10 and 400 μm.20
The greatest vascularization at the biomaterial interface appears to occur with pores on the order of cellular dimensions that are sufficiently large to support cell and tissue infiltration but small enough to disrupt fibrous tissue deposition.21 Textured implants with open-architecture pore structures also appear to promote thinner foreign body capsule formation.2,22–24 However, as previously stated by Ward et al.,24 a significant range of materials and pore sizes are capable of promoting angiogenesis and reducing capsule thickness. Table I summarizes leading research in the area of porosity and porous coatings for glucose sensors, including the pore size reported to yield the greatest vascularization and/or the least capsule formation around the implant.
TABLE I.
Use of Porous Materials to Promote Angiogenesis and/or Reduce Capsule Thickness Around Biomaterials or Glucose Sensors
| Investigator | Porous Material | Optimal Pore Size (μm) | Application and Test Subject | EHiration of Investigation |
|---|---|---|---|---|
| Brauker et al.19 | PTFE | 5 | Membrane implanted in rat subcutis | 3 weeks |
| Sharkawy et al.21 | PVA | 60 | Membrane implanted in rat subcutis | 12–16 weeks |
| Ward et al.24 | ePTFE and PVA | ePTFE: 1 PVA: ~47 |
Membrane implanted in rat subcutis | 7 weeks |
| Marshall et al.25 | HEMA hydrogels | 35 | Hydrogel implanted in mouse subcutis | 4 weeks |
| Updike et al.23 | ePTFE | 5–1026 | Glucose sensor implanted in dog subcutis | 162 daysa (best of six sensors) |
| Yu et al.27 | Epoxy-enhanced polyurethane | Not specified | Glucose sensor implanted in rat subcutis | 56 daysa (best of cose sensors) |
| Gilligan et al.28 | ePTFE | Not specified | Glucose sensor implanted in human subcutis | 185 daysa (best of five sensors) |
ePTFE, expanded polytetrafluoroethylene; PVA, polyvinyl alcohol; HEMA, hydroxyethyl methacrylate.
Maximum time sensor remained functional in vivo.
Employing porosity to improve long-term glucose performance in vivo has yielded encouraging results, with several groups reporting sensor survival for several months in the host (Table I). Often, however, only one of many sensors will last longer than a few weeks, with little attention given to the causes of sensor failure for the remaining sensors in the study. Thus, continued efforts are needed to better understand the role porosity has in improving sensor reliability in vivo.
This study investigates whether porous poly-l-lactic acid (PLLA) coatings, designed for needle-type glucose sensors, can promote vascularity and disrupt the surrounding fibrous tissue deposition when fully subcutaneously implanted in rat subcutis, and if these tissue modifications are sufficient to improve long-term percutaneous sensor performance compared with bare (smooth) sensors, in rats. Porous coatings of PLLA were fabricated for deployment on the sensing tips of glucose sensors using the ammonium bicarbonate technique of Nam et al.29In vitro testing against glucose standards showed that the porous coatings minimally affected sensor accuracy and response rate. Subcutaneously implanted nonfunctional glucose sensors, with and without porous coatings, showed the anticipated effect on enhancing vascularity and decreasing collagen deposition; however, percutaneous functional sensors with and without porous coatings showed no significant effect in terms of histology or sensor response. These results indicate that although texturing does favorably affect the tissue that surrounds implanted sensors, the additional mechanical stresses imposed by percutaneous tethering may override the beneficial effects induced by the porous coatings.
EXPERIMENTAL PROCEDURES
Materials
Nominal weight average PLLA (Mw 300,000; Polysciences, Warrington, PA), dichloromethane, dl-lactic acid (Mallinckrodt Baker, Phillipsburg, NJ), ammonium bicarbonate (NH4HCO3; EMD Chemicals, Gibbstown, NJ), methanolic HCl (3N), phosphate-buffered saline (NaCl 0.138M, KCl 0.0027M) packets, and glucose powder (Sigma, St. Louis, MO) were used as received. Phosphate-buffered saline, pH 7.4 (PBS), and PBS-glucose solutions were prepared in distilled, deionized water. 302-3M room temperature curable epoxy was purchased from EPO-TEK (Billerica, MA). EP42HT two component room curable USP Class VI epoxy was purchased from Master Bond (Hackensack, NJ). Medtronic MiniMed SOFSENSOR™ glucose sensors, CGMS® System Gold™ monitors, MiniMed Com-Station™, MiniLink™ transmitters, MiniLink™ chargers, MiniLink™ transmitter software (version 1.0A), and MiniMed Com-Station™ software (version 1.4B) were generously supplied gratis by Medtronic MiniMed (Northridge, CA).
Porous coating preparation
The procedure of Nam et al. was used as previously described.29 PLLA pellets (0.1 g) were dissolved in 3 mL of dichloromethane overnight at room temperature. Ammonium bicarbonate was manually stirred into the dissolved polymer solution until homogenously dispersed, forming a polymer slurry. Ammonium bicarbonate was previously milled and sieved to particulate (porogen) diameters ranging from 50 to 75 μm (average size 68 ± 3 μm) for the small pore coatings, and from 250 to 425 μm (average size 373 ± 15 μm) for the large pore coatings. For small pore coatings, a 1:15 weight ratio of PLLA to ammonium bicarbonate was added to the polymer solution. For large pore coatings, a 1:10 weight ratio of PLLA to ammonium bicarbonate was added to polymer solution.
Copper wire with a polyurethane/nylon jacket (AWG 22; maximum outer diameter 0.69 mm) (Newark InOne, Independence, OH) was cut to 15 cm lengths to serve as mandrels. The mandrels were dipped once into the ammonium bicarbonate-doped polymer slurry. The dichloromethane was allowed to partially evaporate from the polymer coating before the mandrels were submerged into 85°C ± 5°C water for 5 min to initiate pore formation. The mandrels were then submerged in cold water for 20 min to quench the reaction, removed, air-dried for 2–4 h, and stored in a desiccator. The porous coatings were gently slid off the mandrels, cut to 18–19 mm lengths, inserted onto the glucose sensor shafts (Fig. 1), and secured with 302-3M epoxy. Sensors were stored at 4°C until use.
Figure 1.

Medtronic MiniMed SOF-SENSOR glucose sensors: (a) bare and (b) porous PLLA coated.
IN VITRO STUDIES
Percent porosity and apparent density
Polymer slurry solutions, doped with either 50–75 μm or 250–425 μm sized ammonium bicarbonate particulates, were cast onto Teflon™ sheets. After the solvent had partially evaporated, the polymer sheets were removed from the Teflon sheet with a razor blade, and then salt leached/gas foamed and dried as described earlier.
Weight, thickness, length, and width of the porous sheets were recorded. Vacutainer® (Becton Dickinson, Franklin Lakes, NJ) tubes were filled three-fourth full with ethanol (AAPER Alcohol and Chemical Company, Shelbyville, KY) and weighed. A porous sheet was then inserted into a preweighed ethanol-filled tube, entrapped air was removed under vacuum, and the vial was reweighed. The porous sheet was removed from the vial, and the vial was weighed for a third time. Percent porosity [Eq. (1)] and apparent density (ρapp) [Eq. (2)] were calculated using equations adapted from Ramay and Zhang30 and Zhang and Ma.31
| (1) |
| (2) |
where WP is the weight of the dry, porous sheet, W0 is the initial weight of the ethanol in the Vacutainer, and W is the weight of the Vacutainer with the remaining ethanol after the porous sheet has been removed. Densities of ethanol (ρEtOH) and PLLA (ρP) used were 0.794 g/cm3 and 1.15 g/cm3, respectively.
In vitro polymer degradation
Two methods were used to assess porous coating degradation in vitro: (1) environmental scanning electron microscopy (ESEM) and (2) gas chromatography mass spectroscopy.
Environmental scanning electron microscopy
ESEM (Philips XL30 ESEM TMP; FEI Company, Hillsboro, OR) was used to examine the surface morphological changes to pore size over time, as a measure of polymer degradation. The porous coatings for both small and large pore sizes were imaged on days 0, 7, 21, and 42. For days 7, 21, and 42, the porous coatings were placed in unstirred PBS and incubated at 37°C. PBS solution was refreshed every 3–4 days. The luminal and exterior surfaces and cross section of the coatings were imaged. Three coatings were imaged at each time point, with three representative images taken per luminal and exterior surfaces, respectively, and two images taken per cross section.
ESEM images of the luminal and exterior porous coating surfaces and cross-sectional images were opened in Adobe Photoshop 6.0. The number of pixels per scale bar length was determined and used to generate a grid. Using the grid as a measurement tool, the length of the major axis of each pore per defined area (1 mm2 for small pore PLLA coatings, 4 mm2 for large pore PLLA coatings) and the thickness of the coatings (measured at three locations around circumference) were measured.
Gas chromatography mass spectroscopy
Porous PLLA small and large pore coatings were individually submerged in 1 mL of sterile PBS and stored, unstirred, at 37°C. Every 2 days for 42 days, the PBS soaking solution was collected and stored at −20°C after the porous PLLA coatings were transferred to fresh PBS.
PBS samples and standard (1 μL of dl-lactic acid in 1 mL PBS) were lyophilized for 72 h. Two hundred microliters of methanolic HCl (3N) was added to the lyophilized samples to derivatize any lactic acid degradation products present in the PBS soaking solution. After 1-h incubation with methanolic HCl, the PBS samples were centrifuged for 3 min at 6400 rpm. The supernatant was aspirated off and combined with 500 μL of dichloromethane. Samples were then analyzed using GC/MS. Briefly, 2 μL of each sample was injected into a Shimadzu GCMS-QP2010 (Shimadzu, Kyoto, Japan), equipped with a 5% phenol – 95% dimethyl polysiloxane cross-linked bonded phase, extra low bleed MS quality fused-silica capillary column (30 m × 0.25 mm i.d., film thickness 0.25 μm; Restek, Bellefonte, PA). The oven and injection temperatures were set at 50°C and 220°C, respectively. Temperature was increased at a rate of 20°C/min and held at 300°C for 2 min. The ion source temperature was set at 220°C, with an interface temperature of 250°C. The carrier gas was helium (ultrahigh purity), with a flow rate of 1 mL/min. Masses were scanned from 50 to 350 Da in electron ionization mode, with a scan rate of 0.33 s for 15 min. Data analysis was performed using LabSolutions software Release 2.21 (Shimadzu, Kyoto, Japan).
Cytotoxicity
Positive control was latex rubber (VWR International, West Chester, PA); negative control was high-density polyethylene (HDPE) (The United States Pharmacopeial Convention, Rockville, MD). Porous PLLA sheets, instead of tubular coatings, were fabricated to afford more surface area with fewer samples. Briefly, polymer slurry solution, doped with 50–75 μm sized ammonium bicarbonate particulates, was cast onto clean glass microscope slides. After the solvent had partially evaporated, the polymer sheets were removed from the glass with a razor blade, and then salt leached/gas foamed and dried as described earlier. All materials were sterilized by ethylene oxide. Direct contact cytotoxicity testing and assessment was performed in accordance with the United States Pharmacopeia, <87> Biological Reactivity Tests, In Vitro.32 One to two graders assessed cell morphology, detachment, and cell lysis for each material. The median score and interquartile range were determined for each material. Materials found as nonreactive to mildly reactive (scores of 0–2) were considered nontoxic.
Polymer hydration
Sensors with either small or large pore coatings were connected to CGMS System Gold monitors, placed in nonstirred PBS at 37°C, and soaked for 1 h in PBS before challenged with 400 mg/dL glucose in PBS. Sensors were challenged for 30 min in 400 mg/dL, and then returned to PBS until the next glucose challenge. Glucose challenges were performed after sensors were soaked in PBS for 1, 3, 6, 12, and 24 h. Sensor current (nA) was recorded continuously in real-time by the CGMS System Gold monitors. Sensor current was downloaded using the MiniMed Com-Station docking station and MiniMed Com-Station software, and then plotted using GraphPad Prism software.
Sensor response
Sensors with either small or large pore coatings were soaked at 37°C in unstirred PBS for 48 h prior to being challenged with a range of glucose solutions every 45 min, commencing with 100 mg/dL, followed by 200, 400, 0, and 100 mg/dL, in that order. Time for sensors to reach 90% of steady state current was recorded. Coatings were subsequently removed from sensors and the glucose challenge cycle was repeated on the bare sensors to determine sensor response without a coating. Linearity and sensitivity for sensors with and without porous coatings were also calculated. All test solutions were maintained at 37°C 6 1°C in unstirred conditions.
IN VIVO STUDIES
Preparation of nonfunctional sensor strips
Medtronic MiniMed SOF-SENSOR glucose sensors without the plastic housing were specifically fabricated that were 20 mm long, 0.7 mm wide and 0.2 mm thick. These strips were ~150 μm thicker than those normally employed to provide sufficient mechanical strength for implantation. The glucose oxidase component was removed to render the sensor nonfunctional to prevent hydrogen peroxide buildup in the tissue surrounding the sensor strip once implanted.
A porous PLLA coating was deployed over half of the length of the sensor strip, leaving the remaining half bare (i.e. polyimide coated with the Medtronic polyurethane-based glucose-limiting membrane). The porous coating was glued to the sensor strip using USP Class VI medical grade EP42HT epoxy. Implants were electron beam (e-beam) sterilized.
Implantation of nonfunctional sensor strips
All National Institutes of Health guidelines for the care and use of laboratory animals (NIH Publication no. 85–23 Rev. 1985) were observed. Approval for these studies was granted by the Institutional Animal Care and Use Committee prior to initiation of the studies. Male Sprague–Dawley rats (250–350 g) were anaesthetized with 2.5% isoflurane in oxygen at a flow of 1 L/min, which was adjusted to effect after induction (Baxter Healthcare, Deerfield, IL) for sensor implantation. One sensor strip modified as described earlier was implanted ~2 cm lateral to the spinal cord and ~5–7 cm below the scapular region. An incision ~7 mm was made, followed by blunt dissection to separate the tissue and form a pocket. The implant was placed within the pocket, and the incision was closed with a single wound clip. Rats (n = 3) were allowed rat chow and water ad libitum.
Explantation and tissue processing of nonfunctional sensor strips
Nonfunctional sensor strips were explanted after 3 weeks. Briefly, 100 μL of 10 mg/mL Hoechst 33342 dye (Sigma, St. Louis, MO) was injected into the tail vein 10 min prior to sacrifice by intra-cardiac administration of Euthasol® (Virbac Animal Health, Fort Worth, TX). Following sacrifice, the implants and surrounding tissue were surgically excised and placed in peel-away molds containing OCT compound (Sakura Finetechnical, Tokyo, Japan). Additional OCT compound was added until the tissue was fully covered, and then the specimens were frozen with liquid nitrogen. The frozen tissue was cut into 14-μm sections for histological staining. Tissues surrounding the implants were stained with Masson's trichrome and hematoxylin and eosin (H&E).
Histology analysis of nonfunctional sensor strips
Histology slides were viewed under 10× (Plan-APO CHROMAT, 0.45 NA), 20× (Zeiss A-Plan, 0.45 NA), and 40× (LD ACHROPLAN, 0.60 NA Korr Ph2) objectives using an Axioskop 2 plus light microscope. Representative images were taken at 20× and 40× per implant using a camera (Axiocam MRc, Carle Zeiss MicroImaging, Thornwood, NY) mounted on a microscope (Axioskop 2 plus). The images were captured using MRGrab 1.0 software (Carl Zeiss). Prior to counting vessels, 6–8 square fields with 100 μm × 100 μm dimensions were electronically layered onto digital images using Adobe® Photoshop® 6.0 software (Adobe Systems, San Jose, CA). Fields were first selected based on overall image quality under low magnification, and then imaged using higher magnification. Figure 2 provides a schematic of the tissue locations surveyed for histological analysis. For bare sensors, fields abutted either the sensor strip or, if missing from tissue processing, the void area where the sensor strip resided in the tissue (see Fig. 2, zone A). For porous coated sensor strips, two locations were examined: (1) 100 μm extending inwards from the porous coating toward the sensor strip, if sufficient tissue was available (Fig. 2, zone B), and (2) 100 μm extending from the exterior of the porous coating (Fig. 2, zone C). The same criteria applied by Ward et al.24 for designating a capillary was used: (1) presence of a red blood cell, (2) presence of an endothelial cell nucleus, and (3) presence of a lumen. Only two of the three criteria needed to be satisfied for a structure to be considered a capillary.
Figure 2.

Schematic of tissue locations surveyed around the (a) bare and (b) porous coated sensors/sensor strips used for histological analysis.
Collagen content within 100 μm2 from the tissue–implant surface were quantified using an in-house developed MATLAB® (The MathWorks, Natick, MA) program for colorimetric analysis of the differentially stained tissue. As described earlier, histology slides were imaged first at low, then at high magnification and eight square fields per image (100 μm × 100 μm) abutting the tissue–implant surface were digitally selected. Each MATLAB program was designed to split the original digital image into red (R), green (G), and blue (B) channels. The RGB values for each pixel in the histology image were processed using algorithms that compare the individual pixel RGB values with RGB value ranges specified for collagen tissue (blue-green in Masson trichrome stains). Any pixel matching the RGB criteria for “collagen” for Masson's trichrome images were assigned a “1” and those not meeting the criteria were assigned a value of “0.” Percent collagen was determined as total number of pixels assigned “1” divided by total number of pixels evaluated, and multiplied by 100.
Effect of anesthetics on blood glucose levels
All National Institutes of Health guidelines for the care and use of laboratory animals (NIH Publication no. 85-23 Rev. 1985) were observed. Approval for these studies was granted by the Institutional University Animal Care and Use Committee prior to initiation of the studies. The effects of isoflurane and pentobarbital anesthetics on blood glucose levels were investigated prior to functional sensor studies. Seven male Sprague–Dawley rats (250–350 g) were administered an intraperitoneal injection of 0.3 cc Nembutal® Sodium Solution (pentobarbital sodium; Abbott Laboratories, North Chicago, IL). Tail vein blood was collected and blood glucose concentration tested using OneTouch® Ultra® test strips and hand-held monitor. Blood samples were taken every 10–15 min following pentobarbital injection for 25 min. While still sedated with pentobarbital, 2.5% isoflurane in oxygen at a flow of 1 L/min was administered, followed by blood sample collection every 5–10 min for 25 min. The rat was subsequently removed from isoflurane and blood samples collected every 5–10 min for 25 min or until the rat awoke. Blood glucose concentration and corresponding time of sample, location of blood draw and anesthetic condition was recorded.
Implantation and glucose challenge of functional sensors
Several days prior to sensor implantation, rats were fitted with rat jackets (Harvard Apparatus, Holliston, MA), modified in-house to accommodate the 5 g (37 mm × 30 mm × 10 mm) Medtronic Mini-Link glucose sensor recording units. Six commercial Medtronic MiniMed SOF-SENSOR glucose sensors and six MiniMed SOF-SENSOR glucose sensors with small pore PLLA coatings were implanted into the dorsal subcutaneous tissue of 12 male Sprague–Dawley rats (250–350 g).
On day 0, rats were anaesthetized with 2.5% isoflurane in oxygen at a flow of 1 L/min, which was adjusted to effect after induction for sensor implantation. The rat scapular region was shaved and dis-infected using chlorhexidine. Sensors with porous coatings were soaked in sterile PBS for a minimum of 1.5 h prior to implantation, to initiate coating hydration. A 16-gauge needle was used to puncture the skin ~3 cm below the scapular region. The puncture hole was enlarged slightly (5 mm max) using scissors. A sensor was gently slid beneath the skin and mechanically secured with braided nylon sutures (4–0) (see Fig. 3). Sutures were placed several millimeters away from the implanted portion of the sensor to minimize interactions between sensor and suture wound healing. Adhesives were initially used to secure the sensor, but were found to irritate the rats and did not adhere sufficiently to the skin to prevent sensor dislocation from rat movement. Antibiotic ointment (Neosporin®; Johnson and Johnson, New Brunswick, NJ) was administered around the sutured area. Medtronic MiniLink were then attached to the sensors, and fastened to the rat jackets. The MiniLink system afforded continuous, real-time glucose monitoring while allowing unrestrained rat motion for the duration of the experiment. Rats were inspected daily to ensure sutures had not become loose, infected, or removed by the animal.
Figure 3.

Schematic of percutaneous glucose sensor attachment to rat.
On day 1, the rats were lightly sedated with 2.5% isoflurane in oxygen at a flow of 1 L/min (~3–4 min), to allow for easier administration of the intraperitoneal injection of pentobarbital (0.3 cc). Baseline blood glucose concentrations from tail vein blood were measured 20 min after removal from isoflurane/pentobarbital injection. Twenty minutes was found to be a sufficient amount of time for the effects of isoflurane on blood glucose levels to be negligible. Blood glucose levels were determined using OneTouch Ultra test strips and blood glucose monitoring hand-held system (LifeScan, Milpitas, CA). Each rat was injected with 0.5 cc of 50% dextrose solution intraperitoneally, followed by tail vein blood collection every 5–10 min until the sedative was metabolized or baseline blood glucose levels were reached. Glucose bolus injection was performed on days 1 and 14, or 21. Glucose concentrations from tail vein blood were compared with sensor current output (nA) following each glucose bolus experiment to evaluate any change in sensor response time between day 1 and experiment termination (day 14 or 21). Data were retrieved from MiniLink devices weekly via radiofrequency transmission.
Continuous glucose sensor monitoring of functional sensors
Blood glucose concentrations were monitored continuously using the Medtronic MiniLink devices, from the time the sensor was implanted until sensor failure or experiment termination (2-week or 3-week trials). The MiniLink processes continuous electrical signals received from the sensor as it reacts with the interstitial glucose, to compute an average glucose signal every 5 min that correlates with the real-time blood glucose levels present in the local environment. These average current (nA) values are stored with a date and time, and later downloaded via radio frequency transmission. Downloaded data were processed using Medtronic MiniMed software, Microsoft Excel and GraphPad Prism software packages.
Explantation, tissue processing, and histological assessment for functional sensors
Functional sensor strips were explanted after 2 or 3 weeks. Sensors and surrounding tissue were excised, formalin fixed, and paraffin embedded. The tissue was cut into 5-μm sections for histological staining using Masson's trichrome and H&E. Histo-logical analysis performed as described previously for the explanted nonfunctional sensor strips.
Statistical analysis
Pore diameters, cross sectional thicknesses, % porosity, vessel counts, and collagen index are presented as mean ± standard error. Statistical significance for vessel counts and collagen content were assessed by single factor ANOVA with Tukey posttests for multiple comparisons. Because cytotoxicity grading is not normally distributed, a Kruskal–Wallis nonparametric test with Dunn's posttests for multiple comparisons was performed to determine statistical significance. The threshold for significance was p < 0.05. Statistical analyses were performed using GraphPad Prism software package.
RESULTS
In vitro studies
Physical characteristics
Interconnecting, porous PLLA coatings were created using ammonium bicarbonate as the salt leaching/gas foaming agent. Dimensions and physical characteristics of small and large pore coatings are outlined in Table II. Both small and large pore coatings were ~90% porous. Pores were oblong-shaped: small pore dimensions were 36 ± 2 μm major axis by 22 ± 1 μm minor axis; large pore dimensions were 172 ± 13 μm major axis by 84 ± 7 μm minor axis. Gas chromatography mass spectroscopy showed no traces of lactic acid in aliquots taken from PBS solutions used to soak small pore or large pore coatings for 0, 8, or 42 days at 37°C. These results indicate that PLLA tubes had not released any monomer over 6 weeks.
TABLE II.
Physical Characteristics of Porous PLLA Coatings
| % Porosity | Apparent Density (g/cm3) | Hydration Time (h) | Hydrated Pore Size (μm) | Hydrated Coating Thickness (μm) | |
|---|---|---|---|---|---|
| Small pore coating | 91 ± 1 | 0.11 ± 0.01 | 6 | 36 ± 2 (major axis) | 46 ± 3 |
| 22 ± 1 (minor axis) | |||||
| Large pore coating | 86 ± 1 | 0.15 ± 0.01 | 24 | 172 ± 13 (major axis) | 573 ± 30 |
| 84 ± 7 (minor axis) |
Data presented as mean ± SE.
Cytotoxicity
There was no significant difference between the negative control HDPE and porous PLLA sheet (p > 0.05). Overall, fibroblasts were well adhered to the tissue-culture plate, with well-defined and spread bodies. Both materials had median scores of 1, corresponding to slight reactivity and therefore met the USP requirements of the test for being noncytotoxic.32 In contrast, the positive control latex specimens received a median score of 4, resulting in a p < 0.01 difference between latex and the other materials. Severe reactivity to the latex material was evident by the reduced cell body size, the contracted, spherical-like cell morphology, and the detachment of many cells from the tissue culture well.
Polymer hydration
Small pore coatings hydrated within 6 h, whereas large pore coatings took ~24 h as determined by regularly challenging coated sensors soaking in PBS to a 400 mg/dL glucose solution and comparing coated sensor signal to that of a bare sensor signal at the same glucose concentration (data not shown).
Sensor response
Sensors with fully hydrated porous coatings were immersed in a series of PBS solutions with step changes in glucose concentration. Table III compares the time for sensors to reach 90% of the steady state current for bare sensors and sensors with either small or large pore coatings. Sensors with thin, small pore coatings responded to glucose challenges with lag times comparable to bare sensors, whereas the thicker large pore coatings significantly increased the time required for sensors to fully reach 90% of the steady state current.
TABLE III.
Time (min) for Sensors to Reach 90% Steady State Current in Response to Step Changes in Glucose Concentration
| Time (min) to Reach 90% Steady State Current |
||||
|---|---|---|---|---|
| 0 → 100a | 100 → 200a | 200 → 400a | 400 → 0a | |
| Bare sensor (n = 8) | 2 ± 0 | 2 ± 0 | 2 ± 0 | 15 ± 1 |
| Small pore coating (n = 4) | 3 ± 1 | 3 ± 0 | 4 ± 0 | 13 ± 3 |
| Large pore coating (n = 4) | 13 ± 3 | 20 ± 1 | 26 ± 1 | >45b |
Data presented as mean ± SE.
Glucose challenge (mg/dL).
Time exceeded the experimental time interval.
Calibration curves were generated for sensors at 37°C in unstirred PBS solutions using glucose concentrations covering the normally accepted operation range of 0–400 mg/dL. All sensors maintained a linear response from 0 to 400 mg/dL glucose (r2 > 0.99) with the linearity and sensitivity of the bare and small pore coated sensors being nearly identical (Table IV). However, sensors coated with large pore coatings were slightly less linear and showed a 25% increase in sensitivity when compared with bare sensors.
TABLE IV.
Sensor Linearity and Sensitivity for 0–400 mg/dL Glucose Calibration
| Linear Correlation Coefficient, r2 | Sensitivity to Glucose [nA/(mg/dL glucose)] | |
|---|---|---|
| Bare sensor (n = 8) | 0.999 | 0.198 ± 0.003 |
| Small pore coatings (n = 4) | 0.999 | 0.201 ± 0.003 |
| Large pore coatings (n = 4) | 0.995 | 0.247 ± 0.010 |
Data presented as mean ± SE.
In vivo studies
Based on the in vitro results listed in Tables II–IV, only small pore coatings (~30-μm pores) were used for further in vivo testing.
Histological analysis of fully subcutaneously implanted nonfunctional sensor strips
To confirm that texturing had the desired effect on the surrounding tissue, nonfunctional sensor strips (devoid of glucose oxidase layer) with and without porous coatings were fully implanted in the rat dorsal subcutis for 3 weeks.
Figure 4(a) shows a dense cellular layer, ~40-μm-thick regions, immediately adjacent where the bare sensor-strip resided in the tissue for 3 weeks. Surrounding this cellular layer was avascular tissue, with large deposits of collagen. Figure 4(b) shows tissue surrounding a porous coated sensor strip, characterized by vascularized tissue dispersed with collagen deposits. The porous coated sensor lacked a distinct layer of cells adjacent to the sensor surface; however, cell infiltration, tissue in-growth, and several microvessels were observed within the space between the polymer coating and sensor surface. Degradation of polymer coating thickness by at least 50%, as well as fragmentation of the coating was also evident.
Figure 4.

Tissue response surrounding a fully subcutaneously implanted nonfunctional sensor strip after 3 weeks: (a) bare and (b) porous coated. Arrows denote blood vessels; Masson's trichrome stain.
The schematic in Figure 2 outlines the areas of histological sections used for determination of collagen and vessel density. Results are listed in Table V for bare and porous coated nonfunctional sensor strips. Compared with sensors with porous coatings, tissue surrounding the bare sensor strips had approximately threefold lower vessel density per mm2 and percent collagenous tissue within 100 μm of the implant surface. Because of small sample size (n = 3) no statistical differences for vessel density or % collagen were found between tissue surrounding smooth surfaces or porous surfaces (p > 0.05).
TABLE V.
Vessel Density per mm2 and % Area of Collagen Within 100 μm of the Tissue Interfacing With the Fully Subcutaneously Implanted Nonfunctional Bare and Porous Coated Sensor Strips (n = 3) After 3 Weeks
| Vessel Density per mm2 (Within 100 μm of Surface) | % Area of Collagen (Within 100 μm of Surface) | |
|---|---|---|
| Exterior of bare sensor | 30 ± 12 | 28 ± 5 |
| Exterior of porous coating | 83 ± 5 | 10 ± 4 |
| Interior of porous coating | NS | NS |
Not sufficient (NS) tissue in-growth occurred for analysis with 100 μm of the space between the sensor and porous coating. Data presented as mean ± SE.
Effect of anesthetics on blood glucose levels
Isoflurane had a noticeable effect on rat blood glucose, raising baseline glucose concentration ~40 mg/dL after 25-min exposure to 2.5% isoflurane at a 1 mL/min flow rate (data not shown). Approximately 20 min was required for baseline glucose concentrations to be restored following removal from isoflurane. Pentobarbital was found to mildly suppress blood glucose levels, though its effect on glucose concentrations was not as pronounced as isoflurane. Therefore, pentobarbital was used for all glucose bolus studies.
Continuous glucose monitoring by percutaneously implanted functional sensors: 2-week trial
Sensors with and without porous coatings were percutaneously implanted into the dorsal subcutis of rats for continuous, real-time glucose monitoring over 14 days. Two of three bare sensors and porous coated sensors remained functional until experimental termination [Fig. 5(a,b)]. All sensor responses decayed to some extent over the 2-week period, with a more pronounced reduction in signal from sensors with the porous coatings.
Figure 5.

Continuous monitoring of rat interstitial glucose concentrations using MiniLink transmitters and Medtronic MiniMed SOF-SENSOR glucose sensors: (a) 2-week bare sensors, (b) 2-week porous coating sensors, (c) 3-week bare sensors, and (d) 3-week porous coating sensors. One sensor per rat. Plotted data commenced 2 h postimplantation (after initialization period), followed by subsequent plotting for 20 min of current (nA) readings every 6 h until end of experiment. (●, experiment terminated for histology; ★, sutures loose or torn through skin, partially or entirely removing the sensor; ⊠, jacket removed from the rat, and subsequently sensor pulled from beneath skin; ◻, sensor mechanically damaged because of handling/rat movement; boxed areas indicate glucose bolus injection.) Representative sensor response 24 h post sensor implantation to a 0.5 cc intraperitoneal injection of 50% dextrose: (e) bare sensor and (f) porous coated sensor (--△--, discrete blood glucose measurements from tail vein pricks using OneTouch Ultra; —, continuous signal from bare sensor; ---, continuous signal from porous coated sensor).
The signals of the two remaining bare sensors began to stabilize after day 6. One of these sensors responded to the glucose challenge on day 14 at day 1 level performance, whereas the other sensor lost ~30% of signal and failed to respond to the glucose bolus by day 14. Only one remaining porous coated sensor signal began to stabilize at day 6 following a 50% drop in baseline current from day 1, whereas the other remaining porous coated sensor exhibited a 75% signal reduction by day 14 at which point it did not respond to glucose bolus challenge. Sensor function was not tested in vitro after explantation as sensors and surrounding tissue were processed for histology.
Continuous glucose monitoring by percutaneously implanted functional sensors: 3-week trial
Figure 5(c,d) shows the responses of the three bare sensors and the three porous coated sensors intended for the 3-week trial. The bare sensors gave glucose readings for 7, 18, and 21 days, whereas the porous coated sensors gave glucose readings for 12, 16, and 19 days. For the bare sensors the average sensor response remained relatively high (~12–16 nA) but showed considerable fluctuation. In contrast, the porous coated sensors exhibited an early decline in signal but then became stable (~5–9 nA) for the duration of the measurements. Representative bare and porous coated sensor responses to intraperitoneal glucose bolus injections after 24 h post sensor implantation are shown in Figure 5(e,f). Typically, a 3–12 min lag between peak tail vein blood glucose and sensor response occur for bare sensors, whereas a 7–25 min lag was observed for porous coated sensors. Sensors and surrounding tissue were explanted for histology, preventing postexplantation testing of sensor function.
Histology: 2-week trial
As shown in Figure 6(a,b), tissue within 100 μm of still functioning bare and porous coated functional sensors was highly vascularized, with loose collagenous tissue well integrated into the surrounding subcutis after 14 days. Moreover, the space (<100 μm wide) between the sensor surface and porous coating (refer to Fig. 2, zone B) contained vascularized, loose, and disorganized tissue with minimal collagen [see Fig. 6(c)].
Figure 6.
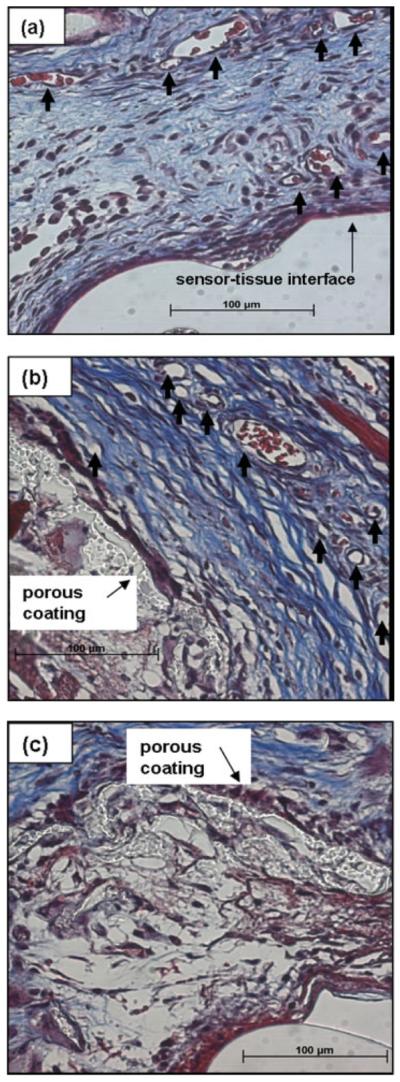
Tissue response surrounding percutaneously implanted sensors after 2 weeks in (a) exterior of bare sensor, (b) exterior of porous coating, and (c) space occupied by tissue between sensor and porous coated sensor. Arrows denote blood vessels; Masson's trichrome stain.
As outlined in Table VI, the mean vessel density per mm2 was approximately twofold higher adjacent to the porous coated sensor (~220 vessels per mm2 exterior of the coating, ~150 vessels per mm2 interior of the coating) than the bare sensor (~150 vessels per mm2). Likewise, a twofold increase in collagen within 100 μm of the porous coated sensor exterior (~50%) was observed, compared with the bare sensor (~25%). Tissue surrounding all sensors, despite surface texturing, appeared well integrated into the native subcutaneous tissue, without noticeable foreign body encapsulation.
TABLE VI.
Summary of Vessel Density per mm2 and % Area of Collagen Within 100 μm of the Tissue Interfacing With the Percutaneously Implanted Bare Sensor, Exterior of the Porous Coating and Within 100 μm of the Space Between the Sensor and Porous Coating (n = 3) After 2 Weeks
| Vessel Density per mm2 (Within 100 μm of Surface) | % Area of Collagen (Within 100 μm of Surface) | |
|---|---|---|
| Exterior of bare sensor | 152 ± 79 | 25 ± 12 |
| Exterior of porous coating | 221 ± 61 | 53 ± 15 |
| Interior of porous coating | 146 ± 24 | 30 ± 15 |
Data presented as mean ± SE.
In contrast, tissue around failed bare sensor was avascular with heavy cellular infiltrate and minimal collagen deposition. Tissue occupying the entire space (>100 μm wide) between the porous layer and the failed porous coated sensor was densely packed and highly collagenous (though well-vascularized). Again, because of the small sample size, no statistical significance to the differences in vessel density or collagen content (p < 0.05) was observed.
Histology: 3-week trial
Sensor extrusion from beneath the skin occurred in four of six cases over 3 weeks, and in only two cases with bare sensors could histology be obtained, which included both tissue sections and sections of the sensor. Figure 7 compares histological sections of the sensors that lasted the longest: that is, the bare sensor that lasted for 21 days showing the tissue and sensor [Fig. 7(a)] and the porous coated sensor that lasted for 19 days showing the tissue and the porous coating [Fig. 7(b)]. Tissue surrounding these percutaneous sensors were similarly loose, vascularized, and well integrated into the subcutis. Tissue around the porous coated implant had more cellular infiltrate, possibility stemming from the mild inflammation/infection around the sutures. These images clearly do not exhibit the different tissue responses found at 3 weeks for the fully implanted bare and porous coated nonfunctional sensor strips [Fig. 4(a,b)].
Figure 7.

Tissue response surrounding percutaneous implanted sensors after 3 weeks: (a) bare sensor and (b) porous coated sensor (H&E stain).
DISCUSSION
The use of porous material to modify the wound healing response at the tissue–sensor interface was first suggested nearly 25 years ago by Woodward.18 Since then, porous coatings have been examined to promote angiogenesis and reduce capsule formation around an implanted sensor (Table I).
In vitro characterization using our recently recommended testing scheme33 demonstrated that PLLA coatings fabricated using ammonium bicarbonate as the gas foaming/salt leaching salt were noncytotoxic, minimally interfered with sensor sensitivity to glucose concentrations, and did not appreciably degrade over the course of 6 weeks in vitro. Initially, we considered both small pore (~36 μm major axis) and large pore (~172 μm major axis) coatings; however, the time required for sensors with either large pore or small pore coatings to hydrate and respond to step glucose challenges was substantially different. The lag time for the large pore coatings was attributed to the 12-fold difference in coating thickness required to accommodate the 250–425 μm ammonium bicarbonate particulate size range. Based on sensor hydration and lag times, only small pore coatings were used for all in vivo experiments. Moreover, small pore coatings were of similar pore dimensions previously reported to induce superior microvascularization in the subcutaneous tissue.21,25
Three-week fully subcutaneously implanted sensor strips with and without porous coatings indicated that porous surfaces successfully modified the tissue response when compared with smooth surfaces (i.e. bare sensor strip). Almost threefold more vessels and threefold less collagen within 100 μm adjacent to the porous coating exterior was observed, compared with the bare sensor strip. Both Sharkawy et al.21 and Salzmann et al.22 reported similar vessel counts in subcutaneous tissue surrounding porous implants.
Based on the encouraging results from the nonfunctional sensor strip experiments, functional sensor experiments were performed using fully operational Medtronic MiniMed SOF-SENSOR glucose sensors with and without the porous coatings. Prior to beginning functional sensor studies, the effect and time course of isoflurane and pentobarbital on glucose levels were investigated. Both pentobarbital and isoflurane affected blood glucose levels: pentobarbital caused a gradual and slight suppression, whereas isoflurane caused a comparatively rapid and substantial elevation. Similar results were reported by Taborsky et al.34 with dogs and pentobarbital and by Zapp et al.35 with rats and isoflurane. Subsequently, pentobarbital was used for all glucose bolus studies.
Though marketed for 3-day use, long-term in vitro stability tests of Medtronic MiniMed glucose sensors found that sensors can continuously function in glucose/buffered saline for more than 30 days.36 Therefore, progressive decrease of sensor response in vivo for both bare and porous coated sensors was most likely due to tissue response, not loss in glucose oxidase activity during the 2–3-week test period.
Interestingly, no significant difference in vascularization or tissue composition was observed between bare and porous coated sensors, although the average vessel density per mm2 was three- to fivefold higher around percutaneous sensors compared with fully subcutaneously implanted sensor strips. Moreover, bare sensors typically experienced less signal reduction, yet greater variability in sensor signal, requiring several more days to stabilize, than porous coated sensors. Similar sensor stabilization trends were observed by Updike et al.23 between glucose sensors coated with and without angiogenic membranes in dogs.
Surprisingly, despite the increased vessel density around glucose sensors with porous coatings, these porous coated sensors experienced a more apparent and rapid signal reduction initially, compared with bare sensors. However, unlike bare sensors, sensor with porous coatings exhibited less signal fluctuation over the experimental time course. These observations are characteristic of the “break-in period” following sensor implantation as described by Updike et al.23 The break-in period refers to the time required for the sensor signal to become stable postimplantation, owing to the establishment of vascularized tissue around the sensor tip. The more rapid occurrence of a stable signal was consistent with the higher average blood vessel density observed with the porous coated percutaneous sensors compared with the bare percutaneous sensors. Additionally, tissue integration into the porous coating secured the sensor beneath the skin better than bare sensors. Better tissue integration prevented partial sensor extrusion, and may have minimized shearing between the sensor and adjacent tissue, often caused by animal motion, leading to less sensor signal variability (Fig. 5). However, porous coated sensor signals were also consistently lower than for bare sensors, suggesting that the twofold increase in collagenous tissue deposition around the sensor, despite the loose and disorganized nature of the tissue, may have impeded glucose diffusion to these coated sensors. Unfortunately, neither vessel density nor collagen deposition differences were statistically significant.
Though porous PLLA coatings do modify tissue response, the extent of these modifications varied depending on whether the coatings were fully subcutaneously implanted, or percutaneously implanted. Percutaneously tethered sensors were subject to additional mechanical stresses that were absent in the fully subcutaneously implanted sensors, which allowed the fully implanted sensors to “float” unperturbed in the tissue. Constant mechanical stimulation may have induced the deposition of loose, disorganized collagenous tissue and promoted microvascularization adjacent to the sensor surface, regardless of surface topography.
Concern about the impact of constant mechanical stimulation (i.e. micromotion) and probe stimulation (i.e. electrical or chemical) is an area of growing research in neuroelectrodes14,37,38; but little attention has been given to these effects for implanted glucose sensors. The only reports that we are aware of are those of Long et al.39 that propose inconsistencies with glucose sensor sensitivity in rats may be attributed to micromotion, and of Gillian et al.28 that accredit poor glucose tracking by sensors implanted into human subjects (abdominal subcutaneous tissue) to shear forces that may have interfered with vascularization at the tissue–sensor interface. Two strategies worth investigating are: (1) to fully implant a sensor and utilize telemetric glucose monitoring, or (2) to stabilize the tissue within the immediate vicinity of the percutaneously implanted sensor. Cutaneous seals around percutaneous devices, intended to minimize infectious risk,40 may also bolster efforts to reduce sensor motion.
Premature sensor failure occurred for several reasons, including suture loosening or tearing through the skin from animal movement, resulting in sensor dislodgement/removal, from mechanical stresses imparted on the sensor from rats pulling and scratching the jackets, or from rat handling during routine husbandry and experimentation. Mechanical damage from rat handling or rat motion likely resulted in the abrupt loss of sensor signal after 3.5 and 8 days for the bare sensors and 2.5 days for porous coated sensor as shown in Figure 5. Resuturing was often required throughout the experiment, and may have contributed to the mild infection surrounding the sutures in three rats in the 3-week functional sensor trial. Extending in vivo experiments beyond the “break-in” period would undoubtedly increase the risk of infection and potential for animal discomfort from multiple surgeries to ensure firm anchorage of the sensor to the rat. Strategies to minimize sensor removal and infection during in vivo experiments, while not compromising animal mobility or sensor functionality, continue to be investigated within the sensor community.39
CONCLUSIONS
The use of porosity to improve the long-term reliability for implantable glucose sensors continues to be a popular strategy in the biosensor community to induce angiogenesis and to reduce foreign body encapsulation at the tissue–sensor interface. Here, it was found that the extent to which porous PLLA coatings will modify tissue surrounding implanted sensors depends on whether the sensors were fully subcutaneously implanted or percutaneously implanted. The unanticipated similarities in vascularity and collagen deposition observed between bare and porous coated sensors implanted percutaneously suggest that other factors may negate the effects of porosity on tissue response, such as micromotion. Future work will focus on increasing our understanding of the implications of motion on tissue healing and subsequent sensor performance.
Acknowledgments
The authors thank Drs. Kevin Olbrich and Lori Norton for helpful discussions; Drs. Fan Yuan and Mark Dewhirst for the use of microscopes and imaging software; Dr. George Dubay for assistance with GCMS; Leslie Eibest for assistance with ESEM; and Letia Dean and Julie Fuller for histological consultation. The authors gratefully acknowledge Medtronic MiniMed, Inc., for the donation of sensors, software, and equipment, as well as the use of clean room space. Special thanks go to Victor Giron, Kate Wolfe, Neil Heil, Nini Cruz, Cindy Jones, Chris Enegren, and Drs. Larry Wang, Rajiv Shah, and John Mastrototaro of Medtronic Minimed, Inc., for their kind help and generosity.
Contract grant sponsor: NSF; contract grant number: DBI-0098534
Contract grant sponsor: NIH; contract grant number: DK054932
Contract grant sponsors: Duke University Graduate School Dr. Lewis Siegel International Fellowship and the Robert E Jones Fund
References
- 1.Wilson GS, Gifford R. Biosensors for real-time in vivo measurements. Biosensors Bioelectron. 2005;20:2388–2403. doi: 10.1016/j.bios.2004.12.003. [DOI] [PubMed] [Google Scholar]
- 2.Sharkawy AA, Klitzman B, Truskey GA, Reichert WM. Engineering the tissue which encapsulates subcutaneous implants. I. Diffusion properties. J Biomed Mater Res. 1997;37:401–412. doi: 10.1002/(sici)1097-4636(19971205)37:3<401::aid-jbm11>3.0.co;2-e. [DOI] [PubMed] [Google Scholar]
- 3.Wisniewski N, Reichert M. Methods for reducing biosensor membrane biofouling. Colloids Surf B Biointerfaces. 2000;18:197–219. doi: 10.1016/s0927-7765(99)00148-4. [DOI] [PubMed] [Google Scholar]
- 4.Wisniewski N, Moussy F, Reichert WM. Characterization of implantable biosensor membrane biofouling. Fresenius J Anal Chem. 2000;366:611–621. doi: 10.1007/s002160051556. [DOI] [PubMed] [Google Scholar]
- 5.Sharkawy AA, Klitzman B, Truskey GA, Reichert WM. Engineering the tissue which encapsulates subcutaneous implants. III. Effective tissue response times. J Biomed Mater Res. 1998;40:598–605. doi: 10.1002/(sici)1097-4636(19980615)40:4<598::aid-jbm11>3.0.co;2-c. [DOI] [PubMed] [Google Scholar]
- 6.Nablo BJ, Prichard HL, Butler RD, Klitzman B, Schoenfisch MH. Inhibition of implant-associated infections via nitric oxide. Biomaterials. 2005;26:6984–6990. doi: 10.1016/j.biomaterials.2005.05.017. [DOI] [PubMed] [Google Scholar]
- 7.Gifford R, Batchelor MM, Lee Y, Gokulrangan G, Meyerhoff ME, Wilson GS. Mediation of in vivo glucose sensor inflammatory response via nitric oxide release. J Biomed Mater Res A. 2005;75:755–766. doi: 10.1002/jbm.a.30359. [DOI] [PubMed] [Google Scholar]
- 8.Shin JH, Schoenfisch MH. Improving the biocompatibility of in vivo sensors via nitric oxide release. Analyst. 2006;131:609–615. doi: 10.1039/b600129g. [DOI] [PubMed] [Google Scholar]
- 9.Ward WK, Wood MD, Casey HM, Quinn MJ, Federiuk IF. The effect of local subcutaneous delivery of vascular endothelial growth factor on the function of a chronically implanted amperometric glucose sensor. Diabetes Technol Ther. 2004;6:137–145. doi: 10.1089/152091504773731320. [DOI] [PubMed] [Google Scholar]
- 10.Friedl KE. Corticosteroid modulation of tissue responses to implanted sensors. Diabetes Technol Ther. 2004;6:898–901. doi: 10.1089/dia.2004.6.898. [DOI] [PubMed] [Google Scholar]
- 11.Norton LW, Tegnell E, Toporek SS, Reichert WM. In vitro characterization of vascular endothelial growth factor and dexamethasone releasing hydrogels for implantable probe coatings. Biomaterials. 2005;26:3285–3297. doi: 10.1016/j.biomaterials.2004.07.069. [DOI] [PubMed] [Google Scholar]
- 12.Bauer TW, Schils J. The pathology of total joint arthroplasty. I. Mechanisms of implant fixation. Skeletal Radiol. 1999;28:423–432. doi: 10.1007/s002560050541. [DOI] [PubMed] [Google Scholar]
- 13.Ryan G, Pandit A, Apatsidis DP. Fabrication methods of porous metals for use in orthopaedic applications. Biomaterials. 2006;27:2651–2670. doi: 10.1016/j.biomaterials.2005.12.002. [DOI] [PubMed] [Google Scholar]
- 14.Kim H, Murakami H, Chehroudi B, Textor M, Brunette DM. Effects of surface topography on the connective tissue attachment to subcutaneous implants. Int J Oral Maxillofac Implants. 2006;21:354–365. [PubMed] [Google Scholar]
- 15.Tagusari O, Yamazaki K, Litwak P, Kojima A, Klein EC, Antaki JF, Watach M, Gordon LM, Kono K, Mori T, Koyanagi H, Griffith BP, Kormos RL. Fine trabecularized carbon: Ideal material and texture for percutaneous device system of permanent left ventricular assist device. Artif Organs. 1998;22:481–487. doi: 10.1046/j.1525-1594.1998.06152.x. [DOI] [PubMed] [Google Scholar]
- 16.Walboomers XF, Jansen JA. Effect of microtextured surfaces on the performance of percutaneous devices. J Biomed Mater Res A. 2005;74:381–387. doi: 10.1002/jbm.a.30337. [DOI] [PubMed] [Google Scholar]
- 17.Sieminski AL, Gooch KJ. Biomaterial-microvasculature interactions. Biomaterials. 2000;21:2233–2241. doi: 10.1016/s0142-9612(00)00149-6. [DOI] [PubMed] [Google Scholar]
- 18.Woodward SC. How fibroblasts and giant-cells encapsulate implants—Considerations in design of glucose sensors. Diabetes Care. 1982;5:278–281. doi: 10.2337/diacare.5.3.278. [DOI] [PubMed] [Google Scholar]
- 19.Brauker JH, Carrbrendel VE, Martinson LA, Crudele J, Johnston WD, Johnson RC. Neovascularization of synthetic membranes directed by membrane microarchitecture. J Biomed Mater Res. 1995;29:1517–1524. doi: 10.1002/jbm.820291208. [DOI] [PubMed] [Google Scholar]
- 20.Brauker JH, Shults MC, Tapsak MA. United States Patent 6,702,857. Dexcom, Inc.; San Diego, CA: 2004. Membrane for use with implantable devices. [Google Scholar]
- 21.Sharkawy AA, Klitzman B, Truskey GA, Reichert WM. Engineering the tissue which encapsulates subcutaneous implants. II. Plasma-tissue exchange properties. J Biomed Mater Res. 1998;40:586–597. doi: 10.1002/(sici)1097-4636(19980615)40:4<586::aid-jbm10>3.0.co;2-e. [DOI] [PubMed] [Google Scholar]
- 22.Salzmann DL, Kleinert LB, Berman SS, Williams SK. The effects of porosity on endothelialization of ePTFE implanted in subcutaneous and adipose tissue. J Biomed Mater Res. 1997;34:463–476. doi: 10.1002/(sici)1097-4636(19970315)34:4<463::aid-jbm7>3.0.co;2-i. [DOI] [PubMed] [Google Scholar]
- 23.Updike SJ, Shults MC, Gilligan BJ, Rhodes RK. A sub-cutaneous glucose sensor with improved longevity, dynamic range, and stability of calibration. Diabetes Care. 2000;23:208–214. doi: 10.2337/diacare.23.2.208. [DOI] [PubMed] [Google Scholar]
- 24.Ward WK, Slobodzian EP, Tiekotter KL, Wood MD. The effect of microgeometry, implant thickness and polyurethane chemistry on the foreign body response to subcutaneous implants. Biomaterials. 2002;23:4185–4192. doi: 10.1016/s0142-9612(02)00160-6. [DOI] [PubMed] [Google Scholar]
- 25.Marshall AJ, Irvin CA, Barker T, Sage EH, Hauch KD, Ratner BD. Biomaterials with tightly controlled pore size that promote vascular in-growth. Abstr Pap Am Chem Soc. 2004;228:U386. [Google Scholar]
- 26.Shults MC, Updike SJ, Rhodes RK. United States Patent 7110803. DexCom, Inc.; Sep 19, 2006. Device and method for determining analyte levels. [Google Scholar]
- 27.Yu BZ, Long N, Moussy Y, Moussy F. A long-term flexible minimally-invasive implantable glucose biosensor based on an epoxy-enhanced polyurethane membrane. Biosensors Bio-electron. 2006;21:2275–2282. doi: 10.1016/j.bios.2005.11.002. [DOI] [PubMed] [Google Scholar]
- 28.Gilligan B, Shults MC, Rhodes RK, Jacobs PG, Brauker JH, Pintar TJ, Updike SJ. Feasibility of continuous long-term glucose monitoring from a subcutaneous glucose sensor in humans. Diabetes Technol Ther. 2004;6:378–386. doi: 10.1089/152091504774198089. [DOI] [PubMed] [Google Scholar]
- 29.Nam YS, Yoon JJ, Park TG. A novel fabrication method of macroporous biodegradable polymer scaffolds using gas foaming salt as a porogen additive. J Biomed Mater Res. 2000;53:1–7. doi: 10.1002/(sici)1097-4636(2000)53:1<1::aid-jbm1>3.0.co;2-r. [DOI] [PubMed] [Google Scholar]
- 30.Ramay HR, Zhang MQ. Preparation of porous hydroxyapatite scaffolds by combination of the gel-casting and polymer sponge methods. Biomaterials. 2003;24:3293–3302. doi: 10.1016/s0142-9612(03)00171-6. [DOI] [PubMed] [Google Scholar]
- 31.Zhang RY, Ma PX. Poly(a-hydroxyl acids) hydroxyapatite porous composites for bone-tissue engineering. I. Preparation and morphology. J Biomed Mater Res. 1999;44:446–455. doi: 10.1002/(sici)1097-4636(19990315)44:4<446::aid-jbm11>3.0.co;2-f. [DOI] [PubMed] [Google Scholar]
- 32.United States Pharmacopeia. Chapter 87. United States Pharmacopeial Convention; Rockville, Maryland: 2002. Biological reactivity tests, in vitro; pp. 2525–2526. [Google Scholar]
- 33.Koschwanez HE, Reichert WM. In vitro, in vivo and post explantation testing of glucose-detecting biosensors: Current methods and recommendations. Biomaterials. 2007;28:3687–3703. doi: 10.1016/j.biomaterials.2007.03.034. [DOI] [PMC free article] [PubMed] [Google Scholar]
- 34.Taborsky GJ, Halter JB, Baum D, Best JD, Porte D. Pentobarbital-anesthesia suppresses basal and 2-deoxy-D-glucose-stimulated plasma-catecholamines. Am J Physiol. 1984;247:R905–R910. doi: 10.1152/ajpregu.1984.247.5.R905. [DOI] [PubMed] [Google Scholar]
- 35.Zapp M, Kofke WA, Davis DW. Comparison of the effects of volatile anesthetics in varying concentrations on brain energy-metabolism with brain ischemia in rats. Neurochem Res. 1992;17:301–305. doi: 10.1007/BF00974569. [DOI] [PubMed] [Google Scholar]
- 36.Larry W. Personal Communication, Medtronic MiniMed. Northridge, CA: 2007. PhD, Research Manager. [Google Scholar]
- 37.Gilletti A, Muthuswamy J. Brain micromotion around implants in the rodent somatosensory cortex. J Neural Eng. 2006;3:189–195. doi: 10.1088/1741-2560/3/3/001. [DOI] [PubMed] [Google Scholar]
- 38.Maynard EM, Fernandez E, Normann RA. A technique to prevent dural adhesions to chronically implanted microelectrode arrays. J Neurosci Methods. 2000;97:93–101. doi: 10.1016/s0165-0270(00)00159-x. [DOI] [PubMed] [Google Scholar]
- 39.Long N, Yu B, Moussy Y, Moussy F. Strategies for testing long-term transcutaneous amperometric glucose sensors. Diabetes Technol Ther. 2005;7:927–936. doi: 10.1089/dia.2005.7.927. [DOI] [PubMed] [Google Scholar]
- 40.Knowles NG, Miyashita Y, Usui ML, Marshall AJ, Pirrone A, Hauch KD, Ratner BD, Underwood RA, Fleckman P, Olerud JE. A model for studying epithelial attachment and morphology at the interface between skin and percutaneous devices. J Biomed Mater Res A. 2005;74:482–488. doi: 10.1002/jbm.a.30384. [DOI] [PubMed] [Google Scholar]