Background: Cancer stem cells (CSCs) correlate to poorer clinical outcomes of many tumors.
Results: We identified a highly aggressive (CD44+/CD133+/EpCAM+) CSC-like fraction from pancreatic cancer (PC) cell lines with differential expression of many genes, including FoxQ1.
Conclusion: FoxQ1 knockdown inhibited CSC aggressiveness.
Significance: Targeting differentially expressed CSC-related genes could provide a novel approach for better treatment outcomes of aggressive PC tumors.
Keywords: Cancer Stem Cells, CD44, Flow Cytometry, Gene Expression, Microarray, Pancreatic Cancer, siRNA, Tumor Growth
Abstract
Subpopulations of cancer stem cells (CSCs) or cancer stem-like cells (CSLCs) have been identified from most tumors, including pancreatic cancer (PC), and the existence of these cells is clinically relevant. Emerging evidence suggests that CSLCs participate in cell growth/proliferation, migration/invasion, metastasis, and chemo-radiotherapy resistance, ultimately contributing to poor clinical outcome. However, the pathogenesis and biological significance of CSLCs in PC has not been well characterized. In the present study, we found that isolated triple-marker-positive (CD44+/CD133+/EpCAM+) cells of human PC MiaPaCa-2 and L3.6pl cells behave as CSLCs. These CSLCs exhibit aggressive behavior, such as increased cell growth, migration, clonogenicity, and self-renewal capacity. The mRNA expression profiling analysis showed that CSLCs (CD44+/CD133+/EpCAM+) exhibit differential expression of more than 1,600 mRNAs, including FoxQ1, compared with the triple-marker-negative (CD44−/CD133−/EpCAM−) cells. The knockdown of FoxQ1 by its siRNA in CSLCs resulted in the inhibition of aggressive behavior, consistent with the inhibition of EpCAM and Snail expression. Mouse xenograft tumor studies showed that CSLCs have a 100-fold higher potential for tumor formation and rapid tumor growth, consistent with overexpression of CSC-associated markers/mediators, including FoxQ1, compared with its parental MiaPaCa-2 cells. The inhibition of FoxQ1 attenuated tumor formation and growth, and expression of CSC markers in the xenograft tumor derived from CSLCs of MiaPaCa-2 cells. These data clearly suggest the role of differentially expressed genes in the regulation of CSLC characteristics, further suggesting that targeting some of these genes could be important for the development of novel therapies for achieving better treatment outcome of PC.
Introduction
Cancer stem-like cells (CSLCs)2 reminiscent of cancer stem cells (CSCs) or tumor-initiating cells defined by CD133+ were isolated and characterized from the bone marrow of acute myeloid leukemia patients in 1997 (1), which marked the discovery of the role of CSLCs in tumorigenesis and tumor progression. Although CSLCs are similar to normal adult stem cells to some extent, especially their self-renewal and differentiation capacity, CSLCs have unique characteristics, such as their highest capacity of self-renewal, differentiation into multiple cell lineages with greater proliferative potential, prolonged life span, and tumor-initiating potential in vivo (2–4). A large number of studies have shown clear evidence in support of the existence of CSLCs and their clinical implications because the rare subpopulations of CSLCs have been identified from most tumors, such as prostate, lung, breast, pancreas, brain, gastric, and colorectal tumors. These CSLCs are involved in cell growth, migration/invasion, and apoptosis resistance, attributing to treatment resistance and metastasis, leading to poor clinical outcome (2–4). However, the pathogenesis of CSLCs during tumorigenesis and tumor progression has not been well documented.
Although significant advances have been made in the fight against cancers, pancreatic cancer (PC) remains one of the most aggressive and lethal malignant diseases in the world, and remains the 4th leading cause of cancer-related death in the United States (5). For example, it was estimated that 45,220 people would be newly diagnosed with PC, and 38,460 patients would die in 2013 (5). Due to the lack of specific signs and symptoms and the lack of early detection techniques for PC, the majority of patients are diagnosed at an advanced stage (∼80% of newly diagnosed cases). The conventional treatments, including surgical resections and chemo-radiotherapy are not effective, which is in part due to therapeutic resistance and greater potential for locally advanced and metastatic disease. The majority of patients will die within an average of 5–6 months after diagnosis. The overall 5-year disease-free survival rate is 1–4%. It has been reported that very small subpopulations of CSCs (CSLCs), positive for CD133, can be identified from PC tissues (6). These CSLCs exhibit more aggressive phenotypes, such as increased tumorigenic and metastatic potentials in vitro and in vivo, respectively (6, 7). Therefore, the discovery, mechanistic understanding, and targeting approach for killing of CSLCs could open newer avenues for the treatment and/or prevention of tumor aggressiveness for PC.
In the present study, we isolated and characterized CD44+/CD133+/EpCAM+ (triple-marker-positive) cells from human PC cells (MiaPaCa-2 and L3.6pl cells) as the CSLCs. These CSLCs (triple-marker-positive cells) display aggressive behavior, such as enhanced cell growth, clonogenicity, cell migration, and CSC self-renewal capacity, which was consistent with increased expression of CSC signatures/mediators, compared with cells that are triple-marker-negative. The gene expression profiling analysis showed that CSLCs (triple-marker-positive cells) of MiaPaCa-2 cells display differential expressions of more than 1,600 genes, including Bmi1, BMP4, BST2, BTG1, FOLR1, FoxQ1, PRKAR1A, Sox4, TACSTD2, and Wnt3a. The knockdown of FoxQ1 by its siRNA led to attenuate aggressiveness and CSLC characteristics, which was consistent with inhibition of EpCAM and snail expression. The in vivo studies using a mouse xenograft tumor model showed that CSLSs derived from MiaPaCa-2 cells display a 100-fold higher potential for tumor formation and also faster tumor growth, which was consistent with overexpression of CSC-associated markers/mediators, including FoxQ1, compared with its parental cells. The inhibition of FoxQ1 by its siRNA attenuated tumor formation and growth, consistent with the down-regulation of CSC markers/mediators in xenograft tumor derived from CSLCs of MiaPaCa-2 cells. Our observation suggests that pathways that are activated in CSLCs could be targeted as novel therapies for PC.
MATERIALS AND METHODS
Cell Lines and Culture Conditions
CD44+/CD133+/EpCAM+ (triple-marker-positive cells) were isolated as the CSLCs from human pancreatic cancer cell line MiaPaCa-2 and L3.6pl cells by the fluorescence-activated cell sorting (FACS) technique and cultured in the serum-free sphere formation medium (1:1 DMEM/F-12K medium plus B27 and N2 supplements, Invitrogen) to maintain its undifferentiated status. Moreover, triple-marker-negative (CD44−/CD133−/EpCAM−) cells were isolated from MiaPaCa-2 and L3.6pl cells by the FACS technique and were also cultured in 5% fetal bovine serum (FBS)-DMEM at 37 °C in standard culture conditions, as described previously (8, 9). CD44+, CD133+, and EpCAM+ are known as stem cell surface proteins, which have been considered as the pancreatic CSLC (CSC) markers (3, 6, 10).
Sphere Formation Assay
The sphere formation assay was conducted to assess the CSLC self-renewal capacity, as described previously (8, 9). Briefly, 1,000 single suspended cells were seeded on the ultralow attachment wells of Costar 6-well plates (Corning Inc.) in 2 ml of sphere formation medium. After 7 days of incubation, the sphere cells termed “pancreatospheres” were harvested by centrifugation (300 × g for 5 min). The number of pancreatospheres was counted under a converted microscope.
Cell Growth Assay
The 3-(4,5-dimethylthiazol-2-yl)-2,5-diphenyltetrazolium bromide (MTT) assay was conducted to assess the cell survival or growth. Briefly, 5,000 cells/well were seeded in a 96-well plate and incubated in 5% FBS-DMEM medium overnight. After changing the medium, the cells were continued for the incubation. After 3 days of incubation, the cells were harvested for the standard MTT assay, as described previously (8, 11).
Colony Formation Assay
The colony formation assay was conducted to assess clonogenic potential of the cells, as described previously (8, 11). Briefly, 1,000 single viable cells were seeded in 10 ml of 5% FBS-DMEM in 10-cm Petri dishes. The cells were then incubated at 37 °C in a tissue culture incubator for 14 days. Colonies were stained with 2% crystal violet, washed with water, and counted.
Wound Healing Assay
The wound healing assay was conducted to assess the migration capacity of the cells under different experimental conditions, as described previously (8, 11). The cells were seeded in the 6-well plates in 3 ml of 5% FBS-DMEM medium in each well. When the confluence of the cells grew to 95% or above, they were then scratched with a 200-μl pipette tip. The wound healing capacity was assessed and photographed with a camera-equipped inverted microscope after 20 and 48 h of incubation.
Cell Cycle Analysis
A propidium iodide (PI) staining/flow cytometric assay was conducted to assess the cell cycle under different experimental conditions. After washing, the cells were fixed with 4 ml of 75% ethanol at −20 °C overnight. The fixed cells were washed and stained with PI-RNase A solution (Invitrogen) at 4 °C for 3 h, followed by a standard flow cytometric assay.
Apoptosis Assay
The annexin V/PI staining and flow cytometry assay was performed to evaluate apoptosis in the cells by using the FITC annexin V apoptosis detection kit (BD Pharmingen), following the manufacturer's instructions.
Quantitative Real-time RT-PCR of mRNAs
The mRNA levels of the cells were measured by the real-time RT-PCR assay, as described previously (8, 11). Total RNAs were isolated by using TRIzol solution (Invitrogen). Reverse transcription (RT) reactions of mRNAs were then conducted by using the High Capacity RNA-to-cDNA assay kit (Applied Biosystems), following the manufacturer's instructions. RT-PCRs of mRNAs were conducted by using the CYBR Green PCR Master Mix kit (Applied Biosystems). The primers of specific cDNAs were synthesized from Invitrogen. The Ct values were used for data analysis. GAPDH mRNA was used as the control to normalize the data of mRNAs in each sample.
Immunostaining and Confocal Imaging Microscopy
The protein expressions in the cells were assessed by an immunostaining/confocal imaging microscopic assay. After the cells reached 50–70% confluence on the 4-chamber culture glass slides in 0.5 ml of 5% FBS-DMEM, the cells were then harvested, washed, fixed with 4% formaldehyde PBS solution, and permeabilized with 0.05% Tween 20 solution. Antibodies against CD44, EpCAM, Notch-1, EZH2, and Snail (Cell Signaling) were applied for immunostaining, following the manufacturer's protocol. DAPI solution (Invitrogen) was used to stain the nucleus of the cells as the control. The antibody-labeled cells were examined and photographed under a confocal imaging microscope (EVOS Imaging Systems, ×100 magnifications).
Western Blot Analysis
The relative levels of proteins in the cells/tumor tissues were measured by Western blot analysis, as described previously (9). The protein lysis of the samples was prepared as described previously (9). The antibodies against EpCAM, EZH2, Notch-1, Snail, p65, phospho-Akt, and hypoxia-inducible factor-1α were obtained from Cell Signaling Technology. The antibodies against FoxQ1, IL-6, VEGF, and Bmi1 were obtained from Santa Cruz Biotechnology. The antibody against β-actin was obtained from Sigma.
The Gene Expression Profiling
The mRNA microarray assay was conducted for gene expression profiling analysis. Briefly, purified total RNAs were isolated by using the Vana mRNA isolation kit (Ambion Inc., Austin, TX), following the manufacturer's instructions. Total RNA quantity and quality was examined by analysis using NanoDrop and the Agilent Bioanalyzer (Agilent Technologies). All of the RNA samples had RNA Integrity Number (RIN) scores of ≥7. The whole genome expression profiling was analyzed by a two-color microarray-based approach. The RNA samples were hybridized to Agilent 4 × 44k human arrays and scanned with the Agilent G2505B scanner system. All of the data were analyzed by Agilent Feature Extraction software that generated expression data parameters, including LogRatio p values, LogRatio error, and p value LogRatio. The features included in further analysis were annotated, and gene level passed a p value LogRatio cut-off of ≤0.001. Analysis of variance and multiple test correction (Benjamin-Hochberg p ≤ 0.05) was conducted using Partek software to compare the two sets of four two-color arrayed replicates for the identification of the gene expression level changes (≥2-fold changes).
Transfections of FoxQ1 siRNA
FoxQ1 siRNA (Applied Biosystems) was transfected into the CSLCs (triple-marker-positive cells) by using the DharmaFECT transfection reagent (Thermo Scientific) following the manufacturer's instructions, as described previously (8, 11). The scrambled siRNA (negative control 2, Applied Biosystems) was used as the negative control. The transfected cells were used for either the sphere formation assay, wound healing assay, or real-time RT-PCR assay as described above.
Animal Experiment
The protocol for the animal experiment was approved by the Animal Investigation Committee of Wayne State University. Four-week-old CB17 severe combined immunodeficient (SCID) mice were obtained from Taconic Farms and maintained by feeding regular animal diets (Lab Diet 5021 (Purina Mills, Inc.)). 2 × 10⁶ MiaPaCa-2 cells or 2 × 10⁴ CSLC triple-marker-positive cells (pancreatosphere cells) under different conditions (control and FoxQ1 siRNA treatment) were implanted as described previously (9). The transfection of siRNAs was described as above. The tumor formation and growth were monitored every other day. After 34 days of inoculation, all of the animals were sacrificed, and tumor tissues from all of the animals were collected for further analysis, such as RT-PCR, Western blot analysis, and histological examination.
Immunohistochemistry
Fresh tumor tissues were fixed with zinc formalin solution (Thermo Scientific) overnight and evaluated by hematoxylin and eosin staining, and Immunohistochemistry was performed by a licensed laboratory technician in the Core Facility of the Department of Pathology, Wayne State University/Karmanos Cancer Institute, as described previously (9). The antibodies against CD44, EpCAM, Notch-1, and EZH2 were obtained from Cell Signaling Technology. The stained slides were examined by a licensed pathologist in the Department of Pathology, Wayne State University/Karmanos Cancer Institute.
Statistical Analysis
The data were prepared and presented as mean and S.D. by using GraphPad Prism and Excel software. Student's t test was performed to test significant difference between two groups. The p value equal or less than 0.05 was considered as statistically significant.
RESULTS
Isolations of CSLC Triple-marker-positive Cells and Triple-marker-negative Cells
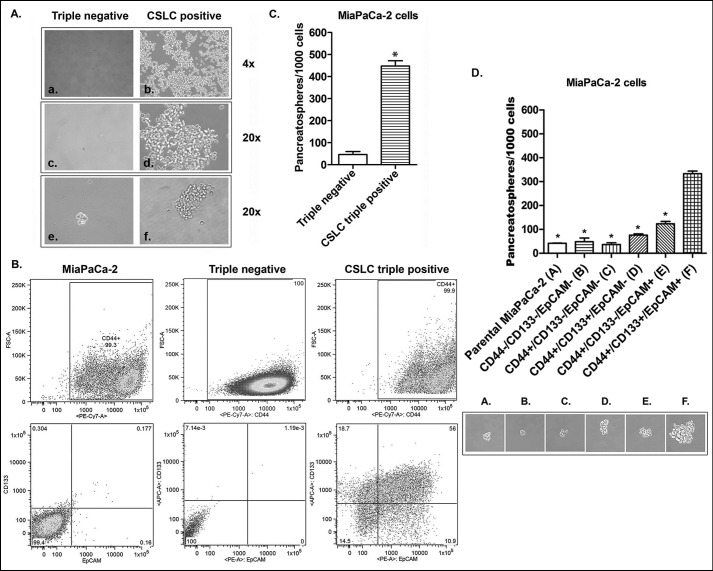
The CSLCs (triple-marker-positive cells) were isolated and established from four CD44+/CD133+/EpCAM+ (triple-marker-positive) cells of human PC MiaPaCa-2 cells by using the FACS technique. The triple-marker-negative cells were also isolated and established from 786,353 CD44−/CD133−/EpCAM− (triple-marker-negative) cells of MiaPaCa-2 cells by the FACS technique. After 4 weeks of incubation in the serum-free sphere formation medium, four isolated CSLCs (triple-marker-positive cells) survived and underwent self-renewal to become more than one million of the cells (Fig. 1A, b and d). However, four isolated triple-marker-negative cells failed to survive and grow (Fig. 1A, a and c). A flow cytometric assay was conducted to assess the percentage of triple-marker-positive cells in each subpopulation of cells. The results showed that only 0.18% of cells were triple-marker-positive (CD44+/CD133+/EpCAM+) in MiaPaCa-2 cells (Fig. 1B). Triple-marker-negative cells contained less than 0.01% triple-marker-positive (CD44+/CD133+/EpCAM+) cells (Fig. 1B). However, the CSLCs contained 56% triple-marker-positive (CD44+/CD133+/EpCAM+) cells (Fig. 1B). These data suggest that the triple-marker-negative and triple-marker-positive cells have stable genotypes.
FIGURE 1.
The characteristics of CSLCs (triple-marker-positive; CD44+/CD133+/EpCAM+ cells). A, recovery of four numbers of CSLCs (triple-marker-positive cells) isolated from human pancreatic cancer MiaPaCa-2 cells by FACS analysis after 4 weeks of incubation in sphere formation medium (A, a–d). e and f, photograph of sphere formation in CSLCs (triple-marker-positive cells) after 7 days of incubation in sphere formation medium. B, the percentages of CD44+/CD133+/EpCAM+ cells in MiaPaCa-2, triple-marker-negative CD44−/CD133−/EpCAM−, and triple-marker-positive CD44+/CD133+/EpCAM+ cells by flow cytometry. C, higher self-renewal capacity of CSLCs (triple-marker-positive cells) as assessed by the sphere formation assay. D, the CSC self-renewal capacity of cells with different combinations of CSLC triple markers isolated from MiaPaCa-2 cells by the FACS technique. The sphere formation assay was performed to evaluate the CSC self-renewal capacity of cells with different combinations of CSLC triple markers isolated from MiaPaCa-2 cells by the FACS technique. Error bars, S.D. (n = 3). *, p ≤ 0.05 (n = 3) compared with CSLC triple-marker-positive cells.
CSLC Self-renewal Capacity of Triple-marker-positive Cells
The sphere formation assay was conducted to assess the CSLCs self-renewal capacity. The results show that the triple-marker-positive cells had significantly increased numbers of pancreatospheres after 7 days of incubation in the serum-free sphere formation medium, compared with triple-marker-negative cells (Fig. 1, A (e and f) and C). We also examined CSC self-renewal capacity using different triple-marker combined phenotypes of MiaPaCa-2 cells, such as CD44−/CD44−/EpCAM−, CD44+/CD133−/EpCAM−, CD44+/CD133+/EpCAM−, CD44+/CD133−/EpCAM+, and CD44+/CD133+/EpCAM+ cells isolated by the FACS technique. The results showed that CSC triple-marker-positive cells had significantly higher levels of sphere formation, compared with their parental MiaPaCa-2 cells and other phenotypes of triple-marker combinations (Fig. 1D). There was no significant difference in the sphere formation capacity between MiaPaCa-2 cells and triple-marker-negative cells (p > 0.05; n = 3; Fig. 1D). These findings suggest that the CSLCs (triple-marker-positive cells) have a remarkably higher potential of self-renewal, suggesting that triple-marker-positive CSLCs are similar to CSCs.
Cell Growth of CSLCs (Triple-marker-positive Cells)
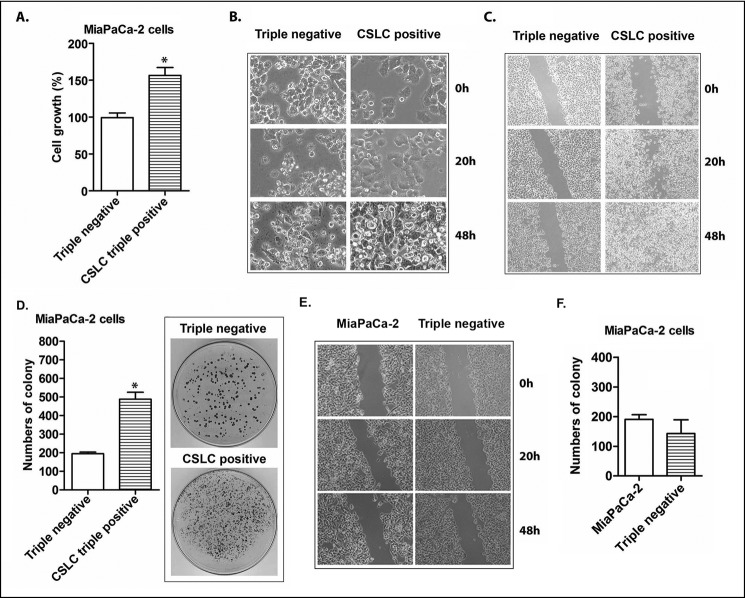
The MTT assay was conducted to assess the cell growth/proliferation of the CSLCs (triple-marker-positive cells) in 5% FBS-DMEM medium. The results show that the triple-marker-positive cells (CSLCs) had a remarkably increased cell growth capacity after 3 days of incubation, compared with the triple-marker-negative cells (p < 0.05; n = 3) (Fig. 2A). The triple-marker-negative cells exhibited more morphological changes similar to those in apoptotic cells than did the triple-marker-positive cells (Fig. 2B).
FIGURE 2.
The cell growth, migration, and clonogenicity of CSLCs (triple-marker-positive cells) compared with triple-marker-negative cells. A, the cell growth was evaluated by an MTT assay. B, morphology of CSLCs (triple-marker-positive cells) derived from MiaPaCa-2 cells compared with triple-marker-negative cells was assessed at 0, 20, and 48 h of incubation and photographed using a converted microscope (×20 magnification). C, cell migration capacity of CSLCs (triple-marker-positive cells) compared with triple-marker-negative cells was evaluated by a wound healing assay (×10 magnification). D, clonogenic potentials of CSLCs (triple-marker-positive cells) compared with triple-marker-negative cells as assessed by a colony formation assay. E, cell migration of triple-marker-negative cells (CD44−/CD133−/EpCAM−) and their parental MiaPaCa-2 cells. F, clonogenicity of triple-marker-negative cells (CD44−/CD133−/EpCAM−) and their parental MiaPaCa-2 cells. Error bars, S.D. *, p ≤ 0.05 (n = 3).
Apoptosis of CSLCs (Triple-marker-positive Cells)
The results from the apoptosis assay showed that CSLC triple-marker-positive cells derived from MiaPaCa-2 cells had more alive and fewer early apoptotic/dead cells, compared with the triple-marker-negative cells cultured in the FBS-free sphere formation medium (Table 1), and CSLCs were able to replicate much faster, compared with the triple-marker-negative cells (Figs. 1 (C and D) and 2B). These findings suggest that CSLCs have increased resistance to apoptosis.
TABLE 1.
Apoptosis of the CSLC triple-marker-positive cells versus the triple-marker-negative cells derived from MiaPaCa-2 cells
Cells were incubated in FBS-free sphere-forming medium for 7 days, followed by annexin V staining, and assessed by flow cytometric analysis. Means ± S.D. are shown. n = 3 independent experiments.
| Triple-marker-negative cells (n = 3) | CSLC triple-marker-positive cells (n = 3) | p value | |
|---|---|---|---|
| Alive (%) | 50.60 ± 1.85 | 59.43 ± 0.40 | 0.003 |
| Early apoptotic (%) | 22.47 ± 2.30 | 12.17 ± 0.63 | 0.004 |
| Late apoptotic (%) | 14.03 ± 1.35 | 22.50 ± 0.30 | 0.001 |
| Non-apoptotic dead (%) | 12.93 ± 1.86 | 5.91 ± 1.08 | 0.009 |
Cell Cycle Patterns of CSLCs (Triple-marker-positive Cells)
The PI staining/flow cytometry assay was conducted to assess the cell cycle of the CSLCs (triple-marker-positive cells). The results show that CSLCs (triple-marker-positive cells) had a significantly decreased G1 phase and had increased G2 phase and S phase, compared with triple-marker-negative cells (Table 2). These findings suggest that CSLCs (triple-marker-positive cells) have a different pattern of cell cycle.
TABLE 2.
Cell cycles of CSLC triple-marker-positive cells versus triple-marker-negative cells
Cell cycles were analyzed by propidium iodide (PI) staining and flow cytometric assay. Means ± S.D. are shown. n = 3 independent experiments.
| Triple-marker-negative cells (n = 3) | CSLC triple-marker-positive cells (n = 3) | p value | |
|---|---|---|---|
| G1 (%) | 84.50 ± 2.70 | 73.67 ± 1.12 | 0.0002 |
| G2 (%) | 4.74 ± 2.11 | 8.98 ± 2.30 | 0.0174 |
| S phase (%) | 10.77 ± 4.80 | 17.35 ± 3.32 | 0.0325 |
Cell Migration of CSLCs (Triple-marker-positive Cells)
The wound healing assay was conducted to assess the cell migration capacity of triple-marker-positive cells (CSLCs). The results showed that the triple-marker-positive cells (CSLCs) have a greater wound healing capacity after 20 h and 24 h of incubation in 5% FBS-DMEM, compared with the triple-marker-negative cells (Fig. 2C). There was no significant difference in wound healing capacity between MiaPaCa-2 cells and triple-marker-negative cells (Fig. 2E). These data suggest that triple-marker-positive CSLCs have a higher capacity of cell migration.
Clonogenicity of CSLCs (Triple-marker-positive Cells)
The clonogenic potential of the cells was assessed by the colony formation assay. The results showed that the triple-marker-positive cells (CSLCs) had a significantly increased capacity for the formation of colonies in 5% FBS-DMEM, compared with the triple-marker-negative cells (Fig. 2D) (p < 0.05; n = 3). There was no significant difference in colony formation capacity between MiaPaCa-2 cells and triple-marker-negative cells (p > 0.05; n = 3; Fig. 2F). These findings suggest that CSLCs (triple-marker-positive cells) exhibit significantly higher clonogenic potential.
CSLCs (Triple-marker-positive Cells) Exhibit High Expression of CSC Signatures/Markers
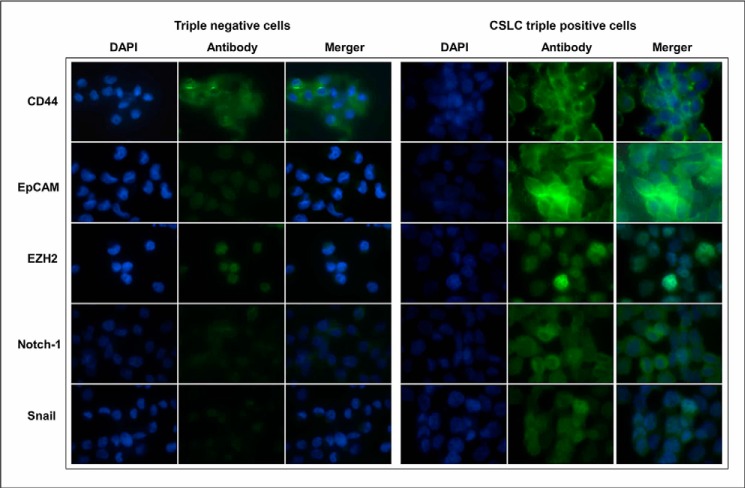
The confocal imaging microscopic assay was conducted to examine the protein expression of CSC signatures/markers in the cells. The results show that the CSLCs (triple-marker-positive cells) had increased protein expression of CD44, EpCAM, EZH2, Notch-1, and Snail compared with triple-marker-negative cells (Fig. 3). CD44, CD133, and EpCAM are known as cancer stem cell surface markers (3, 6, 10). EZH2, Notch-1, and Snail are known to play a key role in tumor development and progression and have been considered as potential CSC-positive markers (3, 12, 13). Our data suggest that the CSLCs (triple-marker-positive cells) have remarkably higher expression of CSC signatures/markers.
FIGURE 3.
The expression of CSLC markers in triple-marker-positive cells compared with triple-marker-negative cells. Confocal imaging microscopy was performed to evaluate the protein expression of CD44, EpCAM, EZH2, Notch-1, and Snail. DAPI was used to stain the nucleus of the cells. Magnification, ×100.
Differential Expression Profiling of mRNAs in CSLCs (Triple-marker-positive Cells)
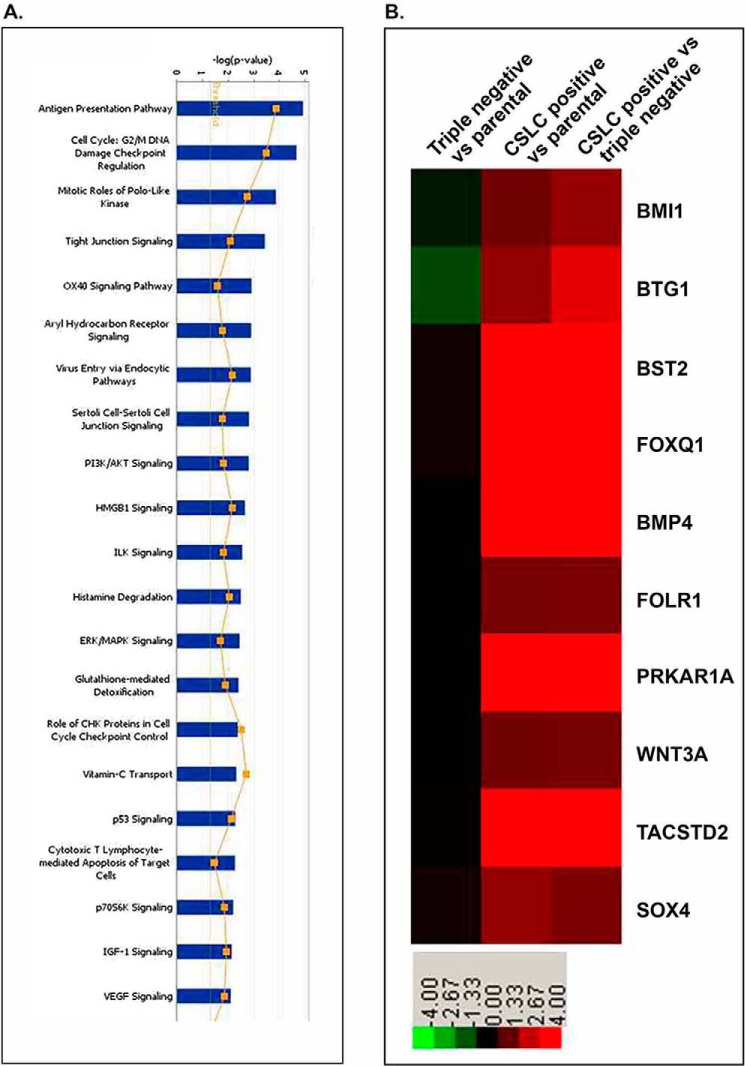
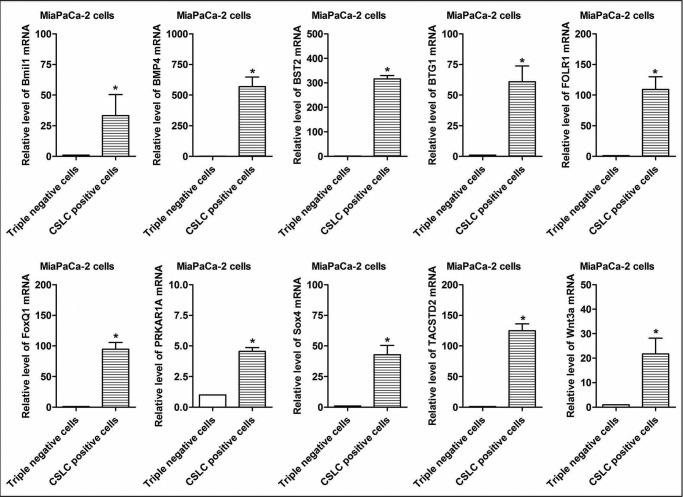
Microarray analysis was performed to examine the differential expression of mRNAs in the CSLCs (triple-marker-positive cells), compared with triple-marker-negative cells. 1,653 mRNAs were identified to be differentially expressed in CSLCs (triple-marker-positive) versus triple-marker-negative cells (supplemental Table 1). Among these genes, 753 mRNAs were up-regulated, and 900 mRNAs were down-regulated in the CSLCs (triple-marker-positive cells), compared with triple-marker-negative cells (supplemental Table 1). 1,581 mRNAs were identified to be differentially expressed in CSLCs (triple-marker-positive) versus their parental MiaPaCa-2 cells (data not shown here; see supplemental Table 1). There were 1,216 differentially expressed genes that overlapped between the CSLCs (triple-marker-positive cells) versus triple-marker-negative or MiaPaCa-2 cells (data not shown here; see supplemental Table 1). The pathway enrichment analysis shows that differential expression of selected genes is involved in 21 of the major biological function groups, including cell cycle, polo-like kinase, tight junction, cell-cell junction, insulin-like growth factor-1, PI3K/Akt, ERK/MAPK, and VEGF signaling (Fig. 4A). Fig. 4B and Table 3 show the differential expression of 10 selected genes, such as Bmi1 (polycomb ring finger oncogene), BMP4 (bone morphogenetic protein 4), BST2 (bone marrow stromal cell antigen 2), BTG1 (B-cell translocation gene 1), FOLR1 (folate receptor 1), FoxQ1 (forkhead box Q1), PRKAR1A (protein kinase, cAMP-dependent, regulatory, type I, α), Sox4 (sex-determining region Y-box 4), TACSTD2 (tumor-associated calcium signal transducer 2), and Wnt3a (Wingless-type MMTV integration site family, member 3A).
FIGURE 4.
A, pathway enrichment analysis of the altered expression of genes in CSLCs (triple-marker-positive cells) of MiaPaCa-2 cells compared with triple-marker-negative cells. B, heat map of selective CSLCs and tumor-associated genes in the triple-marker-positive cells. Microarray of mRNAs was performed by using Agilent 4 × 44k human array chips at least in triplicates. Green, negative -fold changes; red, positive -fold changes, compared with parental MiaPaCa-2 and triple-marker-negative cells.
TABLE 3.
Selective gene expression profiles in CSLC triple-marker-positive cells versus triple-marker-negative cells derived from MiaPaCa-2 cells as assessed by microarray analysis
| GenBankTM ID | Gene symbol | Gene description | -Fold changea |
|---|---|---|---|
| ILMN_1700915 | Bmi1 | BMI1 polycomb ring finger oncogene | 3.928 |
| ILMN_1740900 | BMP4 | Bone morphogenetic protein 4 | 40.432 |
| ILMN_1723480 | BST2 | Bone marrow stromal cell antigen 2 | 14.311 |
| ILMN_1775743 | BTG1 | B-cell translocation gene 1, anti-proliferative | 8.577 |
| ILMN_1661733 | FOLR1 | Folate receptor 1 (adult) | 3.103 |
| ILMN_1669046 | FoxQ1 | Forkhead box Q1 | 20.781 |
| ILMN_2389590 | PRKAR1A | Protein kinase, cAMP-dependent, regulatory, type I, α | 13.915 |
| ILMN_1815745 | Sox4 | SRY (sex-determining region Y)-box 4 | 3.08 |
| ILMN_1739001 | TACSTD2 | Tumor-associated calcium signal transducer 2 | 37.126 |
| ILMN_1815700 | Wnt3a | Wingless-type MMTV integration site family, member 3A | 2.973 |
a -Fold change (log2) was calculated based on the data comparisons of CSLC triple-marker-positive cells versus triple-marker-negative cells.
Real-time RT-PCR Assay of Selected mRNAs
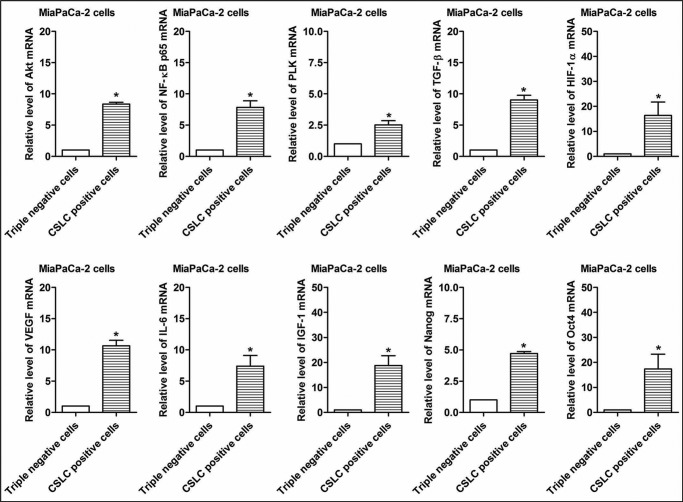
We selected 10 differentially expressed mRNAs for validation of mRNA microarray data in the CSLCs (triple-marker-positive cells) compared with triple-marker-negative cells by real-time RT-PCR. The results confirmed that the CSLCs (triple-marker-positive cells) have significantly increased expression of Bmi1, BMP4, BST2, BTG1, FOLR1, FoxQ1, PRKAR1A, Sox4, TACSTD2, and Wnt3a genes, compared with the triple-marker-negative cells (Fig. 5), as shown by the microarray data (Table 3). We also examined the gene expression of CSLCs signature genes and tumor-related markers in the CSLCs (triple-marker-positive cells) by real-time RT-PCR. The results show that the CSLCs (triple-marker-positive cells) have increased expression of Nanog, Oct4, Akt, p65, PLK (polo-like kinase), TGF-β (transforming growth factor-β), HIF-α (hypoxia-inducible factor-1α), VEGF, IL-6 (interleukin-6), and IGF-1 (insulin-like growth factor-1), compared with triple-marker-negative cells (Fig. 6).
FIGURE 5.
Validation of differential expression of selected CSC- and tumor-associated genes in CSLCs (triple-marker-positive cells) of MiaPaCa-2 cells. A real-time RT-PCR assay was performed to measure the relative mRNA levels in CSLCs and tumor-associated markers. GAPDH mRNA was used as the control. Error bars, S.D. *, p ≤ 0.05 (n = 3).
FIGURE 6.
The expression of selected genes associated with oncogenic signaling pathways in CSLCs (triple-marker-positive cells). A real-time RT-PCR assay was performed to measure the relative mRNA levels in CSLCs and tumor-associated markers. GAPDH mRNA was used as the control. Error bars, S.D. *, p ≤ 0.05 (n = 3).
The Expression of CSC-associated Proteins in CSLCs
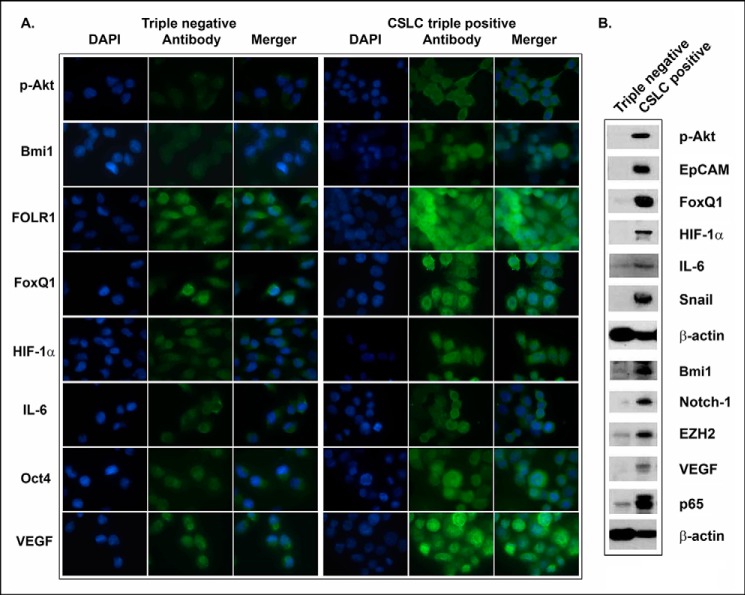
The results from confocal image microscopy and Western blot analysis showed that CSLC triple-marker-positive cells derived from MiaPaCa-2 cells have remarkably higher expression of phospho-Akt, Bmi1, FOLR1, FoxQ1, hypoxia-inducible factor-1α, IL-6, VEGF, Oct4, EZH2, Notch-1, EpCAM, p65, and Snail, compared with the triple-marker-negative cells (Fig. 7, A and B).
FIGURE 7.
The expression of CSC-associated proteins in CSLC triple-marker-positive cells and the triple-marker-negative cells derived from MiaPaCa-2 cells. Confocal image microscopy (A) and Western blot analysis (B) were performed to evaluate the expression of CSC-associated marker proteins in CSLC triple-marker-positive cells and the triple-marker-negative cells derived from MiaPaCa-2 cells. An individual blot was performed for each marker.
The Role of FoxQ1 in the Regulation of CSLC Phenotypes and Functions in Triple-marker-positive Cells
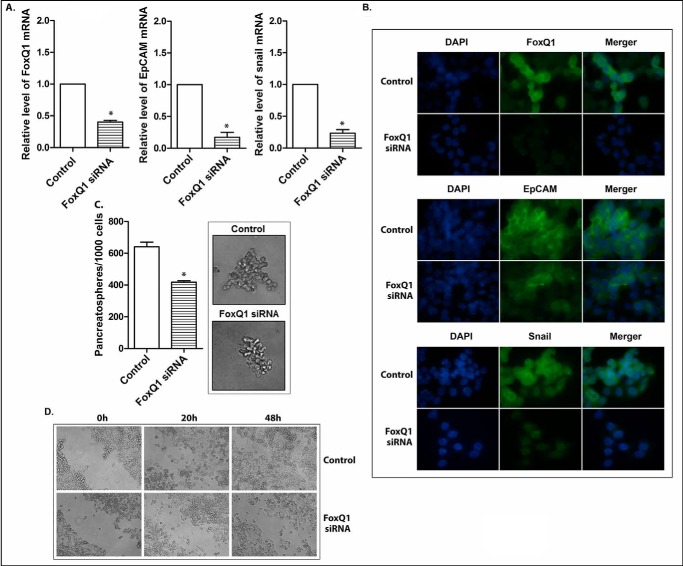
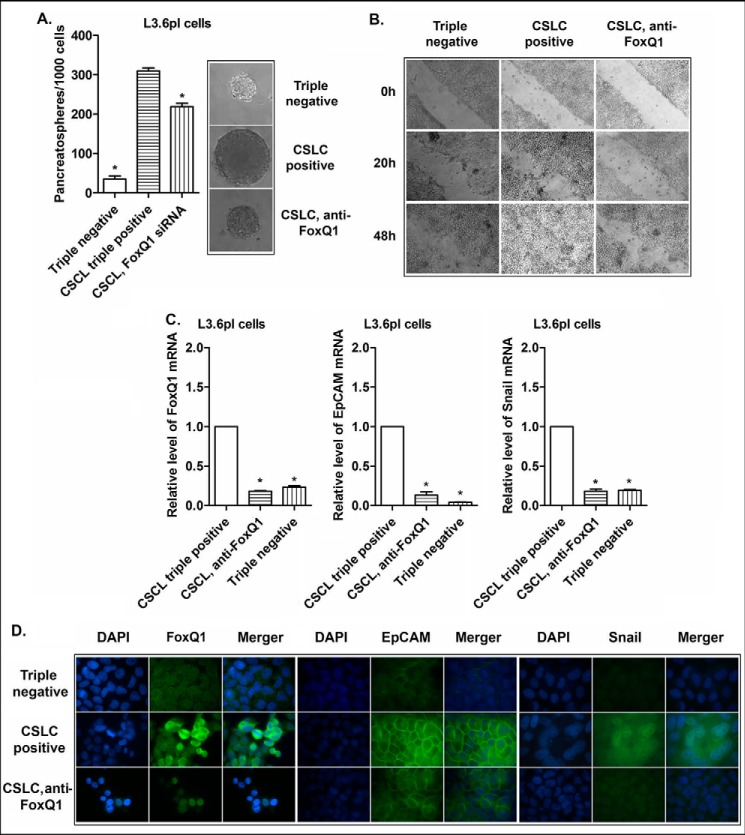
The altered expression of FoxQ1 has been reported to correlate with poorer clinical prognosis of various tumors (14–16). The evidence from in vitro and in vivo experimental studies suggests that FoxQ1 may play an important role in tumorigenesis and tumor development by the regulation of various oncogenic signaling pathways (14–16). In the present study, the CSLCs (triple-marker-positive cells) of MiaPaCa-2 cells showed higher expression of FoxQ1, compared with triple-marker-negative cells, as described earlier (Figs. 4B, 5, and 7). To explore the potential role of FoxQ1 in the regulation of CSLC phenotypes and functions, we conducted the functional loss of expression study of FoxQ1 by transfection of its siRNA into the CSLCs (triple-marker-positive cells). The results show that the transfection of FoxQ1 siRNA significantly decreased the mRNA and protein levels of FoxQ1 in the CSLCs (Fig. 8, A and B). The knockdown of FoxQ1 decreased the relative mRNA and protein levels of EpCAM and Snail in these cells (Fig. 8, A and B). The knockdown of FoxQ1 also resulted in a significant decrease in the formation of pancreatospheres and wound healing capacity of these cells (Fig. 8, C and D). Similarly, CSLC triple-marker positive cells isolated from another human pancreatic cancer L3.6pl cells by FACS technique have also displayed aggressive phenotypes, such as overexpression of FoxQ1, EpCAM, and Snail, as well as increased capacity of CSC self-renewal and higher potential of cell migration, compared with the triple-marker-negative cells derived from L3.6pl cells (Fig. 9). The knockdown of FoxQ1 by its siRNA inhibited these aggressive phenotypes (Fig. 9), which were observed in CSLCs derived from MiaPaCa-2 cells. These findings clearly suggest that FoxQ1 may play an important role in the regulation of CSLC phenotypes and functions, and thus targeting FoxQ1 could become a novel therapeutic approach for PC.
FIGURE 8.
The effect of knockdown of FoxQ1 on EpCAM and Snail mRNAs (A) and proteins (B), CSLC self-renewal capacity (C), and clonogenicity (D) of triple-marker-positive cells derived from MiaPaCa-2 cells. The transfection of FoxQ1 siRNA was performed in CSLCs (triple-marker-positive cells). Real-time RT-PCR was performed to measure FoxQ1, EpCAM, and Snail mRNAs in triple-marker-positive cells. Confocal imaging microscopy was performed to evaluate the protein expression. DAPI was used to stain the nucleus of the cells. Magnification, ×100. Sphere formation and wound healing assays were performed to evaluate the self-renewal and cell migration capacities of CSLCs, respectively. Error bars, S.D. *, p ≤ 0.05 (n = 3).
FIGURE 9.
The CSC self-renewal capacity, cell migration, and the expression of EpCAM and Snail in the triple-marker-negative cells and the CSLC triple-marker-positive cells derived from L3.6pl cells under different conditions. Sphere formation assay and wound healing assays were performed to evaluate the CSC self-renewal capacity (A) and cell migration (B), respectively, in the triple-marker-negative cells and the CSLC triple-marker-positive cells derived from L3.6pl cells under different conditions. The quantitative RT-PCR assay (C) and confocal image microscopy (D) were performed to examine the expression of EpCAM and Snail in these cells. The transfection of FoxQ1 siRNA was performed in the CSLC triple-marker-positive cells derived from L3.6pl cells, as described under “Materials and Methods.” Error bars, S.D. *, p ≤ 0.05 (n = 3).
Tumor Formation and Growth in Mouse Xenograft Tumor Models
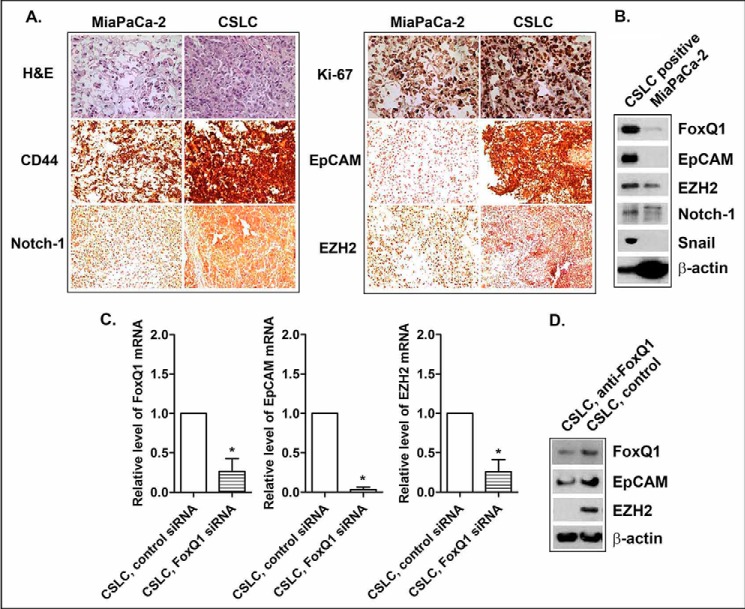
Mouse xenograft tumor studies showed that the implantation of 2 × 10⁴ CSLSs (pancreatosphere cells) has a 100-fold higher potential for tumor formation, compared with the implantation of 2 × 10⁶ of their parental MiaPaCa-2 cells (Table 4). CSLCs have also displayed rapid growth in the xenograft tumor model after 34 days of inoculation (874.8 ± 504.4 mg versus 333.5 ± 163.6 mg, comparing CSLCs versus MiaPaCa-2 cells; Table 4). The underexpression of FoxQ1 by its siRNA attenuated tumor formation and growth (Table 4). The histological study showed that xenograft tumors derived from CSLCs displayed more necrosis and a dedifferentiated state and also had higher expression of Ki-67 (tumor proliferation index) and CSC-associated proteins, such as FoxQ1, CD44, EpCAM, EZH2, Notch-1, and Snail, compared with xenograft tumor derived from their parental MiaPaCa-2 cells (Fig. 10, A and B). The knockdown of FoxQ1 decreased the expression of CSC markers, such as EpCAM and EZH2, in xenograft tumor derived from CSLCs (Fig. 10, C and D). These findings suggest that CSLCs have very high potential of tumor formation and growth, consistent with overexpression of CSC markers/mediators, including FoxQ1, in vivo. The inhibition of FoxQ1 expression attenuated tumor formation and growth, consistent with the down-regulation of CSC markers/mediators, such as EpCAM and EZH2, in vivo.
TABLE 4.
Characteristics of mouse xenograft tumors derived from parental and CSLC triple-marker-positive cells derived from MiaPaCa-2 cells
4-week-old SCID mice were transplanted with MiaPaCa-2 cells under different conditions. One mouse had spontaneous death in this group (MiaPaCa-2, plus FoxQ1 siRNA). After 34 days of inoculation, the animals were sacrificed, and the tumor was analyzed for histology, Western blot analysis, and quantitative RT-PCR analysis.
| Cell numbers of inoculation per animal | Tumor incidence (5 animals/group) | Tumor weight (mean ± S.D.) | p value | |
|---|---|---|---|---|
| mg | ||||
| Parental MiaPaCa-2, siRNA control | 2 × 10⁶ | 4/5 | 333.5 ± 163.6 | <0.05a |
| Parental MiaPaCa-2, FoxQ1 siRNA | 2 × 10⁶ | 0/5 | 0.0 ± 0.0 | |
| CSLC, siRNA control | 2 × 10⁴ | 4/5 | 874.8 ± 504.4 | |
| CSLC, FoxQ1 siRNA | 2 × 10⁴ | 1/5 | 126 ± 0.0 | <0.05b |
a,b p values less than 0.05 of the CSLC control group, compared with the MiaPaCa-2 control group and CSLC FoxQ1 siRNA group, respectively.
FIGURE 10.
Characteristics of the expression of CSC-associated markers/mediators in mouse xenograft tumors derived from CSLCs and MiaPaCa-2 cells under different conditions. The histology of H&E staining/immunohistochemistry (A) and Western blot analysis (B) was performed in the xenograft tumors derived from CSLCs and their parental MiaPaCa-2 cells. The quantitative RT-PCR assay (C) and Western blot analysis (D) were performed in the xenograft tumors derived from CSLCs of siRNA control versus FoxQ1 siRNA. An individual blot was performed for each marker.
DISCUSSION
It has now been well accepted that CSCs (CSLCs) play a critical role during tumorigenesis and tumor progression because the existence of CSLCs has significant clinical implications. The rare population of CSLCs (<0.1%) has been found in many different tumors, including pancreatic cancer (PC), and is related to the poorer clinical outcomes, such as reduced disease-free survival rate and increased mortality (6). Different from tumor non-CSLCs, this minority fraction of CSLC subpopulations exhibits distinct features, such as the highest capacity of self-renewal, prolonged survival potential, and greater capacity of differentiation into multiple different cell types of tumor cells or tumor-associated cells. Emerging evidence suggests that these features are believed to be associated with increased cell growth/proliferation, cell migration/invasion, treatment resistance, and metastasis, leading to poor clinical outcome in most tumors, including PC (17). In the present study, we found that CD44+/CD133+/EpCAM+ cells (triple-marker-positive cells) of pancreatic cancer cells behave like CSCs (CSLCs). These CSLCs that are characterized as triple-marker-positive cells have aggressive phenotypes and functions, which is consistent with overexpression of CSC signatures/markers in vitro and in vivo. Therefore, understanding and targeted killing of these CSLCs would provide a newly effective therapeutic approach for the treatment of aggressive tumors, including PC. However, the regulation of CSLC characteristics during tumorigenesis and tumor progression has not been clearly elucidated. Therefore, further characterization of CSLCs may lead to the discovery of genes that could be targeted for therapy, as discussed below.
In our study, we found overexpression of FoxQ1 (forkhead box Q1) in CSLCs, which is a member of the forkhead transcription factor family known to be critically involved in the regulation of gene expression during different biological processes, such as early development, metabolism, and immune function. Emerging evidence suggests that FoxQ1 may have an important function during tumorigenesis and tumor progression mediated by deregulation of several signaling pathways such as epithelial-to-mesenchymal transition (EMT), a biological process known to be associated with drug resistance and metastasis and also known to be linked with CSLC characteristics (3, 12, 13). Recent clinical studies have shown high levels of FoxQ1 expression in gastric cancer, colorectal cancer, and non-small cell lung cancer (14–16). Moreover, several in vitro and in vitro experimental studies have shown that FoxQ1 expression increases cell growth/proliferation, migration/invasion, angiogenesis, tumorigenicity, and metastasis, which was found to be mediated by the up-regulation of NRXN3 (neurexin 3, a tumor prognostic marker), ZEB1/2, VEGF, Wnt, and BCL in different tumor cells, such as breast, liver, glioma, colorectal, and ovarian cancers (16, 18–20). In addition, the expression of FoxQ1 is regulated by TGF-β (20), which suggests that TGF-β-mediated overexpression of FoxQ1 may lead to the acquisition of EMT, a process that is reminiscent of CSC (CSLC) characteristics. The blockage of FoxQ1 by its siRNA inhibitor has been found to inhibit cell invasion and metastasis in vitro through the reversal of EMT in bladder cancer cells (21). However, the role of FoxQ1 in the regulation of CSC (CSLC) phenotypes and functions during tumorigenesis and tumor progression has not been clearly elucidated. In our current study, we demonstrate, for the first time, that higher expression of FoxQ1 is associated with CSLCs signatures/markers and functions in triple-marker-positive cells (CSLCs) isolated from pancreatic cancer cells. The knockdown of FoxQ1 by its siRNA inhibitor resulted in the attenuation of aggressive CSLC phenotypes, consistent with the inhibition in the expression of EpCAM in triple-marker-positive cells (CSLCs) in vivo and in vivo. These data clearly suggest that FoxQ1 plays a key role in the regulation of CSLC phenotypes and functions.
We also found overexpression of bone morphogenetic proteins, such as BMP4, which belongs to a class of important extracellular signaling transducer proteins and also belongs to the TGF-β superfamily. This protein has been considered to exhibit a critical role in early development (22). The clinical data showed that the altered expressions of BMP4 in various tumors, including PC, were found to be associated with poor clinical prognosis. Increased numbers of in vitro and in vivo experimental studies have confirmed the evidence that BMP4 plays an important role in tumorigenesis and tumor progression mediated by promoting cell growth/proliferation and migration/invasion via several signaling pathways/networks, including apoptosis and PI3K/Akt, Wnt, hedgehog, and EMT in different cancers, including PC (23, 24). However, there are some controversial reports showing an inhibitory effect of BMP4 on tumor cell growth in vitro and in vivo. Therefore, the biological function of BMP4 appears to be tumor context-dependent. The role of BMP4 in the regulation of CSLC phenotypes and functions has not been molecularly investigated. There are some limited studies that suggest that BMP4 may be involved in the regulation of CSC phenotypes and functions. For example, BMP4 could decrease cell growth and proliferation in CSC-like CD133+ cells of glioblastoma in vitro and in vivo (25). Moreover, experimental studies have shown that BMP4 can up-regulate the proliferation of human adipose-derived stem cells and maintain its stem cell phenotypes and functions in an autocrine and dose-dependent fashion (25–27). It has also been noted that Lin-28 and Oct4, known stem cell factors, work together to up-regulate the expression of BMP4 at the post-transcriptional level, which contributes to the modulation of the ovarian tumor microenvironment (28). In our present study, we found that CSLCs (triple-marker-positive cells) exhibit aggressive tumor cell phenotypes and functions, which was consistent with overexpression of BMP4 and other stem cell markers, suggesting that BMP4 may have an important role in the regulation of CSC (CSLC) characteristics. However, further mechanistic studies are needed for determining the role of BMP4 in CSLCs of PC.
Studies have shown that folate receptor α (FOLR1) could be one such target because FOLR1 is known as a cell surface glycoprotein that regulates the transport of folic acid into the cells. It is well known that the metabolism of folate/folate receptor α plays a critical role in the early development. In most normal adult tissues, FOLR1 is present at a very low level or undetectable; however, increasing amounts of clinical data suggest that FOLR1 is highly expressed in many different tumors, such as lung, ovarian, uterine, colorectal, and pituitary tumors (29–33), which has been shown to be highly associated with poor clinical outcome, such as decreased disease-free survival and increased chemotherapy resistance (29), a feature that is the hallmark of CSLCs (CSCs). Experimental studies have shown that the blockage of folate receptor α by its monoclonal antibody led to the inhibition of human ovarian tumor cell growth in vitro and in vivo (31), suggesting the critical role of FOLR1 in the maintenance of tumor aggressiveness. However, the role of FOLR1 in the regulation of CSLC phenotypes and function is not clear, although FOLR2 has been found to be overexpressed in acute myeloid leukemia blast cell lines and other hematopoietic progenitor cells (34). Therefore, our triple-marker-positive CSLC model could be a useful model for further investigation with respect to the expression of FOLR1/2 and the cellular consequence of targeting FOLR1/2 in PC.
In summary, our data clearly suggest that the CSLCs (triple-marker-positive; CD44+/CD133+/EpCAM+) exhibit aggressive phenotypes and functions, such as enhanced cell growth, clonogenicity, cell migration, and self-renewal capacity, all of which were consistent with increased expression of CSC (CSLC) signatures/markers. The CSLCs (triple-marker-positive cells) also exhibit differential expression of about 1,600 mRNAs, including Bmi1, BMP4, BST2, BTG1, FOLR1, FoxQ1, PRKAR1A, Sox4, TACSTD2, and Wnt3a, compared with triple-marker-negative cells. The knockdown of FoxQ1 by transfection of its siRNA inhibitor reduced clonogenicity, cell migration, and self-renewal capacity, which was also consistent with the inhibition of CSC (CSLC) signatures/markers, such as EpCAM and Snail, in the CSLCs (triple-marker-positive cells). Mouse xenograft tumor models indicate that CSLCs have a significantly higher potential for tumor formation and faster tumor growth, consistent with overexpression of CSC-associated markers/mediators, including FoxQ1. The inhibition of FoxQ1 resulted in the attenuation of tumor formation and growth and expression of CSC markers in xenograft tumor derived from CSLCs. These findings clearly suggest that differentially expressed mRNAs may play a key role in the regulation of CSC (CSLC) phenotypes and functions, especially through increased expression of Bmi1, BMP4, BST2, BTG1, FOLR1, FoxQ1, PRKAR1A, Sox4, TACSTD2, and Wnt3a.
Supplementary Material
Note Added in Proof
The online version of this article, published on April 9, 2014, contains an error in Fig. 1B. The top panel labeled “CSLC triple positive” was duplicated and used in place of the correct “Triple negative” panel. The correct “Triple negative” panel appears in the final version of this article. This change does not affect the interpretation of the results or the conclusions.

This article contains supplemental Table 1.
The data reported in this paper have been deposited in the Gene Expression Omnibus (GEO) database, www.ncbi.nlm.nih.gov/geo (accession no. GSE51971).
- CSLC
- cancer stem-like cell
- CSC
- cancer stem cell
- PC
- pancreatic cancer
- PI
- propidium iodide
- MTT
- 3-(4,5-dimethylthiazol-2-yl)-2,5-diphenyltetrazolium bromide
- EMT
- epithelial-to-mesenchymal transition.
REFERENCES
- 1. Bonnet D., Dick J. E. (1997) Human acute myeloid leukemia is organized as a hierarchy that originates from a primitive hematopoietic cell. Nat. Med. 3, 730–737 [DOI] [PubMed] [Google Scholar]
- 2. Hermann P. C., Mueller M. T., Heeschen C. (2009) Pancreatic cancer stem cells: insights and perspectives. Expert Opin. Biol. Ther. 9, 1271–1278 [DOI] [PubMed] [Google Scholar]
- 3. Li Y., Kong D., Ahmad A., Bao B., Sarkar F. H. (2013) Pancreatic cancer stem cells: emerging target for designing novel therapy. Cancer Lett. 338, 94–100 [DOI] [PMC free article] [PubMed] [Google Scholar]
- 4. Sarkar F. H., Li Y., Wang Z., Kong D. (2009) Pancreatic cancer stem cells and EMT in drug resistance and metastasis. Minerva Chir. 64, 489–500 [PMC free article] [PubMed] [Google Scholar]
- 5. Siegel R., Naishadham D., Jemal A. (2013) Cancer statistics, 2013. CA Cancer J. Clin. 63, 11–30 [DOI] [PubMed] [Google Scholar]
- 6. Hermann P. C., Huber S. L., Herrler T., Aicher A., Ellwart J. W., Guba M., Bruns C. J., Heeschen C. (2007) Distinct populations of cancer stem cells determine tumor growth and metastatic activity in human pancreatic cancer. Cell Stem Cell 1, 313–323 [DOI] [PubMed] [Google Scholar]
- 7. Li C., Heidt D. G., Dalerba P., Burant C. F., Zhang L., Adsay V., Wicha M., Clarke M. F., Simeone D. M. (2007) Identification of pancreatic cancer stem cells. Cancer Res. 67, 1030–1037 [DOI] [PubMed] [Google Scholar]
- 8. Bao B., Ali S., Kong D., Sarkar S. H., Wang Z., Banerjee S., Aboukameel A., Padhye S., Philip P. A., Sarkar F. H. (2011) Anti-tumor activity of a novel compound-CDF is mediated by regulating miR-21, miR-200, and PTEN in pancreatic cancer. PLoS One 6, e17850. [DOI] [PMC free article] [PubMed] [Google Scholar] [Retracted]
- 9. Bao B., Ali S., Banerjee S., Wang Z., Logna F., Azmi A. S., Kong D., Ahmad A., Li Y., Padhye S., Sarkar F. H. (2012) Curcumin analogue CDF inhibits pancreatic tumor growth by switching on suppressor microRNAs and attenuating EZH2 expression. Cancer Res. 72, 335–345 [DOI] [PMC free article] [PubMed] [Google Scholar]
- 10. Yin S., Li J., Hu C., Chen X., Yao M., Yan M., Jiang G., Ge C., Xie H., Wan D., Yang S., Zheng S., Gu J. (2007) CD133 positive hepatocellular carcinoma cells possess high capacity for tumorigenicity. Int. J. Cancer 120, 1444–1450 [DOI] [PubMed] [Google Scholar]
- 11. Ali S., Ahmad A., Banerjee S., Padhye S., Dominiak K., Schaffert J. M., Wang Z., Philip P. A., Sarkar F. H. (2010) Gemcitabine sensitivity can be induced in pancreatic cancer cells through modulation of miR-200 and miR-21 expression by curcumin or its analogue CDF. Cancer Res. 70, 3606–3617 [DOI] [PMC free article] [PubMed] [Google Scholar] [Retracted]
- 12. Kong D., Banerjee S., Ahmad A., Li Y., Wang Z., Sethi S., Sarkar F. H. (2010) Epithelial to mesenchymal transition is mechanistically linked with stem cell signatures in prostate cancer cells. PLoS One 5, e12445. [DOI] [PMC free article] [PubMed] [Google Scholar]
- 13. van Vlerken L. E., Kiefer C. M., Morehouse C., Li Y., Groves C., Wilson S. D., Yao Y., Hollingsworth R. E., Hurt E. M. (2013) EZH2 is required for breast and pancreatic cancer stem cell maintenance and can be used as a functional cancer stem cell reporter. Stem Cells Transl. Med. 2, 43–52 [DOI] [PMC free article] [PubMed] [Google Scholar]
- 14. Feng J., Zhang X., Zhu H., Wang X., Ni S., Huang J. (2012) FoxQ1 overexpression influences poor prognosis in non-small cell lung cancer, associates with the phenomenon of EMT. PLoS One 7, e39937. [DOI] [PMC free article] [PubMed] [Google Scholar]
- 15. Liang S. H., Yan X. Z., Wang B. L., Jin H. F., Yao L. P., Li Y. N., Chen M., Nie Y. Z., Wang X., Guo X. G., Wu K. C., Ding J., Fan D. M. (2013) Increased expression of FOXQ1 is a prognostic marker for patients with gastric cancer. Tumour Biol. 34, 2605–2609 [DOI] [PubMed] [Google Scholar]
- 16. Kaneda H., Arao T., Tanaka K., Tamura D., Aomatsu K., Kudo K., Sakai K., De Velasco M. A., Matsumoto K., Fujita Y., Yamada Y., Tsurutani J., Okamoto I., Nakagawa K., Nishio K. (2010) FOXQ1 is overexpressed in colorectal cancer and enhances tumorigenicity and tumor growth. Cancer Res. 70, 2053–2063 [DOI] [PubMed] [Google Scholar]
- 17. Hermann P. C., Bhaskar S., Cioffi M., Heeschen C. (2010) Cancer stem cells in solid tumors. Semin. Cancer Biol. 20, 77–84 [DOI] [PubMed] [Google Scholar]
- 18. Sun H. T., Cheng S. X., Tu Y., Li X. H., Zhang S. (2013) FoxQ1 promotes glioma cells proliferation and migration by regulating NRXN3 expression. PLoS One 8, e55693. [DOI] [PMC free article] [PubMed] [Google Scholar]
- 19. Xia L., Huang W., Tian D., Zhang L., Qi X., Chen Z., Shang X., Nie Y., Wu K. (2014) FoxQ1 promotes hepatocellular carcinoma metastasis by trans-activating ZEB2 and VersicanV1 expression. Hepatology 59, 958–973 [DOI] [PubMed] [Google Scholar]
- 20. Zhang H., Meng F., Liu G., Zhang B., Zhu J., Wu F., Ethier S. P., Miller F., Wu G. (2011) Forkhead transcription factor foxq1 promotes epithelial-mesenchymal transition and breast cancer metastasis. Cancer Res. 71, 1292–1301 [DOI] [PMC free article] [PubMed] [Google Scholar]
- 21. Zhu Z., Zhu Z., Pang Z., Xing Y., Wan F., Lan D., Wang H. (2013) Short hairpin RNA targeting FOXQ1 inhibits invasion and metastasis via the reversal of epithelial-mesenchymal transition in bladder cancer. Int. J. Oncol. 42, 1271–1278 [DOI] [PubMed] [Google Scholar]
- 22. Kallioniemi A. (2012) Bone morphogenetic protein 4: a fascinating regulator of cancer cell behavior. Cancer Genet. 205, 267–277 [DOI] [PubMed] [Google Scholar]
- 23. Katoh Y., Katoh M. (2009) Hedgehog target genes: mechanisms of carcinogenesis induced by aberrant hedgehog signaling activation. Curr. Mol. Med. 9, 873–886 [DOI] [PubMed] [Google Scholar]
- 24. Katoh Y., Katoh M. (2006) Hedgehog signaling pathway and gastrointestinal stem cell signaling network (review). Int. J. Mol. Med. 18, 1019–1023 [PubMed] [Google Scholar]
- 25. Altaner C. (2008) Glioblastoma and stem cells. Neoplasma 55, 369–374 [PubMed] [Google Scholar]
- 26. Villageois P., Wdziekonski B., Zaragosi L. E., Plaisant M., Mohsen-Kanson T., Lay N., Ladoux A., Peraldi P., Dani C. (2012) Regulators of human adipose-derived stem cell self-renewal. Am. J. Stem Cells 1, 42–47 [PMC free article] [PubMed] [Google Scholar]
- 27. Vicente López M. A., Vázquez García M. N., Entrena A., Olmedillas Lopez S., García-Arranz M., García-Olmo D., Zapata A. (2011) Low doses of bone morphogenetic protein 4 increase the survival of human adipose-derived stem cells maintaining their stemness and multipotency. Stem Cells Dev. 20, 1011–1019 [DOI] [PubMed] [Google Scholar]
- 28. Ma W., Ma J., Xu J., Qiao C., Branscum A., Cardenas A., Baron A. T., Schwartz P., Maihle N. J., Huang Y. (2013) Lin28 regulates BMP4 and functions with Oct4 to affect ovarian tumor microenvironment. Cell Cycle 12, 88–97 [DOI] [PMC free article] [PubMed] [Google Scholar]
- 29. Allard J. E., Risinger J. I., Morrison C., Young G., Rose G. S., Fowler J., Berchuck A., Maxwell G. L. (2007) Overexpression of folate binding protein is associated with shortened progression-free survival in uterine adenocarcinomas. Gynecol. Oncol. 107, 52–57 [DOI] [PubMed] [Google Scholar]
- 30. D'Angelica M., Ammori J., Gonen M., Klimstra D. S., Low P. S., Murphy L., Weiser M. R., Paty P. B., Fong Y., Dematteo R. P., Allen P., Jarnagin W. R., Shia J. (2011) Folate receptor-α expression in resectable hepatic colorectal cancer metastases: patterns and significance. Mod. Pathol. 24, 1221–1228 [DOI] [PubMed] [Google Scholar]
- 31. Ebel W., Routhier E. L., Foley B., Jacob S., McDonough J. M., Patel R. K., Turchin H. A., Chao Q., Kline J. B., Old L. J., Phillips M. D., Nicolaides N. C., Sass P. M., Grasso L. (2007) Preclinical evaluation of MORAb-003, a humanized monoclonal antibody antagonizing folate receptor-α. Cancer Immun. 7, 6. [PMC free article] [PubMed] [Google Scholar]
- 32. Toffoli G., Russo A., Gallo A., Cernigoi C., Miotti S., Sorio R., Tumolo S., Boiocchi M. (1998) Expression of folate-binding protein as a prognostic factor for response to platinum-containing chemotherapy and survival in human ovarian cancer. Int. J. Cancer 79, 121–126 [DOI] [PubMed] [Google Scholar]
- 33. Wood L. D. (2012) Folate receptor α: a new tool in the diagnosis and treatment of lung cancer. Oncotarget 3, 668–669 [DOI] [PMC free article] [PubMed] [Google Scholar]
- 34. Clarhaut J., Fraineau S., Guilhot J., Peraudeau E., Tranoy-Opalinski I., Thomas M., Renoux B., Randriamalala E., Bois P., Chatelier A., Monvoisin A., Cronier L., Papot S., Guilhot F. (2013) A galactosidase-responsive doxorubicin-folate conjugate for selective targeting of acute myelogenous leukemia blasts. Leuk. Res. 37, 948–955 [DOI] [PubMed] [Google Scholar]
Associated Data
This section collects any data citations, data availability statements, or supplementary materials included in this article.


