Background: The O-GlcNAc-processing enzymes, O-GlcNAc transferase and O-GlcNAcase, regulate metazoan cellular function by the addition or removal of O-GlcNAc on proteins.
Results: Aberrant O-GlcNAc processing reduces mitochondrial protein expression and respiration.
Conclusion: The addition and removal of O-GlcNAc on proteins, defined as O-GlcNAc cycling, regulates mitochondrial function.
Significance: Altering the expression of the O-GlcNAc cycling enzymes dramatically impacts mitochondrial function and metabolite production.
Keywords: Glycobiology, Glycosylation, Mass Spectrometry (MS), Metabolomics, Mitochondria, Mitochondrial Metabolism
Abstract
Mitochondrial impairment is commonly found in many diseases such as diabetes, cancer, and Alzheimer disease. We demonstrate that the enzymes responsible for the addition or removal of the O-GlcNAc modification, O-GlcNAc transferase (OGT) and O-GlcNAcase (OGA), respectively, are critical regulators of mitochondrial function. Using a SILAC (stable isotope labeling of amino acids in cell culture)-based proteomics screen, we quantified the changes in mitochondrial protein expression in OGT- and OGA-overexpressing cells. Strikingly, overexpression of OGT or OGA showed significant decreases in mitochondria-localized proteins involved in the respiratory chain and the tricarboxylic acid cycle. Furthermore, mitochondrial morphology was altered in these cells. Both cellular respiration and glycolysis were reduced in OGT/OGA-overexpressing cells. These data demonstrate that alterations in O-GlcNAc cycling profoundly affect energy and metabolite production.
Introduction
O-GlcNAc is the post-translational addition of a single N-acetylglucosamine residue to cytoplasmic and nuclear proteins (1). The O-GlcNAc modification is ubiquitously found in all higher eukaryotes. O-GlcNAc transferase (OGT)2 is the enzyme responsible for the addition of O-GlcNAc to intracellular proteins whereas O-GlcNAcase (OGA) removes the modification from intracellular proteins (2). These enzymes are expressed in all mammalian cells with highest expression levels in brain (1). The addition or removal of O-GlcNAc is termed O-GlcNAc cycling, and altering O-GlcNAc cycling rates affects metabolic pathways, stress response, and cell cycle progression (1–3).
In the past several years, multiple groups have demonstrated links between metabolic disorders and O-GlcNAcylation. For example, several proteins involved in insulin signaling, including insulin receptor substrate 1 (IRS1), are modified by O-GlcNAc. OGT localizes to the plasma membrane shortly after insulin binding to the insulin receptor, suggesting that relocation of OGT to the membrane suppresses insulin signaling by O-GlcNAcylating IRS1 (4–7). Elevated glucose levels impair glycogen synthase function through increased O-GlcNAcylation of glycogen synthase (8). Furthermore, chronic hyperglycemia causes an increase in O-GlcNAcylation of CRTC2 (cyclic adenosine monophosphate response element-binding protein 2), thereby promoting increased gluconeogenesis through interactions with the CREB transcription factor (9). Concomitantly, the transcription factor FOXO1 is O-GlcNAcylated, which increases the transcription of gluconeogenesis genes such as glucose-6-phosphatase and phosphoenolpyruvate carboxykinase (10). Together, these data demonstrate the importance of O-GlcNAcylation in regulating metabolic function.
Mitochondrial function is also regulated by O-GlcNAc. Several respiratory chain proteins are modified by O-GlcNAc, and increased O-GlcNAcylation impairs respiration (11, 12). A splice variant of OGT (mOGT) localizes to the mitochondria (11, 13, 14), and in INS-1 cells mOGT overexpression causes cellular apoptosis (15). Recently, several studies suggest that chronic hypoglycemia increases O-GlcNAcylation and promotes metabolic disease by inducing mitochondrial dysfunction (16, 17). For example, changes in cellular glucose levels in cardiac myocytes are linked to altered O-GlcNAcylation, which in turn lead to changes in mitochondrial function (11, 18). Rats selected for low running capacity had increased mitochondrial O-GlcNAcylation, suggesting that increased mitochondrial O-GlcNAc impairs respiration (19). Together, these data demonstrate a critical role for O-GlcNAcylation in the regulation of mitochondrial function.
To address more fully how alterations in O-GlcNAc-processing enzymes affect mitochondrial function, we performed a proteomics-based study in a neuronal cell line in which we quantified changes in mitochondrial protein expression after overexpression of OGT or OGA. Overexpression of either enzyme caused a alterations in the expression of proteins involved in the respiratory chain as well as a reduction in several TCA cycle proteins. Mitochondrial morphology was greatly altered, and cellular respiration and glycolysis rates were significantly reduced. Together, our data demonstrate that both O-GlcNAc-processing enzymes regulate mitochondrial and cytosolic bioenergetic fluxes and infrastructure. Our data imply that mitochondrial function is sensitive to O-GlcNAc cycling.
MATERIALS AND METHODS
Antibodies
All antibodies were used at a 1:1000 dilution for immunoblotting unless otherwise noted. COX IV antibody was purchased from Invitrogen (A21348). The following antibodies were purchased from Abcam: Metaxin-1 (AB104966), ACADM (AB92461), NDUFA5 (AB183706), and NDUFA9 (AB14713). Actin (A2066) and GFP (G6539) were from Sigma. Antibodies for OGT (AL-28, Al-35), OGA (341), and O-GlcNAc (110.6) were a kind gift from the laboratory of Gerald Hart in the department of Biological Chemistry at the Johns Hopkins University School of Medicine.
Cell Culture
SY5Y neuroblastoma cells were cultured in DMEM (Sigma) supplemented with 10% fetal bovine serum (FBS; Gemini) and 1% penicillin/streptomycin (Invitrogen). For stable isotope labeling of amino acids on cell culture (SILAC), SY5Y cells were cultured in DMEM (Cambridge Isotope, DMEM-500) supplemented with unlabeled arginine, lysine, and tyrosine (Sigma; A8094, L5501, and T8566), DMEM supplemented with 13C6-arginine, 4,4,5,5-D4-lysine, and tyrosine (Cambridge Isotope CLM-2265 and DLM-2640), or DMEM supplemented with 13C6-15N4-arginine, 13C6-15N2-lysine, and tyrosine (Cambridge Isotope CNLM-539 and CNLM-291). All SILAC media were supplemented with 10% dialyzed FBS (Gemini 100-108) and 1% penicillin/streptomycin. Cells were passaged at least five times in labeled media before performing an experiment. Cells were infected with OGT, OGA, or GFP virus at a multiplicity of infection of 75. Cells were then harvested for either MS analysis or respiration analysis 48 or 24 h after infection, respectively.
Mitochondrial Isolation
All mitochondria were isolated using the modified nitrogen cavitation method described by Gottlieb and Adachi (20). At least 2 × 10⁸ cells were used. The cells were digested off the plate with trypsin, washed twice with prechilled PBS, and resuspended into 3 ml of the isolation medium (225 mm mannitol, 75 mm sucrose, 5 mm Hepes, 1 mm EGTA, pH 7.4, at 4 °C). The cell suspension was collected into a prechilled cavitation chamber (nitrogen bomb; Parr Instrument Company, Moline, IL) and was subjected to 900 p.s.i. for a 15-min period. The collected cell suspension from the cavitation chamber was centrifuged at 1500 × g for 3 min to pellet the cell debris (heavy particles or fractions of cells). The supernatant was collected and centrifuged at 20,000 × g for 10 min. The pellet (crude mitochondrial fraction) was washed three times with 500 μl of isolation medium. The final pellet was resuspended in 100 μl of Nonidet P-40 lysis buffer (20 mm Tris-HCl, pH 7.4, 150 mm NaCl, 1 mm EDTA, 1 mm DTT, 40 mm GlcNAc, and 1% Nonidet P-40, all reagents from Sigma) and lysed on ice for 30 min with occasional vortexing.
Immunoblotting
All electrophoresis was performed with 4–15% gradient polyacrylamide gels (Criterion Gels; Bio-Rad). Cell lysates were mixed with protein solubility mixture (100 mm Tris, pH 6.8, 10 mm EDTA, 8% SDS, 50% sucrose, 5% β-mercaptoethanol, 0.08% Pyronin-Y; Sigma) and separated at 120 volts, followed by transfer to PVDF membrane at 0.4 amps (Immobilon, Millipore). All antibodies were used at a 1:1000 dilution for immunoblotting (21). Blots were developed using HRP-conjugated secondary (anti-rabbit HRP 170-6515 and anti-mouse HRP 170-6516, Bio-Rad; anti-IgM HRP A8786 and anti-IgY HRP A9046; Sigma) and chemiluminescent substrate (HyGlo E2400; Denville Scientific). Blots were stripped in 100 mm glycine (Sigma), pH 2.5, for 1 h, washed, and then treated as before (21).
Mass Spectral Sample Preparation
Mitochondrial preparations were combined according to equal protein amounts and run on a 4–15% gradient gel. Following Coomassie Blue staining, each lane was cut into 19 consecutive strips and subjected to in-gel digestion. Briefly, gel bands were washed twice with 50% acetonitrile in 25 mm ammonium bicarbonate (NH4HCO3) and vacuum-dried. Then, gel pieces were rehydrated in 25 μl of digestion buffer (10 ng/μl trypsin in 25 mm NH4HCO3) for 10 min at 4 °C. The digestion was performed overnight at 37 °C. Tryptic peptides were extracted twice with 50% acetonitrile and 5% formic acid. Extracted peptides were vacuum-dried to a final volume of 20 μl in 0.1% formic acid.
Mass Spectrometric Analysis
The digested peptides were analyzed in duplicate by nanoflow reversed phase chromatography and mass spectrometry using an Eksigent 2D high performance liquid chromatography system (AB SCIEX, Dublin, CA) equipped with a FAMOS auto sampler. Peptides were loaded onto a C18 reversed phase peptide trap (100-μm inner diameter fused silica packed in-house with 2 cm of 100 Å, 5-μm, Magic C18 particles; Michrom Bioresources). Following a wash with 0.1% formic acid for 15 min at 0.5 μl/min, the peptide trap was connected to a reversed phase C18 resolving column (75-μm inner diameter, packed with 10 cm of the same material) that was mounted on the electrospray stage of a Fourier transform ion cyclotron resonance MS (LTQ FT; ThermoFinnigan, San Jose, CA). Peptides were eluted at a flow rate of 0.3 μl/min over a 120-min period using a gradient of 5–60% acetonitrile (buffer A = 0.1% formic acid; buffer B = acetonitrile, 0.1% formic acid). The source was operated at 1.9 kV, with the ion transfer temperature set to 250 °C. LC MS data were obtained in a hybrid linear ion trap Fourier transform ion cyclotron resonance MS equipped with a 7-tesla magnet. The MS was controlled using the Xcalibur software package to continuously perform mass scan analysis on the Fourier transform, followed by tandem MS scans on the ion trap for the six most intense ions, with a dynamic exclusion of two repeat scans (30-s repeat duration and 90-s exclusion duration) of the same ion. Normalized collision energy for tandem MS was set to 35%.
Peptide Identification and Computational Analysis
Peaks Studio (version 7.0; BSI, Waterloo, ON, Canada) was used to analyze the mass spectra. The following criteria were used for the searches: data refinement was performed with no merged scans, with precursor charge correction and with no filtering. De novo sequencing was performed with a mass tolerance of 25 ppm for the parent and 0.4 for the fragment ion, using trypsin as enzyme specificity, carbamidomethyl cysteine as a fixed modification, and variable modifications of oxidation (Met), deamidation (Asn, Gln), pyroGlu from Gln. Because proteins were isotopically labeled, variable modification for Lys (+4.03 and +8.01 for medium and heavy label, respectively) and Arg (+6.02 and 10.02 for medium and heavy label, respectively) was also considered. A maximum of three variable modifications and two missed cleavages per peptide were allowed. The resulting peptide sequences were searched against a human IPI protein database (version 3.87). Estimation of the false discovery rate was conducted by searching all spectra against a decoy-fusion (inverted) database. Peptide identifications were accepted if they could be established at a false discovery rate <1%. For protein identification, proteins were accepted if they could be established at a Peaks protein probability score (−10lgP) better than 20 with a minimum of two unique peptides per protein. Proteins that contain similar peptides and could not be differentiated based on tandem MS analysis alone were grouped to satisfy the principle of parsimony; only the top ranked protein sequence is reported under “Results.” For protein quantitation the Peaks Q module included in the Peaks Studio (Peaks Studio v7.0) was used. For precursor ion quantification the mass tolerance was set up to 0.2 Da and a retention time tolerance of 1 min, using an upper bound charge state of 4. For each experimental data set, protein ratios were calculated relative to the control (GFP cells) and were calculated on the average of total peaks intensities of the top three unique peptides identified per protein group. For each protein group, the data of at least two experimental data sets from all searches were combined and averaged. Only proteins that showed a 1.5-fold expression change were considered noteworthy.
Electron Microscopy
SY5Y cells were cultured on Thermanox® coverslips and infected with a 75 multiplicity of infection of GFP, OGT, or OGA adenovirus 24 h prior to fixation. Cells were fixed with 2% glutaraldehyde in 0.1 m cacodylate buffer, pH 7.4, and were postfixed with 1% osmium tetroxide/0.3% potassium ferricyanide. The cells were then dehydrated in a graded series of 50, 70, 80, 95, and 100% ethanol. Cells on coverslips were embedded in 100% epoxy resin, and the resin was cured overnight at 60 °C. Thin sections of 70–90 nm were cut on a Reichert Ultracut-S (Reichert Technologies, Buffalo, NY) and stained with uranyl acetate and lead citrate. Images were captured at 80 kV with JEOL JEM-1400 Transmission Electron Microscope (JEOL USA, Peabody, MA) equipped with a Lab6 gun at the University of Kansas Medical Center EM Core Laboratory.
Cellular Respiration and Glycolysis Measurement
To measure cellular respiration and glycolysis, we used an XF24 flux analyzer (Seahorse Bioscience, North Billerica, MA). All cellular respiration and glycolysis assays were performed in a Seahorse 24-well cell culture plate in conjunction with an XF24 sensor cartridge on at least three separate occasions. SY5Y cells were seeded as a monolayer with a density of 65,000 cells/well and were infected with OGT, OGA, or GFP virus for 24 h prior to experimental assays. For respiration assays, cells were incubated in unbuffered DMEM (DMEM, 8.3 g/liter, Sigma D5030–1L pH 7.4), 25 mm glucose, phenol red (15 mg/liter, Sigma P-5530), 200 mm GlutaMax-1, NaCl (1.85 g/liter), at 37 °C in a CO2-free incubator for 1 h prior to loading the plate in the XF24 to allow temperature and pH equilibrium. The oxygen consumption rate was measured over a period of 100 min over which time oligomycin (0.5 μm), FCCP (0.3 μm), and both antimycin A (0.2 μm) and rotenone (0.1 μm) were sequentially added to each well at specified time points. For glycolysis assays, cells were incubated in glycolysis stress test base glucose-free medium (DMEM, 8.3 g/liter, pH 7.4) containing 40 μm phenol red (Sigma P-5530), 2 mm l-glutamine, and NaCl (1.85 g/liter) at 37 °C in a CO2-free incubator for 1 h prior to loading the plate in the XF24 to allow temperature and pH equilibrium. The extracellular acidification rate (ECAR) was measured over a period of 100 min. Glucose (25 mm), oligomycin (1 μm), and 2-deoxy-d-glucose (100 mm) were added to each well sequentially at specified time points during the assay.
Statistical Analysis
For comparisons of data containing three groups, we used one-way analysis of variance followed by Tukey's post hoc tests to compare mean differences of groups at a significance threshold of p < 0.05.
RESULTS
OGT/OGA Overexpression Alters Mitochondrial O-GlcNAcylation and Protein Expression
To determine how changes in O-GlcNAc cycling affect mitochondria protein expression, we overexpressed either OGT or OGA through adenoviral-mediated infection. Importantly, we choose to use the full-length OGT over the mitochondrial form of OGT because we wanted to determine how changes in O-GlcNAc cycling would affect expression of both nuclear-encoded mitochondrial genes and subsequently any mitochondrial-encoded genes. Because neuronal function is highly dependent on oxidative metabolism, we used as a model cell line SY5Y neuroblastoma cells. We selected this line because of its rapid expansion, its ease of overexpression, its neuronal background (OGT and OGA expression is robust in brain) and because SY5Y cells are relatively sensitive to changes in mitochondrial function (22). After overexpression we isolated a heavy membrane preparation enriched for mitochondria and measured O-GlcNAcylation levels. Green fluorescent protein (GFP) was used as a control for adenoviral infection. GFP-expressing control mitochondria contained numerous O-GlcNAcylated proteins. Both OGT and OGA expression robustly increased in the respectively transfected cells. Overexpressing the nuclear-cytoplasmic form of OGT dramatically increased O-GlcNAc levels whereas OGA overexpression profoundly reduced O-GlcNAc levels (Fig. 1).
FIGURE 1.
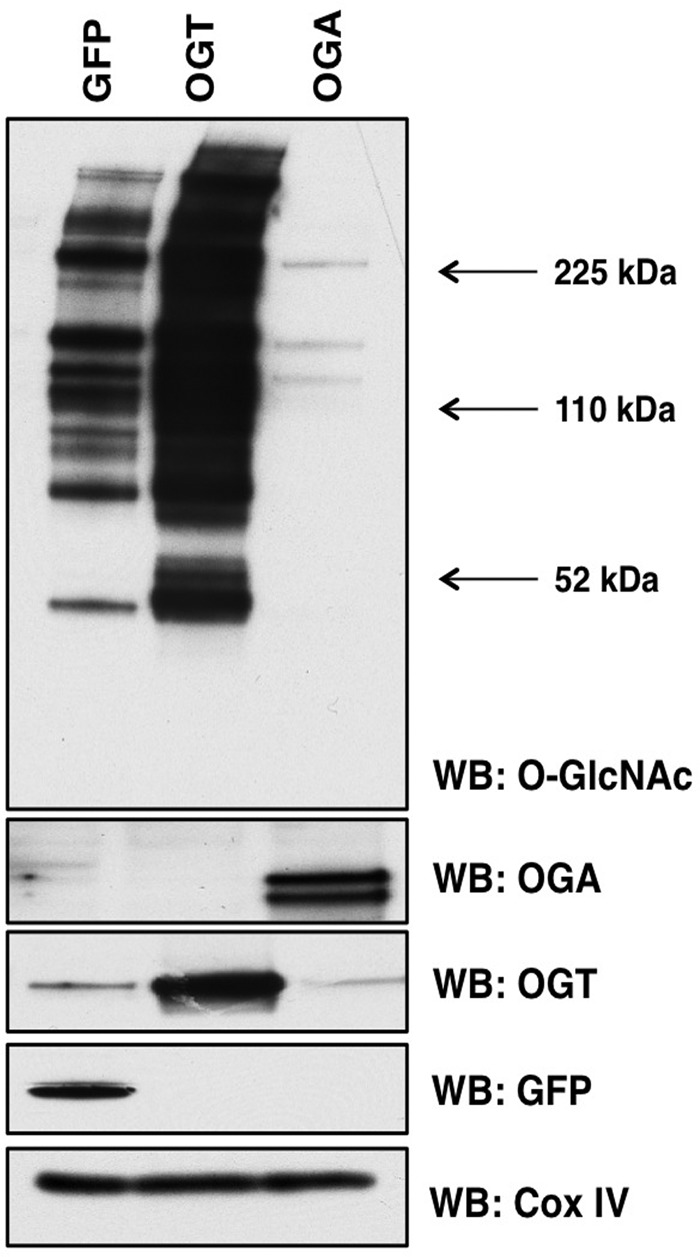
OGT or OGA overexpression alters mitochondrial O-GlcNAcylation. Mitochondria were purified from SY5Y cells expressing GFP, OGT, or OGA and probed for total O-GlcNAc. As expected, total O-GlcNAc levels are increased in OGT-expressing cells and decreased in OGA-expressing cells. COX IV was used as a loading control. WB, Western blotting.
Next, we generated SILAC-labeled SY5Y cells to determine how OGT/OGA overexpression changes the expression of mitochondrial proteins. Labeled cells expressing GFP (grown in light isotopic medium), OGT (grown in medium isotopic medium), or OGA (grown in heavy isotopic medium) were lysed, mitochondria were purified, and equal amounts of mitochondrial proteins were combined and separated via gel electrophoresis. In-gel digestion of stained proteins was performed, followed by a cleanup step using a protein trap and reverse phase HPLC separation. Separated proteins were then injected into a high mass accuracy ThermoFinnigan FT-LTQ mass spectrometer. Both sequence composition and quantitative information were collected in a single scan. Peptide and protein identifications below a false discovery rate of 1% are reported. PEAKS Software suite was used for identification and quantification analysis (Fig. 2A). We repeated this experiment two more times but switched SILAC labels for the cells expressing GFP, medium media, OGT, heavy media, or OGA, light media, for example. From each experimental set, we were able to identify numerous proteins from each in-gel digested bands (Fig. 2B). Reported in supplemental Table 1 are the identified proteins accession number, identified peptides, peptide sequence, isotopic quantitation, and statistics.
FIGURE 2.
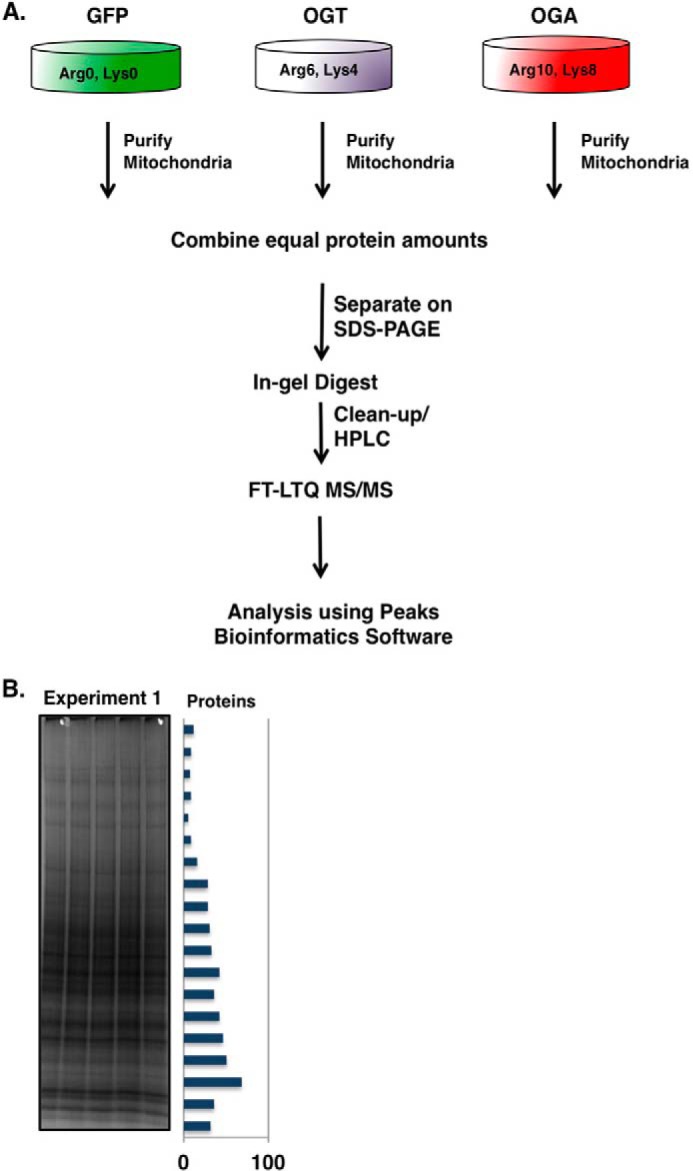
Purification of SILAC-labeled mitochondria from SY5Y cells. A, schematic of SILAC sample processing. Mitochondria from light, medium, and heavy labeled SY5Y cells were purified and combined in equal protein amounts. The samples were separated by gel electrophoresis and stained, and bands were excised. The excised bands were processed by in-gel trypsin digestion. Peptides were separated by HPLC and analyzed by a FT-LTQ mass spectrometer. SILAC quantification was performed using the PEAKS Software package. B, image of Coomassie Blue-stained gel after electrophoretic separation. The bar graph along the side represents the total number of proteins identified in each band.
In the first experiment, we determined a total of 507 protein identifications in the crude mitochondrial preparation, experiment 2 yielded 350 protein identifications, and experiment 3 yielded 768 protein identifications (Fig. 3A). 152 of the identified proteins were found in all experimental replicates (supplemental Table 1). We identified a total of 234, 146, and 242 mitochondrial proteins, respectively, from the three experimental replicates (Fig. 3B). We grouped the identified mitochondria proteins into classes according to function (Fig. 4). Of the 345 unique mitochondrial proteins identified, the most abundant class included those that mediate mitochondrial protein translation whereas proteins involved in cellular respiration were the next largest class of proteins identified.
FIGURE 3.
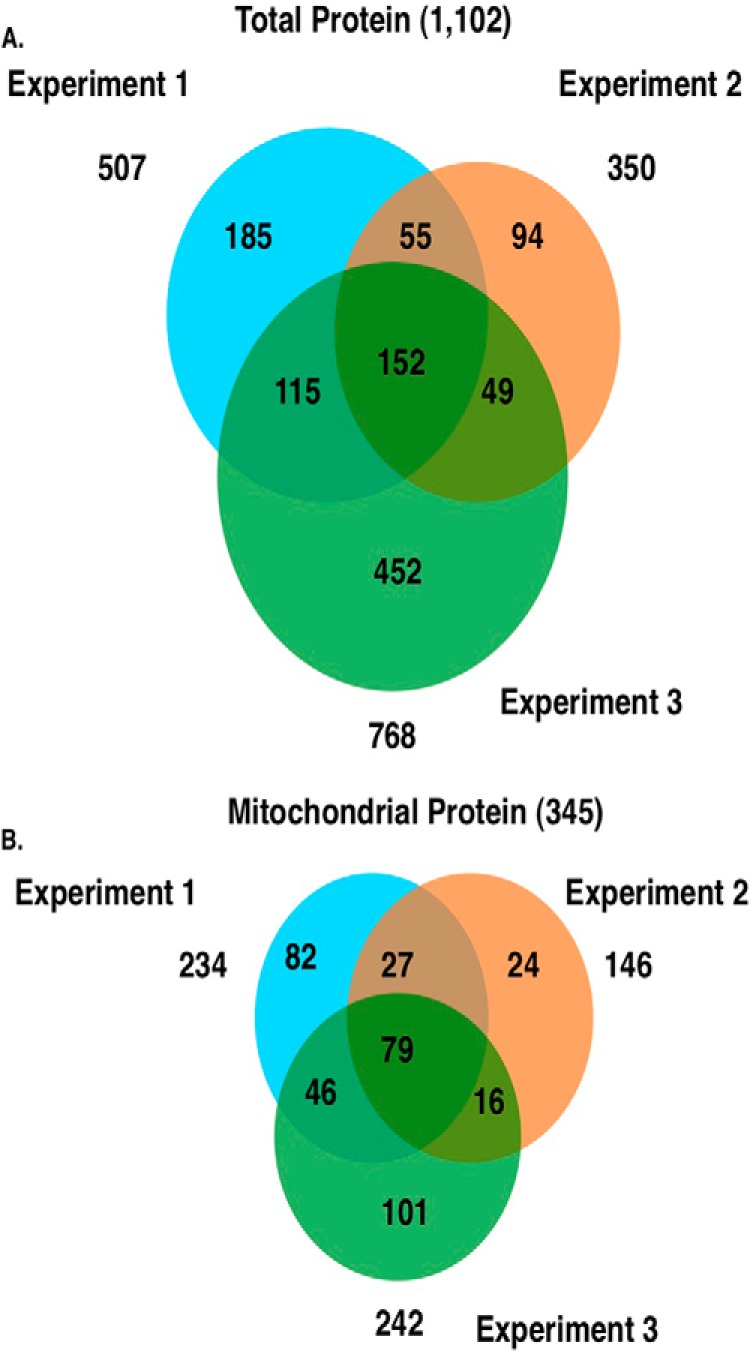
Proteomic identification of isolated proteins. A, Venn diagram representing the total number of identified proteins from three independent replicate experiments. B, Venn diagram showing the total number of mitochondrial proteins identified from three independent replicate experiments.
FIGURE 4.
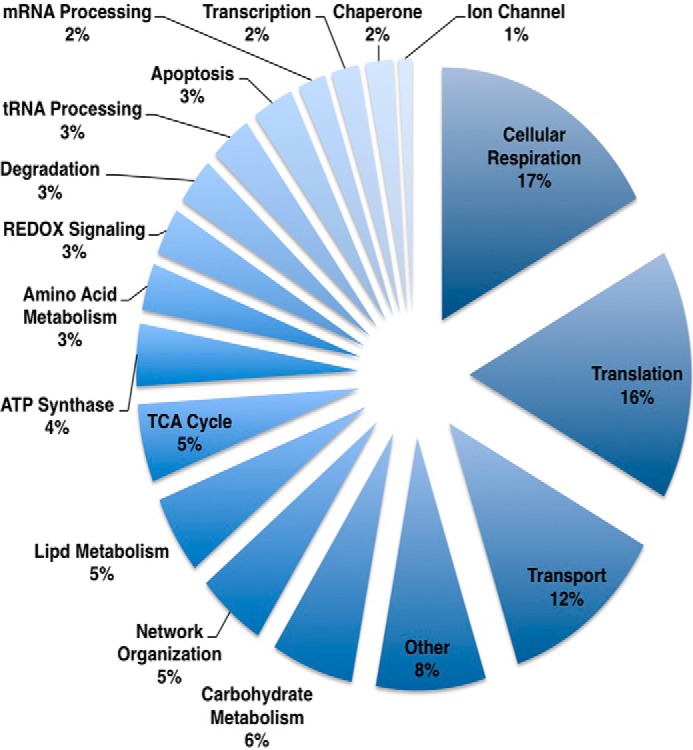
Functional class distribution of identified mitochondrial proteins. Identified proteins were distributed into biological functional class. Components of mitochondrial protein expression and cellular respiration were the two largest identified classes of proteins.
OGT/OGA Overexpression Impacts Electron Transport Chain and TCA Protein Expression
Next, we quantified the differences in protein expression of the OGT- or OGA-overexpressing cells compared with the GFP-expressing control cells. Including nonmitochondrial proteins, from the combined replicates we were able to quantify 1102 total proteins (supplemental Table 1). We considered proteins whose expression changed >1.5-fold to be noteworthy, with 571 proteins showing large expression changes in the total extract (Fig. 5A) whereas 107 proteins changed in the mitochondrial extract (Fig. 5B). In most cases the increase or decrease in protein expression of OGT or OGA expressing cells was similar (Fig. 5, A and B). The reminder of the study is focused on the mitochondria, but all relevant information on these nonmitochondrial proteins is found in the supplemental tables.
FIGURE 5.
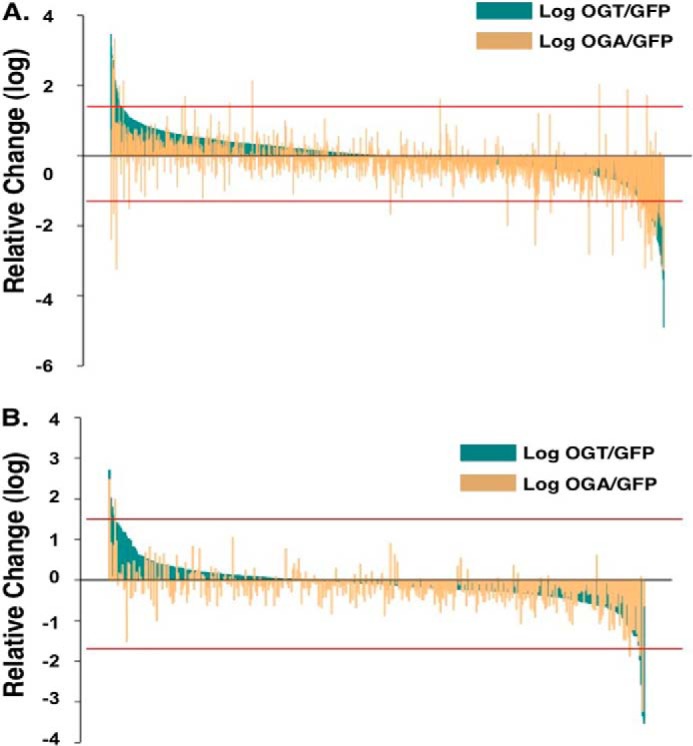
Quantification of SILAC-labeled mitochondrial proteins from OGT- and OGA-overexpressing SY5Y cells. A and B, the relative -fold change in total quantified proteins (A) or mitochondrial proteins (B) were plotted after OGT overexpression (dark green) or OGA overexpression (light orange). Red lines indicate 1.5-fold change cut-off.
OGA- and OGT-overexpressing cells demonstrated similar patterns of mitochondrial protein change. Almost all of the mitochondrial protein functional categories demonstrated a decrease in protein expression although some transport and apoptosis proteins were increased in the overexpressing cells (Fig. 6 and supplemental Table 3). Next, we performed orthogonal validation on several mitochondrial proteins whose expression changed in the proteomic study via Western blotting. Again, we enriched mitochondria from SY5Y cells, but we included the cytosolic fraction as well on the gels. By including the cytosolic fraction, we can determine whether protein transport into the mitochondria was altered and potentially a mechanism for changes in protein expression. We then blotted for a variety of proteins. We determined no change in COX IV (cytochrome c oxidase subunit 4) according to the proteomics; therefore, we used COX IV as a mitochondrial protein load control (Fig. 7). The complex 1 protein NDUFA9 (NADH dehydrogenase [ubiquinone] 1α subcomplex) was decreased in the OGA overexpression proteomics and validated via Western blotting. However, complex 1 protein NDUFA5 was increased in OGT-overexpressing cells but decreased in the OGA-overexpressing cells. Showing expression decreases in both OGT/OGA-overexpressing cells was the outer mitochondrial membrane protein Metaxin-1 (MTX1). The β-oxidation protein ACADM (medium chain-specific acyl-CoA dehydrogenase) was decreased in OGT-overexpressing cells and increased in the OGA-overexpressing cells, agreeing with the proteomics data (Fig. 7).
FIGURE 6.
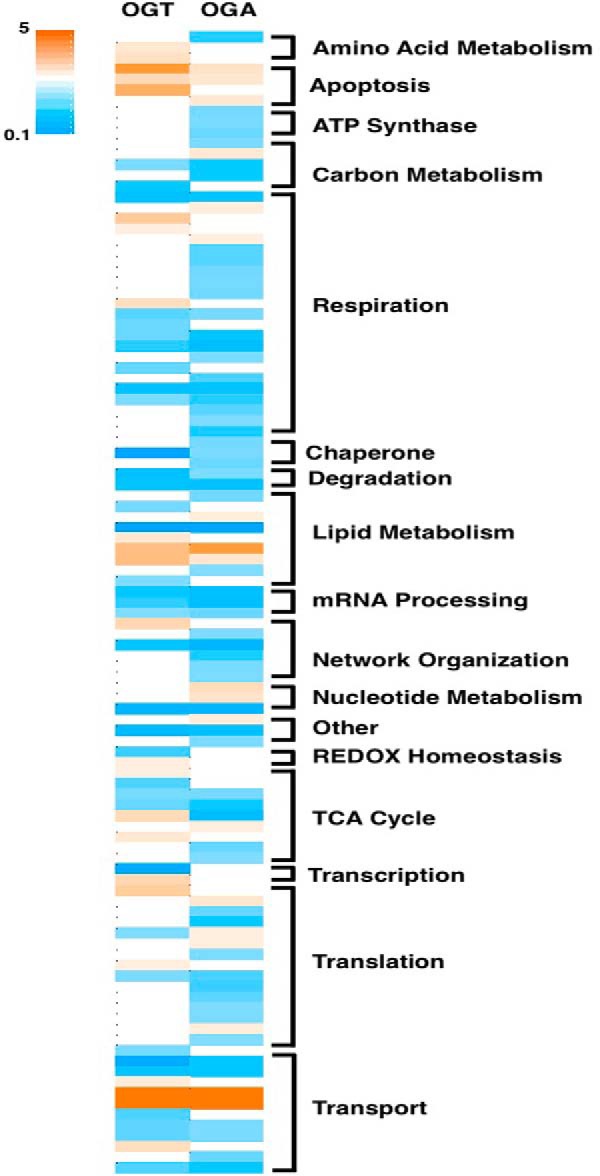
OGT/OGA overexpression alters mitochondrial protein expression. Heat map shows proteins demonstrating a >1.5-fold expression change in the OGT/OGA-overexpressing cells normalized to GFP control cells. Heat map scale ranges from increased protein expression (orange) to decreased protein expression (teal). Proteins were grouped according to their functional class.
FIGURE 7.
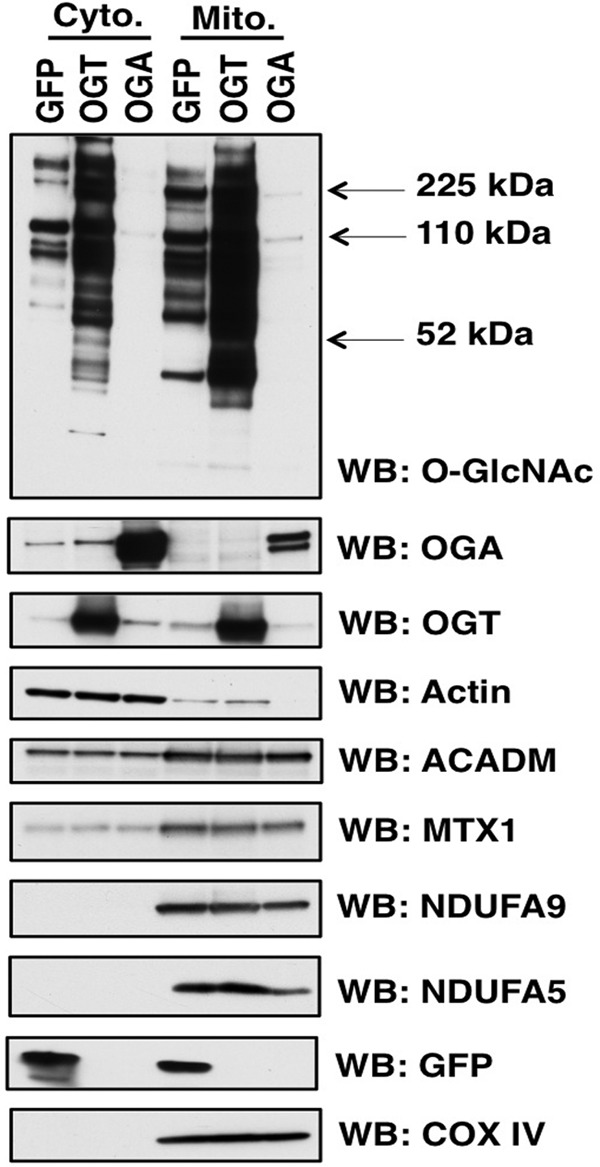
Orthogonal validation of mitochondrial protein expression. Mitochondria and cytosolic fractions were prepared from SY5Y cells. Samples were separated on SDS-PAGE and probed for specific proteins. COX IV is used as a mitochondria load control whereas actin was a cytoplasmic load control. ACADM, NDUFA9, NDUFA5, and MTX1 expression mirrored the expression changes in the proteomic studies. WB, Western blotting.
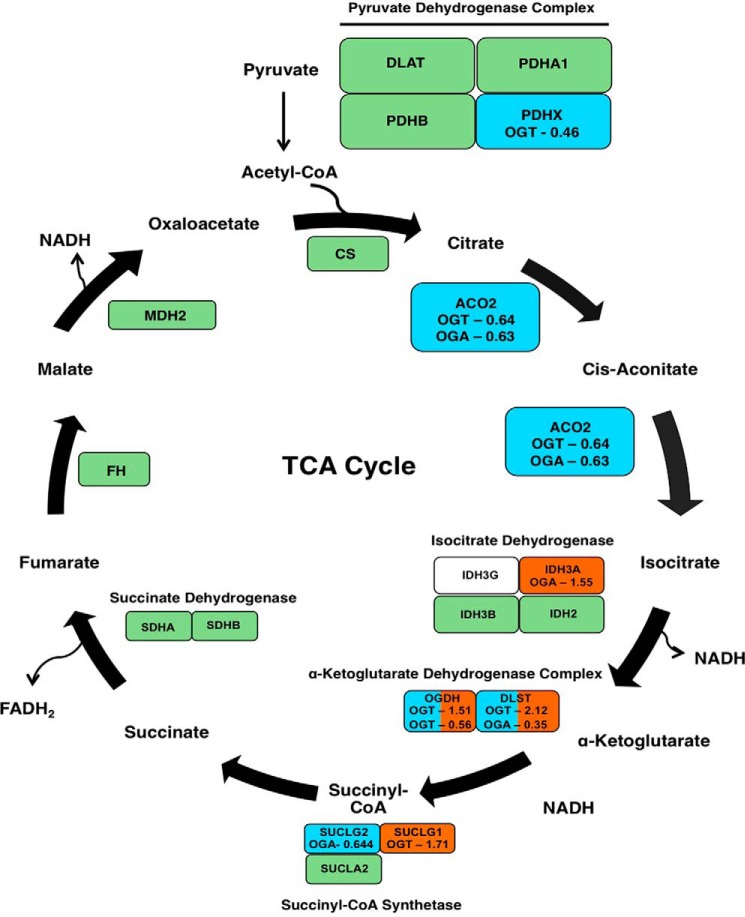
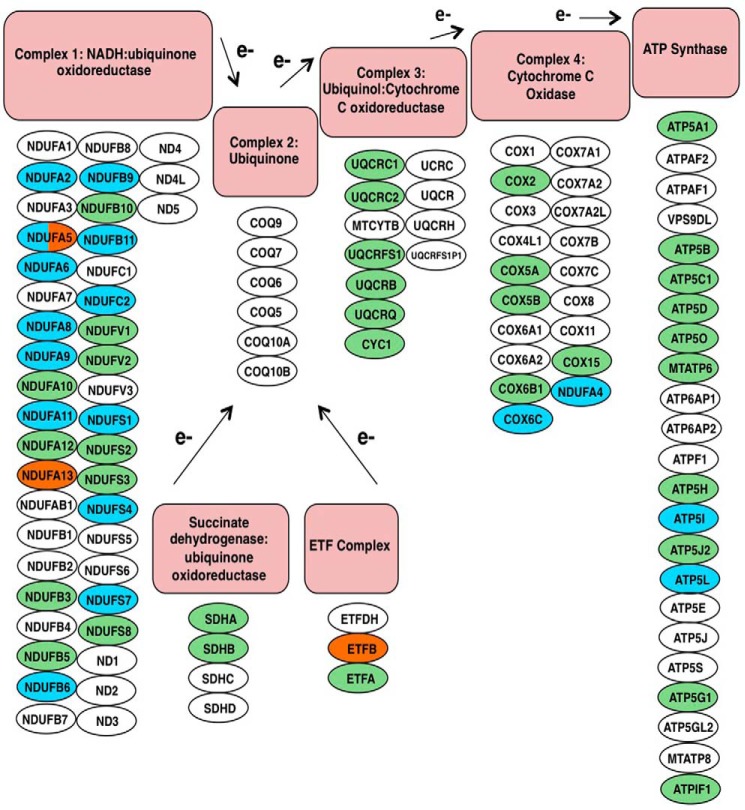
Both OGT- and OGA-overexpressing cells caused similar expression changes in mitochondrial metabolic pathways. For example, several TCA cycle proteins had altered expression. First, the protein PDHX (pyruvate dehydrogenase protein X component) of the pyruvate dehydrogenase complex, the entry point for acetyl-CoA into the TCA cycle, was deceased in OGT-overexpressing cells (Fig. 8). OGA-overexpressing cells reduced SUCLG2 (succinyl-CoA ligase GDP-forming β) of the succinyl-CoA synthetase complex expression while increasing IDH3A (isocitrate dehydrogenase [NAD] subunit α) expression of the isocitrate dehydrogenase complex. OGT-overexpressing cells increased the expression of both subunits of the α-ketoglutarate dehydrogenase complex, although one isoform of OGDH (2-oxoglutarate dehydrogenase) was decreased in the OGT-overexpressing cells. Both overexpressing cell types exhibited reduced aconitase (ACO2) expression. Not only did OGT/OGA overexpression affect the TCA cycle, but several respiratory chain subunits also had altered expression levels. Complex 1, 4, and ATP synthase subunits showed reduced expression (Fig. 9). Importantly, protein expression of other subunits of complex 1 and the Electron Transfer Flavoprotein complex were increased.
FIGURE 8.
TCA cycle protein expression is altered in OGT/OGA-overexpressing cells. Schematic of the TCA cycle shows enzymes of the cycle in blocks. Teal blocks list proteins whose expression decreased in OGT- or OGA-overexpressing cells. The -fold change induced by either OGT or OGA is listed in the box as well. Green blocks indicate no expression changes whereas proteins in white blocks were not identified.
FIGURE 9.
Components of the electron transport chain are altered in OGT- or OGA-overexpressing cells. In the schematic, electron transport chain proteins (circles) are categorized according to respiratory complex. Green circles indicate identified proteins whose expression does not change, teal circles are proteins whose expression decreases, and orange circles are proteins whose expression increases. White circles are proteins that were not identified in the screen.
Altered O-GlcNAc Cycling Disrupts Mitochondrial Morphology
Next, we used transmission electron microscopy to assess whether mitochondrial morphology was disrupted in the OGT/OGA-overexpressing cells. Mitochondria from these cells showed a lack of cristae or apparent errors in fission or fusion compared with GFP control mitochondria (Fig. 10A). After quantification, OGT/OGA-overexpressing cells contained 40–50% abnormal mitochondria compared with 10% in the GFP control cells (Fig. 10B).
FIGURE 10.
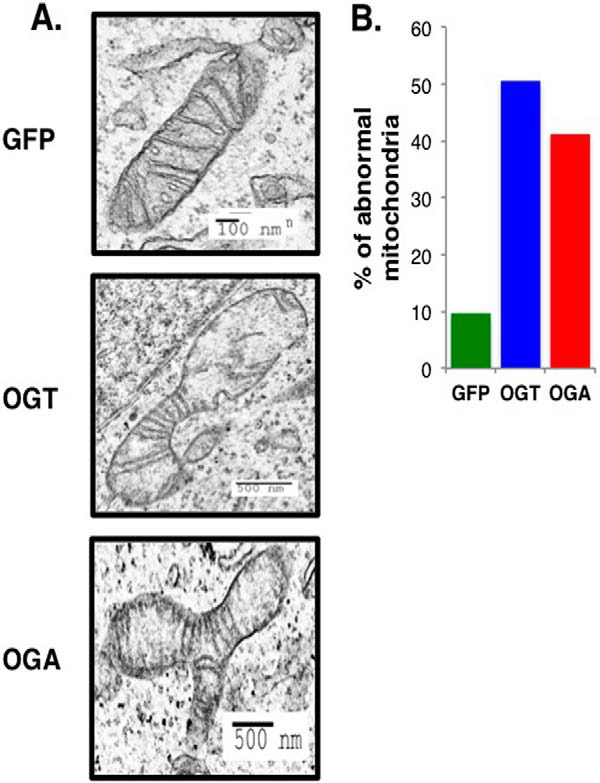
Mitochondrial morphology is disrupted in OGT/OGA-overexpressing cells. A, mitochondria morphology was observed after GFP, OGT, or OGA adenoviral infection by transmission electron microscopy. Scale bars are indicated on each image. B, mitochondria from the overexpressing cells with aberrant morphology and lack of cristae were quantified. The percentage of abnormal mitochondria was calculated and plotted. Counted mitochondria number (n): nGFP = 62, nOGT = 87, nOGA = 85.
OGT/OGA Overexpression Impairs Cellular Respiration and Glycolysis
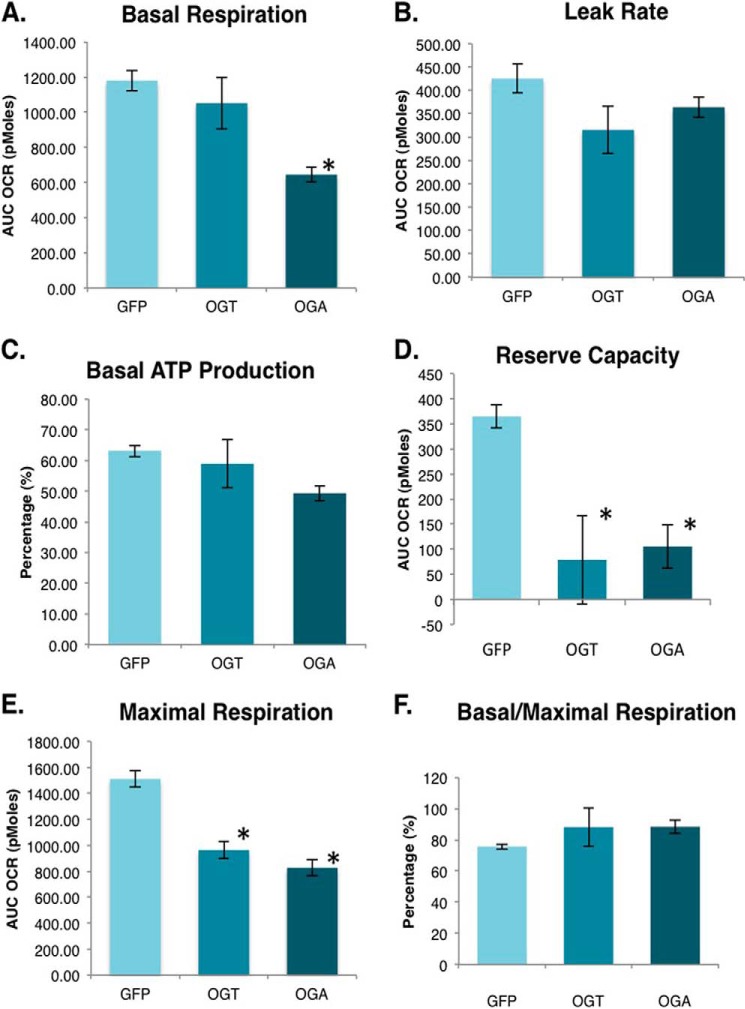
Because OGT and OGA overexpression altered respiratory chain protein expression and mitochondrial morphology, we measured cellular respiration using an XF24 analyzer. First, we determined the basal respiration rate in these cells. OGA-overexpressing cells had significantly decreased baseline oxygen consumption rates compared with GFP control cells (Fig. 11A). Following this measurement oligomycin, an ATP synthase inhibitor, was added. This compound allows for the measurement of the proton leak rate, which determines mitochondrial thermogenesis. Thermogenesis was modestly reduced in the OGT- and OGA-overexpressing cells (Fig. 11B). From this set of data, we calculated the percentage of total mitochondrial oxygen consumption used for ATP production. Under basal conditions, the percentage of mitochondrial oxygen consumption supporting ATP production was slightly lower in OGA-overexpressing cells (Fig. 11C). Next, we added FCCP to depolarize the membrane. From these data, we calculated the mitochondria reserve capacity. OGT/OGA-overexpressing cells had little reserve capacity compared with control cells (Fig. 11D). Accordingly, the absolute maximal respiration rate was significantly reduced in the OGT/OGA-overexpressing cells (Fig. 11E). Overall, these cells appeared to be bioenergetically stressed even under basal conditions, as the amount of oxygen they consumed under those conditions represented a higher percentage of their total oxygen consumption capacity (Fig. 11F).
FIGURE 11.
OGT/OGA-overexpressing cells have reduced cellular respiration. A, basal mitochondria respiration (oxygen consumption rate) is measured in SY5Y overexpression cells using an XF24 analyzer. B, ATP synthase inhibitor oligomycin is added to the cells to block ATP production allowing for the measurement of the proton leak rate. C, the percentage of oxygen consumed to generate ATP under basal respiration conditions was calculated from the proton leak and basal respiration measurements. D, FCCP, which depolarizes the mitochondrial outer membrane, was added to cells to measure the maximal increase in oxygen consumption. Reserve capacity was calculated by subtracting maximal oxygen consumption from basal consumption. E, antimycin and rotenone, which inhibits the electron transport chain, was added to measure the nonmitochondrial oxygen consumption. Maximal respiration was calculated by subtracting nonmitochondrial respiration from the highest rate of oxygen consumption. F, the respiration capacity being utilized at the basal level was calculated by using the ratio of basal respiration over the maximal respiration. Mean ± S.E. (error bars), replicate number (n): 7; *, p < 0.05 GFP versus OGT/OGA.
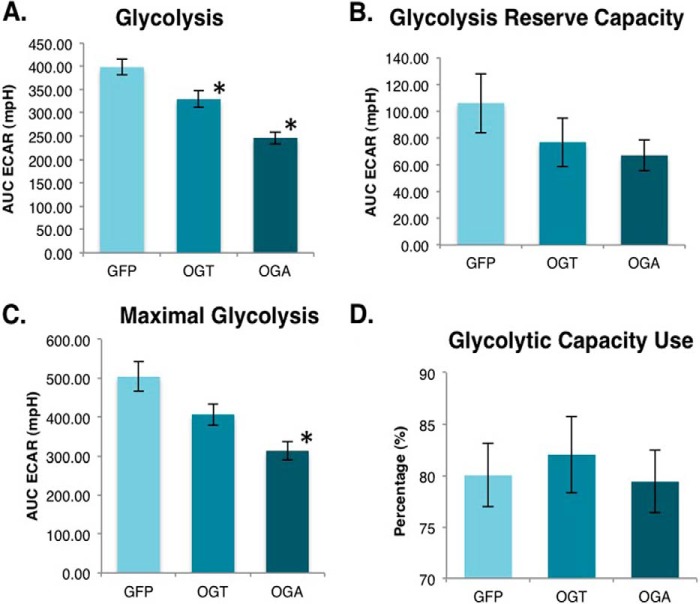
Finally, we measured cell glycolysis flux to ascertain whether the overexpressing cells were shifting toward a more anaerobic pattern of energy production. Cells were placed into the XF24 analyzer and starved of glucose for 1 h. After starvation, glucose was added back to cells, and the extracellular acidification rate was measured. Both OGT and OGA-overexpressing cells had significantly lower basal glycolysis rates (Fig. 12A). After the addition of oligomycin, we measured the glycolysis rate that resulted when mitochondrial ATP production was inhibited and used this parameter to calculate the glycolysis reserve capacity. These cells had a lower glycolysis capacity than control cells (Fig. 12B), and OGA-overexpressing cells did show a significant reduction in maximal capacity compared with control cells (Fig. 12C). Finally, we calculated the percentage of glycolysis capacity being used by these cells under unstressed conditions. No significant difference was found between the control and overexpressing cells (Fig. 12D). Therefore, with overexpression of either OGT or OGA the basal and maximal glycolysis rates were proportionally reduced.
FIGURE 12.
Glycolysis is lower in OGT/OGA-overexpressing cells. A, ECAR was measured after the addition of glucose to starved SY5Y overexpression cells allowing for the glycolysis calculation. B, ATP synthase inhibitor oligomycin was added to block ATP production causing an increase in extracellular acidification rate. Glycolytic reserve capacity was calculated by subtracting the maximal ECAR from the basal ECAR. C, the addition of 2-deoxyglucose blocks glycolysis allowing for the measurement of the nonglycolytic ECAR. Maximal glycolytic rate was calculated by subtracting nonglycolytic ECAR from maximal ECAR. D, glycolytic capacity use under basal condition was calculated by using the ratio of basal glycolysis over the maximal glycolysis. Mean ± S.E. (error bars), replicate number (n): 7; *, p < 0.05 GFP versus OGT/OGA.
DISCUSSION
Increasing evidence points to a critical role for OGT and OGA in regulating mitochondrial function. We decided to explore how increased OGT or OGA cellular expression affects mitochondrial protein expression and function. By employing a proteomics-based approach to explore how O-GlcNAc cycling affects mitochondria function, we demonstrate that OGT or OGA overexpression resulted in altered mitochondrial protein expression. Proteins showing the greatest expression changes were protein transport, translation, and respiration chain proteins. The alteration in mitochondrial protein expression had a deleterious effect on the morphology of the mitochondria; furthermore, the respiration capacity was dramatically impaired after OGT/OGA overexpression. Together these data suggest a complicated and important role for O-GlcNAc cycling in the homeostasis of mitochondrial protein expression and function.
As expected, mitochondrial proteins identified in the SILAC experiment comprised primarily proteins critical for mitochondrial function such as respiration, translation, and transport. Because we overexpressed either the nuclear/cytoplasmic forms OGT or OGA, the protein expression changes are likely due to a variety of cellular defects. Altered O-GlcNAc cycling affects both transcription and translation. Both OGT and OGA are important in modulating gene transcription (23). For example, RNA polymerase II is modified by O-GlcNAc (24), and O-GlcNAcylation of RNA polymerase II promotes the formation of the transcriptional preinitiation complex (25); however, for transcriptional elongation to proceed OGA needs to remove the O-GlcNAc to facilitate the phosphorylation of the RNA polymerase II C-terminal tail and elongation (25). O-GlcNAcylation is also important for proper protein translation with alterations to cellular O-GlcNAc levels impinging on the function of the translational machinery (26).
Potentially, transcriptional or translational changes in mitochondrial transport proteins such as the Translocase of the Mitochondrial Outer Membrane (TOMM) family can then have a secondary effect on mitochondrial protein expression. In fact, we measured declines in TOMM20 as well as TIMM17B (Translocase of Mitochondrial Inner Membrane). We can envision impairment of mitochondrial protein transport into the mitochondrial causing an increase in the cytoplasm of mitochondrial proteins and a decrease within the mitochondria. Although the proteins examined in the orthogonal validation were altered in the mitochondrial, cytoplasmic expression appeared to mirror the mitochondrial expression suggesting that the proteins we validated did not appear to have problems entering the mitochondria (Fig. 7). Besides potential expression changes being caused by alterations in transcription, translation, or protein transport into the mitochondria, OGT/OGA overexpression could lead to alternative processing of mRNA transcripts leading to expression changes in isoforms or splice variants of a given protein. We see this potentially occurring with proteins such as the TCA cycle proteins OGDH and ACADM, which is involved in fatty acid β-oxidation.
The expression of numerous respiratory chain proteins is also regulated by O-GlcNAc cycling (Fig. 9). We identified 24 NADH dehydrogenase ubiquinone 1 (NDUF) members from complex 1 of the electron transport chain. The expression of several of these family members was altered in the OGT/OGA-overexpressing cells. For example, NDUFA9 protein expression was decreased in OGA-overexpressing cells; interestingly, NDUFA9 is O-GlcNAcylated at Ser-156 (11). O-GlcNAcylation of NDUFA9 was increased in cardiac myocytes exposed to high glucose conditions, which correlated with impaired mitochondrial function. Mitochondrial function and a decrease in NDUFA9 O-GlcNAcylation were partially restored under these high glucose conditions after adenoviral-mediated expression of OGA (11). Similar to our study, OGA overexpression also lowered NDUFA9 expression in these cells (11), suggesting that OGA expression influences NDUFA9 expression. These data also suggest an important role for maintaining homeostatic levels of O-GlcNAc in the regulation of complex 1 proteins. Complex 1 deficiency is the most common electron transport chain defect (27). Mutations in complex 1 proteins or gain/loss of expression alter complex 1 assembly and impair the electron transport chain leading to numerous physiological consequences (27). Disease or age-related changes to the O-GlcNAc cycling rate, therefore, could profoundly affect complex 1 subunit expression and holoenzyme function.
Morphologic disruption of the mitochondria (Fig. 10), manifesting here as perturbed cristae formation, would associate with abnormal respiration chain formation. Not surprisingly, the measured declines in respiratory chain protein expression and disrupted mitochondrial morphology lead to a reduced basal oxygen consumption in the overexpression cells (Fig. 11). Further, overexpression of OGA pushed basal mitochondrial respiration toward its maximum capacity, which was itself reduced. Interestingly, OGT- and OGA-overexpressing cells did not attempt to compensate for this apparent respiration stress by increasing glycolysis, as overall glycolysis flux in these cells is decreased (Fig. 12). Therefore, the net effect of altered O-GlcNAc cycling is a reduction in both the oxidative metabolism infrastructure and glycolysis, a combination expected to place cells in a state of relative bioenergetic jeopardy.
In conclusion, we have demonstrated that altered O-GlcNAc cycling rates impact mitochondrial protein expression, morphology, and respiration. We show that overexpression of the O-GlcNAc cycling enzymes OGT or OGA cause, respectively, an increase or decrease in O-GlcNAc levels. Importantly, OGT/OGA overexpression will increase the rate of addition and removal of the O-GlcNAc modification, and disruption of the basal rate of O-GlcNAc cycling impairs cellular function (28). These data argue that mitochondrial function is directly related to the rate of O-GlcNAc cycling, and alteration of basal O-GlcNAc cycling rates either by disease or aging would have a profound effect on mitochondrial function. Moving forward, subsequent investigation into how altered O-GlcNAcylation affects mitochondrial protein expression and function in metabolic diseases such as diabetes, Alzheimer disease, or cancer should be a high priority.
Supplementary Material
Acknowledgments
We thank the Electron Microscopy Research Laboratory (EMRL) for assistance with the electron microscopy. The EMRL is supported in part by National Institutes of Health COBRE Grant 9P20GM104936. The JEOL JEM-1400 TEM used in the study was purchased with funds from National Institutes of Health Grant S10RR027564.
This work was supported, in whole or in part, by an institutional development award under National Institutes of Health/NIMS Grant P20GM12345, the University of Kansas Alzheimer's Disease Center under National Institutes of Health/NIA Grant P30AG035982 (to R. H. S.), and National Institutes of Health/NIA Pilot Awards P30AG035982 and DK100595 (to C. S.).

This article contains supplemental Tables 1–3.
- OGT
- O-GlcNAc transferase
- ECAR
- extracellular acidification rate
- FCCP
- carbonyl cyanide p-trifluoromethoxyphenylhydrazone
- OGA
- O-GlcNAcase
- SILAC
- stable isotope labeling of amino acids on cell culture
- TCA
- tricarboxylic acid.
REFERENCES
- 1. Slawson C., Copeland R. J., Hart G. W. (2010) O-GlcNAc signaling: a metabolic link between diabetes and cancer? Trends Biochem. Sci. 35, 547–555 [DOI] [PMC free article] [PubMed] [Google Scholar]
- 2. Slawson C., Hart G. W. (2011) O-GlcNAc signalling: implications for cancer cell biology. Nat. Rev. Cancer 11, 678–684 [DOI] [PMC free article] [PubMed] [Google Scholar]
- 3. Bond M. R., Hanover J. A. (2013) O-GlcNAc cycling: a link between metabolism and chronic disease. Annu. Rev. Nutr. 33, 205–229 [DOI] [PMC free article] [PubMed] [Google Scholar]
- 4. Ball L. E., Berkaw M. N., Buse M. G. (2006) Identification of the major site of O-linked β-N-acetylglucosamine modification in the C terminus of insulin receptor substrate-1. Mol. Cell. Proteomics 5, 313–323 [DOI] [PMC free article] [PubMed] [Google Scholar]
- 5. Yang X., Ongusaha P. P., Miles P. D., Havstad J. C., Zhang F., So W. V., Kudlow J. E., Michell R. H., Olefsky J. M., Field S. J., Evans R. M. (2008) Phosphoinositide signalling links O-GlcNAc transferase to insulin resistance. Nature 451, 964–969 [DOI] [PubMed] [Google Scholar]
- 6. Whelan S. A., Lane M. D., Hart G. W. (2008) Regulation of the O-linked β-N-acetylglucosamine transferase by insulin signaling. J. Biol. Chem. 283, 21411–21417 [DOI] [PMC free article] [PubMed] [Google Scholar]
- 7. Whelan S. A., Dias W. B., Thiruneelakantapillai L., Lane M. D., Hart G. W. (2010) Regulation of insulin receptor substrate 1 (IRS-1)/AKT kinase-mediated insulin signaling by O-linked β-N-acetylglucosamine in 3T3-L1 adipocytes. J. Biol. Chem. 285, 5204–5211 [DOI] [PMC free article] [PubMed] [Google Scholar]
- 8. Parker G., Taylor R., Jones D., McClain D. (2004) Hyperglycemia and inhibition of glycogen synthase in streptozotocin-treated mice: role of O-linked N-acetylglucosamine. J. Biol. Chem. 279, 20636–20642 [DOI] [PubMed] [Google Scholar]
- 9. Dentin R., Hedrick S., Xie J., Yates J., 3rd, Montminy M. (2008) Hepatic glucose sensing via the CREB coactivator CRTC2. Science 319, 1402–1405 [DOI] [PubMed] [Google Scholar]
- 10. Housley M. P., Rodgers J. T., Udeshi N. D., Kelly T. J., Shabanowitz J., Hunt D. F., Puigserver P., Hart G. W. (2008) O-GlcNAc regulates FoxO activation in response to glucose. J. Biol. Chem. 283, 16283–16292 [DOI] [PMC free article] [PubMed] [Google Scholar]
- 11. Hu Y., Suarez J., Fricovsky E., Wang H., Scott B. T., Trauger S. A., Han W., Hu Y., Oyeleye M. O., Dillmann W. H. (2009) Increased enzymatic O-GlcNAcylation of mitochondrial proteins impairs mitochondrial function in cardiac myocytes exposed to high glucose. J. Biol. Chem. 284, 547–555 [DOI] [PMC free article] [PubMed] [Google Scholar]
- 12. Burnham-Marusich A. R., Berninsone P. M. (2012) Multiple proteins with essential mitochondrial functions have glycosylated isoforms. Mitochondrion 12, 423–427 [DOI] [PMC free article] [PubMed] [Google Scholar]
- 13. Suarez J., Hu Y., Makino A., Fricovsky E., Wang H., Dillmann W. H. (2008) Alterations in mitochondrial function and cytosolic calcium induced by hyperglycemia are restored by mitochondrial transcription factor A in cardiomyocytes. Am. J. Physiol. Cell Physiol. 295, C1561–1568 [DOI] [PMC free article] [PubMed] [Google Scholar]
- 14. Love D. C., Kochan J., Cathey R. L., Shin S. H., Hanover J. A. (2003) Mitochondrial and nucleocytoplasmic targeting of O-linked GlcNAc transferase. J. Cell Sci. 116, 647–654 [DOI] [PubMed] [Google Scholar]
- 15. Shin S. H., Love D. C., Hanover J. A. (2011) Elevated O-GlcNAc-dependent signaling through inducible mOGT expression selectively triggers apoptosis. Amino Acids 40, 885–893 [DOI] [PMC free article] [PubMed] [Google Scholar]
- 16. Bennett C. E., Johnsen V. L., Shearer J., Belke D. D. (2013) Exercise training mitigates aberrant cardiac protein O-GlcNAcylation in streptozotocin-induced diabetic mice. Life Sci 92, 657–663 [DOI] [PubMed] [Google Scholar]
- 17. Medford H. M., Chatham J. C., Marsh S. A. (2012) Chronic ingestion of a Western diet increases O-linked-β-N-acetylglucosamine (O-GlcNAc) protein modification in the rat heart. Life Sci 90, 883–888 [DOI] [PMC free article] [PubMed] [Google Scholar]
- 18. Ngoh G. A., Facundo H. T., Hamid T., Dillmann W., Zachara N. E., Jones S. P. (2009) Unique hexosaminidase reduces metabolic survival signal and sensitizes cardiac myocytes to hypoxia/reoxygenation injury. Circ. Res. 104, 41–49 [DOI] [PMC free article] [PubMed] [Google Scholar]
- 19. Johnsen V. L., Belke D. D., Hughey C. C., Hittel D. S., Hepple R. T., Koch L. G., Britton S. L., Shearer J. (2013) Enhanced cardiac protein glycosylation (O-GlcNAc) of selected mitochondrial proteins in rats artificially selected for low running capacity. Physiol. Genomics 45, 17–25 [DOI] [PMC free article] [PubMed] [Google Scholar]
- 20. Gottlieb R. A., Adachi S. (2000) Nitrogen cavitation for cell disruption to obtain mitochondria from cultured cells. Methods Enzymol. 322, 213–221 [DOI] [PubMed] [Google Scholar]
- 21. Slawson C., Zachara N. E., Vosseller K., Cheung W. D., Lane M. D., Hart G. W. (2005) Perturbations in O-linked β-N-acetylglucosamine protein modification cause severe defects in mitotic progression and cytokinesis. J. Biol. Chem. 280, 32944–32956 [DOI] [PubMed] [Google Scholar]
- 22. Swerdlow R. H. (2007) Mitochondria in cybrids containing mtDNA from persons with mitochondriopathies. J. Neurosci. Res. 85, 3416–3428 [DOI] [PubMed] [Google Scholar]
- 23. Lewis B. A. (2013) O-GlcNAcylation at promoters, nutrient sensors, and transcriptional regulation. Biochim. Biophys. Acta 1829, 1202–1206 [DOI] [PMC free article] [PubMed] [Google Scholar]
- 24. Kelly W. G., Dahmus M. E., Hart G. W. (1993) RNA polymerase II is a glycoprotein: modification of the COOH-terminal domain by O-GlcNAc. J. Biol. Chem. 268, 10416–10424 [PubMed] [Google Scholar]
- 25. Ranuncolo S. M., Ghosh S., Hanover J. A., Hart G. W., Lewis B. A. (2012) Evidence of the involvement of O-GlcNAc-modified human RNA polymerase II CTD in transcription in vitro and in vivo. J. Biol. Chem. 287, 23549–23561 [DOI] [PMC free article] [PubMed] [Google Scholar]
- 26. Zeidan Q., Wang Z., De Maio A., Hart G. W. (2010) O-GlcNAc cycling enzymes associate with the translational machinery and modify core ribosomal proteins. Mol. Biol. Cell 21, 1922–1936 [DOI] [PMC free article] [PubMed] [Google Scholar]
- 27. Lazarou M., Thorburn D. R., Ryan M. T., McKenzie M. (2009) Assembly of mitochondrial complex I and defects in disease. Biochim. Biophys. Acta 1793, 78–88 [DOI] [PubMed] [Google Scholar]
- 28. Tan E. P., Caro S., Potnis A., Lanza C., Slawson C. (2013) O-Linked N-acetylglucosamine cycling regulates mitotic spindle organization. J. Biol. Chem. 288, 27085–27099 [DOI] [PMC free article] [PubMed] [Google Scholar]
Associated Data
This section collects any data citations, data availability statements, or supplementary materials included in this article.


