

Background: Nmnat3 is considered a mitochondria-localized NAD synthesis enzyme. However, its physiological function in vivo remains unclear.
Results: Loss of Nmnat3 results in drastic depletion of the NAD pool and stalls the glycolytic flow in mature erythrocytes.
Conclusion: Nmnat3 deficiency causes splenomegaly and hemolytic anemia in mice.
Significance: This report reveals the essential role of Nmnat3 in mature erythrocytes.
Keywords: Erythrocyte, Glycolysis, Metabolomics, NAD Biosynthesis, Nicotinamide Adenine Dinucleotide (NAD)
Abstract
NAD biosynthesis is of substantial interest because of its important roles in regulating various biological processes. Nicotinamide mononucleotide adenylyltransferase 3 (Nmnat3) is considered a mitochondria-localized NAD synthesis enzyme involved in de novo and salvage pathways. Although the biochemical properties of Nmnat3 are well documented, its physiological function in vivo remains unclear. In this study, we demonstrated that Nmnat3 was localized in the cytoplasm of mature erythrocytes and critically regulated their NAD pool. Deficiency of Nmnat3 in mice caused splenomegaly and hemolytic anemia, which was associated with the findings that Nmnat3-deficient erythrocytes had markedly lower ATP levels and shortened lifespans. However, the NAD level in other tissues were not apparently affected by the deficiency of Nmnat3. LC-MS/MS-based metabolomics revealed that the glycolysis pathway in Nmnat3-deficient erythrocytes was blocked at a glyceraldehyde 3-phosphate dehydrogenase (GAPDH) step because of the shortage of the coenzyme NAD. Stable isotope tracer analysis further demonstrated that deficiency of Nmnat3 resulted in glycolysis stall and a shift to the pentose phosphate pathway. Our findings indicate the critical roles of Nmnat3 in maintenance of the NAD pool in mature erythrocytes and the physiological impacts at its absence in mice.
Introduction
Nicotinamide adenine dinucleotide (NAD) is an important coenzyme involved in numerous metabolic enzymatic reactions including glycolysis, β-oxidation, and the tricarboxylic acid (TCA) cycle (1). NAD also serves as a substrate for poly(ADP-ribose) polymerases (PARPs)2 and the class III NAD-dependent deacetylases (sirtuins), and plays key roles in diverse biological processes in response to cellular stresses, including genotoxic and nutrient stress (2). The NAD level in the cell is vital for facilitating sirtuin functions as energy sensors: upon fasting or calorie restriction (3). In particular, sirtuins deacetylate central metabolic enzymes and directly control their enzymatic activities (4, 5). In addition, nuclear sirtuins can indirectly regulate central metabolic pathways by deacetylating diverse transcriptional factors and cofactors including FOXO, PPAR, and PGC1α (6–8). Recent studies indicate that NAD metabolism also regulates various biological processes via NAD-dependent deacetylase SIRT1 (9–11). However, there is no direct evidence that NAD metabolism can regulate metabolic enzymes that requires NAD as a coenzyme.
In organisms, NAD can be synthesized via a de novo synthesis pathway or a salvage pathway (12). In the salvage pathway, nicotinamide phosphoribosyltransferase (Nampt) converts nicotinamide (NAM) and phosphoribosyl pyrophosphate (PRPP) to nicotinamide mononucleotide (NMN). Then, nicotinamide mononucleotide adenylyltransferase (Nmnat) transfers the adenylyl moiety from ATP to NMN for generating NAD (12). In mammals, there are three Nmnat isoforms (Nmnat1–3) with different subcellular localizations and tissue distributions (13, 14). Nmnat1, Nmnat2, and Nmnat3 are considered to be localized in the nucleus, Golgi apparatus, and mitochondria, respectively. Nmnat1 has the most robust enzymatic activity of the three isoforms (13). A recent genetic study revealed that Nmnat1 gene mutations cause Leber congenital amaurosis, a rare hereditary blindness (15–18). Nmnat1 is also identified as a fusion gene with Ube4b in Wallerian degeneration slow (WldS) mice, which exhibit drastic delays in injured axonal clearance (19). Indeed, Nmnat1 overexpression in mice is protective against sciatic nerve injury (20). Although Nmnat1 has important roles in central and peripheral nervous system, its protein expression level is relatively low compared with that of Nmnat2 (21). Several articles have suggested the implication of Nmnat2 in axonal cell survival and protection (22, 23). Nmnat1 and Nmnat2 also have essential roles in axonal growth and survival during embryogenesis as their deficiency in mice results in embryonic lethal (21, 24, 25).
Nmnat3 has been considered to be localized in mitochondria and to have a pivotal role in regulation of the mitochondrial NAD level (13, 26). Despite the importance of the NAD metabolism in mitochondria, the role of Nmnat3 in vivo is still unclear. Nmnat3 overexpression confers robust protection against axon injury in vitro and in vivo as well as WldS chimeric protein (27, 28). Although the significance of Nmnat3 in axonal protection is evident, the molecular mechanism is still unknown, as for the case of Nmnat1.
It has long been suspected that red blood cells (RBCs) possess NAD synthesis activity (29, 30). Several reports have indicated that RBCs show Nmnat-like activity (31–34), but the actual identity of responsible enzymes has been uncertain. Magni and co-workers (35), employing a Nmnat discrimination assay and found Nmnat3-specific activity in human RBCs. However, given that RBCs have no mitochondria in cells, it has not been clarified whether Nmnat3 has a physiological function in RBCs. In this study, we found that Nmnat3-deficient mice exhibited splenomegaly and hemolytic anemia resulting from a glycolysis pathway blockade at glyceraldehyde-3-phosphate dehydrogenase (GAPDH). Our findings revealed unexpected roles of Nmnat3 in the maintenance of the NAD pool in mature erythrocytes and their lifespan regulation.
EXPERIMENTAL PROCEDURES
Generation of Nmnat3 Gene-trap Mice
Nmnat3 gene-trapped heterozygous frozen embryo was obtained from the TG Resource Bank (Transgenic Inc. Japan) and embryonic transfer was performed to obtain gene-trapped heterozygous mice. To determine the precise inserted location of gene-trap cassette in the Nmnat3 gene, genomic walking was carried out using the GenomeWalker Universal Kit (Takara, Japan). After confirming the accurate insertion point of the gene-trap cassette, we designed primer sets for genotyping as shown in Table 1. Nmnat3 gene-trap homozygous (Nmnat3gt/gt) mice were obtained by crossing heterozygous mice. Mice were maintained under controlled temperature and standard light conditions (12:12 h light-dark cycle) and were allowed free access to water and food. All animal experiments were approved by the Animal Experiment Committee at University of Toyama and carried out in accordance with the Guidelines for the Care and Use of Laboratory Animals at University of Toyama, which were based on international policies.
TABLE 1.
Primers for Nmnat3gt/gt mice genotyping and mouse Nmnat3 qPCR
Locations of the primers used in geneotyping for Nmnat3gt/gt mice are indicated in Fig. 2A. Locations of the primers used for qPCR of Nmnat3 mRNA are indicated in Fig. 2B.
| Sequence | |
|---|---|
| Genotyping primers for Nmnat3gt/gt mice | |
| Primer #1 | TCTTCTGGGGTCGCAGTTAT |
| Primer #2 | CCTTCTTTCTGGTCTTTCTCTGTGCAA |
| Primer #3 | TGCCACCTGACGTCTAAGAA |
| Primer #4 | GACAGTGCAGCGATGTCCTA |
| qPCR primers for mouse Nmnat3 | |
| Nmnat3-Ex1 | Fwd: GTGTCCACGAAGCCTTGAGT |
| Rev: CAGCCATCTGACTCTGTCGT | |
| Nmnat3-Ex2–3 | Fwd: CACCAAACAGGAAGGTACCA |
| Rev: AAGCCACCAGGTCTTTCTTC | |
| Nmnat3-Ex5 | Fwd: CAGGGTTCCCAATATCCTGA |
| Rev: TCAAACAAGCAGGCAGTCAT | |
| B2m (β2-microglobulin) | Fwd: TTCTGGTGCCTTGTCTCACTGA |
| Rev: CAGTATGTTCGGCTTCCCATTC | |
| Rpl13a (ribosomal protein L13a) | Fwd: AGCGCCTCAAGGTGTTGGA |
| Rev: GAGTGGCTGTCACTGCCTGGTA | |
Real-time Quantitative PCR (qPCR)
Total RNAs were extracted from mice tissues using TRI Reagent (Molecular Research Center, Inc.). cDNA was prepared using ReverTraAce qPCR RT Master Mix with gDNA Remover (Toyobo, Japan) according to the supplier's protocol. Real-time PCR was carried out using a THUNDERBIRD SYBR qPCR Mix (Toyobo) on Thermal Cycler Dice Real Time System II (Takara). Quantification was done by the ΔΔCt method, and Rpl13a or B2m genes were used as a reference genes. Primers used in qPCR are listed in Table 1.
Preparation of Mature Erythrocytes
Mature erythrocytes were separated by a Percoll gradient method according to a standard protocol (36). Briefly, Percoll solution of densities at 1.096 and 1.058 g/ml were prepared. 2 ml of Percoll solution (density, 1.096 g/ml) was added at the bottom, followed by 1 ml of Percoll (density, 1.058 g/ml) layered on top. Finally, 1 ml of whole blood was applied onto the gradient, followed by centrifugation at 250 × g for 30 min. Mature erythrocytes packed in the bottom layer were carefully collected and washed with ice-cold saline.
Western Blotting Experiments
Mature erythrocytes isolated by a Percoll gradient were lysed with Nonidet P-40 lysis buffer (150 mm NaCl, 1.0% Nonidet P-40, and 50 mm Tris-HCl, pH 7.4) and subjected to Western blotting. For fractionation experiments, hemolysed samples were used as a cytoplasm fraction, and the ghost was used as the membrane fraction. Whole blood was centrifuged at 1,000 × g for 5 min at room temperature, and then plasma and buffy coat were discarded. Erythrocytes were lysed with 5 mm sodium phosphate buffer (pH 8.0) on ice for 30 min and centrifuged at 20,000 × g for 20 min at 4 °C. The supernatant was used as the hemolysed sample. The pellet was washed with 5 mm sodium phosphate buffer (pH 8.0) twice and used as a ghost fraction. Antibodies used for Western blotting experiments included Nmnat1 (Novus), Nmnat2 (Sigma), GAPDH (Sigma), phosphofructokinase (Abcam), β-actin (Cell Signaling), Nampt (Bethyl), NADK (Santa Cruz), β-tubulin (Cell Signaling), Tom20 (Santa Cruz), and acetyl-lysine (Abcam and Cell Signaling). Anti-mouse Nmnat3 rat monoclonal antibody (clone R88) was raised against His-tagged full-length mouse Nmnat3 recombinant protein, and spleen cells were used to make hybridoma cells by the polyethylene glycol method. For Western blotting, hybridoma supernatant was used at ×100 dilution. HRP-conjugated secondary antibodies were obtained from Millipore. PVDF membrane (Millipore) was used for blotting and signals were detected by a LAS4000 mini-digital imager (GE Healthcare).
Histological and Cytological Staining
All staining solutions were purchased from Muto Pure Chemicals (Japan). For H&E staining, the spleen was embedded in OCT (Tissue-Tek) using an dry ice/acetone bath. Serial sections at 10-μm thickness were made on a cryostat (Leica CM3050S) and tissue sections were placed on the MAS-coated slide glass (Matsunami, Japan). After fixation with 4% paraformaldehyde, sections were stained with hematoxylin and eosin. For May-Giemsa staining, air-dried whole blood smear was made on MAS-coated slide glass. Blood smear slides were fixed and stained with May-Grunwald staining solution and Giemsa solution. For New Methylene Blue staining, 2 volumes of blood and 1 volume of New Methylene Blue staining solution were mixed and incubated for 15 min at room temperature. Sample slides were observed using BX61 microscope equipped with ×100 oil immersion lens (Olympus, Japan).
Scanning Electron Microscope Analysis
Blood samples were fixed with 2% glutaraldehyde in 0.1 m phosphate buffer for 1 h at 4 °C. After the samples were washed with 0.1 m phosphate buffer two times, the post-fixation was carried out using 1% osmium tetroxide in 0.1 m phosphate buffer for 1 h at 4 °C. After the wash with 0.1 m phosphate buffer, samples were gradually dehydrated using 50, 70, 80, 90, 99 (v/v ethanol/water), and 100% ethanol for 5 min in each step. Ethanol was replaced by t-butyl alcohol and the samples were frozen at 4 °C. After vacuum drying, the surface of samples was coated with platinum/palladium. Samples were observed by a field emission scanning electron microscope (FE-SE) S-4500 (Hitachi, Japan).
Flow Cytometer Analysis and Cell Sorting Experiments
Bone marrow cells were harvested from femur bones. The single-cell suspension of splenocytes and bone marrow cells were prepared by passing through a 70-μm cell-strainer (BD Biosciences). Peripheral blood was obtained by tail bleeding. Ter119 and CD71 expression were examined using anti-Ter119-phycoerythrin (PE) and anti-CD71-FITC-conjugated antibodies (BD Biosciences; 1:200 dilution). Flow-activated cell sorting (FACS) analysis was performed using a FACS Canto II Flow Cytometer (BD Biosciences). Each erythroblast population was obtained from splenocytes by FACS Aria Cell Sorter (BD Biosciences).
In Vivo Erythrocyte Lifespan Assay
An in vivo erythrocyte lifespan assay was as described elsewhere (37). Briefly, 12-week-old mice were biotinylated by tail vein injection of 3 mg of EZ-Link Sulfo-NHS-biotin (Thermo) dissolved in 0.2 ml of phosphate-buffered saline. After 4 h circulation, blood was drawn from the tail vein and labeled with PE-conjugated streptavidin (1:500). The biotinylated erythrocyte was measured using a FACS Canto II Flow Cytometer and calculated as 100% biotinylated erythrocyte at day 0. Subsequently, blood was drawn at days 3, 5, 10, 15, and 20 and the percentage of biotinylated erythrocyte was determined.
Nmnat Activity and Discrimination Assay
Hemolysed samples were prepared as described above. Each sample was normalized by hemoglobin concentration at 20 μg/μl, and then hemoglobin was depleted using HemogloBind (Biotech Support Group LCC.). After depletion of hemoglobin, samples were dialyzed against dialysis buffer (25 mm Tris-Cl, pH 7.8, 100 mm NaCl, and 10% glycerol) to remove interfering endogenous metal ions and metabolites. Condition of the discrimination assay was determined as described previously (38). The total 100 μl of reaction mixture contained 10 μl of dialyzed sample, 1 mm ATP, and 1 mm NMN in a final concentration. Metal ions were used at 0.05 mm for MgCl2 or 5 mm for CoCl2 in final concentrations. The reaction was terminated by adding 200 μl of 0.5 n perchloric acid (PCA) at 0, 10, 20, and 30 min. After centrifugation, the supernatant was collected and the NAD amount formed was measured by LC-MS/MS as described below.
Enzymatic Activity Assay of Erythrocytes Metabolic Enzymes
Heparinized whole blood was washed three times with ice-cold saline and passed through a column of α-cellulose and microcrystalline cellulose to deplete leukocytes and platelets. Enzyme activities in RBCs were measured by the methods recommended by International Committee for Standardization in Hematology (39).
Metabolites Extraction for LC-MS/MS Measurement
The metabolites of erythrocytes were extracted using PCA for NAD-related metabolites except for NADH (40) or methanol for glycolysis-related metabolites (41). NADH was extracted with ammonium acetate/acetonitrile (ACN)/chloroform (42). For PCA extraction, 400 μl of whole blood was centrifuged at 1,000 × g for 5 min at room temperature, and then plasma and buffy coat were discarded. Packed erythrocytes were washed with ice-cold saline twice and cell numbers were counted by a automated cell counter (Invitrogen). Then, 400 μl of 0.5 n PCA was added to the packed 5 × 10⁸ erythrocytes. After the vortex, precipitated proteins were separated by centrifugation at 15,000 × g for 10 min at 4 °C. Right before the measurement, supernatant was neutralized with an equal volume of 1 m ammonium formate and filtered with 0.45-μm Millex filter unit (Millipore). For methanol extraction, 400 μl of whole blood was used for preparing packed erythrocytes. After washing with ice-cold saline twice, 5 × 10⁸ erythrocytes were lysed with 350 μl of LC-MS grade pure water followed by addition of 150 μl of 100% methanol. Then, samples were boiled at 95 °C for 1 min and kept on ice for 10 min. After centrifugation, collected supernatants were filtered with a 0.45-μm Millex filter unit. NAD-related metabolite extraction from whole blood was performed by direct PCA addition followed by the same procedure as the RBC samples.
Metabolite Measurements by LC-MS/MS
The level of metabolites was determined by an Agilent 6460 Triple Quad mass spectrometer coupled to an Agilent 1290 HPLC system. Chromatographic conditions are used as previously described with modifications (40, 43). NAD-related metabolites were separated on a Waters Atlantis T3 column (2.1 × 150 mm, 3 μm) with a 10-μl volume injection, at a flow rate of 150 μl/min using 5 mm ammonium formate for mobile phase A and 100% methanol for mobile phase B. The setting for gradients was as following: 0–10 min, 0–70% B; 10–15 min, 70% B; 15–20 min, 0% B. MS was operated in positive ESI multiple reaction monitoring (MRM) mode. The absolute amount of NAD was calculated from the NAD standard curve by MassHunter Quantitative analysis software (Agilent). Glycolysis-related metabolites were separated on a Waters XBridge Amide column (2.1 × 150 mm, 3.5 μm) with a 10-μl volume injection and flow rate of 300 μl/min using 20 mm ammonium acetate, pH 9.0 (H2O:ACN = 95:5), for mobile phase A and 100% ACN for mobile phase B. The setting for gradients was: 0–5 min, 85–42% B; 5–16 min, 42–2% B; 16–21 min, 2% B; 21–30 min, 85% B. MS was operated in negative ESI MRM mode. All solvents used for these experiments were LC-MS grade or HPLC grade purchased from Wako Pure Chemicals (Osaka, Japan).
[13C]Glucose Labeling and Tracer Analysis
Whole blood was centrifuged at 1,000 × g for 5 min at room temperature, and plasma and buffy coat were removed. Packed erythrocytes were washed with 1 ml of physiological saline once. 2.5 × 10⁸ cells/tube were preincubated with normal RPMI 1640 medium (Nacalai Tesque, Japan) at 37 °C for 30 min, then medium was changed to glucose-free RPMI 1640 medium (Nacalai Tesque) supplemented with 2.0 g/liter of [U-13C]glucose or [1,2-13C]glucose (Cambridge Isotope Inc.). The samples were collected at 0, 30, 60, 90, and 120 min after medium change. Metabolites were extracted by methanol as described above.
ATP Measurement
The whole blood ATP level was measured using the Blood ATP measuring kit (TOYO INK, Japan), which is based on a Renilla luciferase-ATP-luciferin luminescent reaction. Luminescence was measured by Varioskan Flash (Thermo) after Luciferin/Luciferase solution was injected to the sample according to the manufacturer's instruction.
Peripheral Blood Cell Count
For peripheral blood cell count, whole blood was collected from inferior vena cave under anesthesia. Whole blood was immediately transferred to a EDTA-2K containing tube. Peripheral blood cell count was carried out at the FALCO Bio Systems veterinary medicine laboratories (Kyoto, Japan). Reticulocyte and white blood cell subpopulations were counted by the flow cytometer method at FALCO BioSystems veterinary medicine laboratories.
Statistic Analysis
Analysis was performed using an unpaired or paired Student's t test, and significant differences are indicated by a single asterisk (*) when p < 0.05, double asterisk (**) when p < 0.01, and triple asterisk (***) when p < 0.005.
RESULTS
Nmnat3 Is Localized in Cytoplasm of Mature Erythrocytes
The Nmnat3 protein expression pattern of wild-type mice in various tissues was examined by Western blotting, using a rat monoclonal antibody raised against the mouse Nmnat3 full-length recombinant protein. Although Nmnat3 is known to be important in mitochondrial NAD metabolism, Nmnat3 protein expression showed marked variation in the tissues (Fig. 1A). RBC showed the highest expression level among the tissues examined, and heart, skeletal muscle, and liver showed relatively lower amounts of Nmnat3 (Fig. 1A). Nmnat3 was reported as a mitochondrial protein by several previous researchers (13, 26, 28, 44). Indeed, we were able to confirm that overexpressed Nmnat3 was localized in mitochondria in HeLa cells (Fig. 1B). However, it is also known that mature erythrocytes have no mitochondria. We accordingly investigated the subcellular localization of Nmnat3 in mature erythrocytes. We isolated mature erythrocytes from wild-type mice using a Percoll gradient method and then successfully fractionated mature erythrocyte proteins into cytoplasmic and membrane fractions. We found Nmnat3 exclusively in the cytoplasmic fraction of mature erythrocyte (Fig. 1C). Next, we examined the subcellular localization of Nmnat3 in reticulocyte, which possess mitochondria. We found that Nmnat3 in reticulocytes also existed in cytoplasmic fraction rather than mitochondria (Fig. 1D). From these results, we concluded that Nmnat3 is a cytoplasmic protein, at least in mature erythrocytes and reticulocytes.
FIGURE 1.

Nmnat3 exists in the cytoplasmic fraction of mature erythrocytes. A, immunoblot analysis of Nmnat3 expression in the indicated tissues from a wild-type (WT) mouse. β-Actin, β-Tubulin, and GAPDH were used as loading controls. B, immunofluorescent images of human NMNAT3-FLAG overexpressed HeLa cells (right panel). DsRed2-Mito was co-transfected and used as a mitochondrial marker (red). NMNAT3-FLAG (green) was visualized by anti-FLAG M2 antibody. NMNAT3-FLAG expression was also confirmed by Western blotting with anti-FLAG M2 antibody (left panel). C, a fractionation experiment of mature erythrocytes using WT mouse. GAPDH was used as a cytoplasm fraction marker. Ter119 and β-Actin were used as membrane fraction markers. Nmnat3 was detected in the cytoplasm fraction. D, fractionation experiment of reticulocyte using WT mouse. GAPDH was used as a cytoplasm fraction marker. Tom20 was used as a mitochondrial fraction marker. Nmnat3 was detected in the cytoplasm fraction. IB, immunoblot.
Nmnat3gt/gt Mice Exhibited Splenomegaly and Hemolytic Anemia
To investigate the physiological functions of Nmnat3, we generated Nmnat3-deficient mice by the gene-trap method (Fig. 2, A–C). We verified that Nmnat3 mRNA and protein were absent in Nmnat3 gene-trap homozygous (Nmnat3gt/gt) mice (Fig. 2, D–H). Thus, Nmnat3gt/gt mice were considered as Nmnat3-deficient mice, or at least severely Nmnat3-scarce mice.
FIGURE 2.

Nmnat3gt/gt mice exhibit splenomegaly and hemolytic anemia. A, map of Nmnat3 gene-trapped allele. The gene-trap cassette was inserted into the indicated point between Nmnat3 gene exon 1 and exon 2. B, structure of Nmnat3 mRNA generated from WT and Nmnat3 gene-trapped allele. The abbreviations used are as follows: SA, splicing acceptor; β-geo, β-galactosidase and neomycin resistance cassette fusion gene; pA, poly(A). C, genotyping PCR of Nmnat3 gene-trap homozygous mice (Nmnat3gt/gt mice). Primer sets are shown as a green arrow in A. These primer sets successfully amplified 340-, 675-, and 184-bp PCR products for wild-type allele, 5′ end and 3′ end of gene-targeted allele, respectively. D–F, real-time quantitative PCR analysis of Nmnat3 mRNA using primer sets to detect exon 1, exon 2–3 junction, or exon 5. Total RNA was prepared from skeletal muscle (D), heart (E), and liver (F). Data are presented as mean ± S.D. (n = 4 for each group). G and H, immunoblot analysis of Nmnat3 in RBC (G) and skeletal muscle (H) prepared from WT and Nmnat3gt/gt mice. β-Actin or β-Tubulin was used as a loading control. Arrowhead indicates the Nmnat3 band (∼30 kDa). I, representative picture of spleens from 8-week-old WT and Nmnat3gt/gt mice. J, ratio of spleen and body weight was calculated using WT and Nmnat3gt/gt mice (n = 4 for each group). K, hematoxylin-eosin (H&E) staining of spleen section prepared from WT and Nmnat3gt/gt mice. Hemosiderin deposit was seen in the enlarged lower left corner. Scale bar represents 50 μm. L, May-Giemsa and New Methylene Blue staining of peripheral blood collected from WT and Nmnat3gt/gt mice. Scale bar represents 20 μm. M, representative scanning electron microscope image of erythrocytes prepared from WT and Nmnat3gt/gt mice. Experiments were independently repeated three times. N, RBCs of 12-week-old mice (n = 3 for each group) were biotinylated by tail vein injection of EZ-Link Sulfo-NHS-biotin and blood was drawn at the indicated time. RBC was labeled with PE-conjugated streptavidin and quantified by flow cytometry. Data are presented as mean ± S.D. (n = 3 for each group). IB, immunoblot.
Nmnat3gt/gt mice were born in a Mendelian's ratio (data not shown) and looked normal at appearance. However, Nmnat3gt/gt mice exhibited splenomegaly from a young age (Fig. 2, I and J), and histological examination revealed that the red pulp of the spleen was enlarged (Fig. 2K). Increased iron deposits (hemosiderin) were also seen in Nmnat3gt/gt mice spleens (Fig. 2K). These results suggested that erythrocyte destruction was increased in Nmnat3gt/gt mice. As expected, hematological examination of peripheral blood in Nmnat3gt/gt mice revealed moderate anemia, as evidenced by decreased numbers of RBC, lower hematocrits, and lower concentrations of hemoglobin (Table 2). However, no significant differences were found in numbers of white blood cell (WBC) and platelets (PLT) between Nmnat3gt/gt and control mice. Numbers of reticulocytes in Nmnat3gt/gt mice were markedly increased (Table 2). We confirmed reticulocytosis in Nmnat3gt/gt mice by May-Giemsa staining and New Methylene Blue staining (Fig. 2L). These data suggested that Nmnat3gt/gt mice manifested hemolytic anemia. In support of this view, scanning electron microscopy detected a striking morphological change in Nmnat3gt/gt RBCs. RBCs in control mice showed the normal discocyte shape, whereas most RBCs in Nmnat3gt/gt mice appeared as acanthocytes or echinocytes, which show abnormal spiked membrane projections (Fig. 2M). Next, we assessed the lifespan of erythrocytes using an in vivo biotin-labeling method. The lifespan of mature erythrocytes in rodents has been reported as 50 to 60 days on average (37). However, we found the lifespan of erythrocytes in Nmnat3gt/gt mice to be greatly reduced to ∼10 days (Fig. 2N). We concluded from these findings that Nmnat3gt/gt mice exhibited splenomegaly due to hemolytic anemia.
TABLE 2.
Hematological examination reveals Nmnat3gt/gt mice are anemic, but not pancytopenia
Peripheral blood cell numbers and various hematological parameters were counted in 12-week-old WT and Nmnat3gt/gt mice (n = 4 for each group). All data are expressed as mean ± S.D. The abbreviations used are as follows: RBC, red blood cell; Hb, hemoglobin; HCT, hematocrit; MCV, mean corpuscle volume; MCH, mean corpuscle hemoglobin; MCHC, mean corpuscle hemoglobin concentration; WBC, white blood cell; Neu, neutrophil; Lym, lymphocyte; Ba, basophil; Eo, eosinophil; Mo, monocyte; PLT, platelet.
| Peripheral blood cell count |
|||
|---|---|---|---|
| WT | Nmnat3gt/gt | p value | |
| RBC (×104/μl) | 730 ± 12.2 | 483 ± 11.8 | <0.0001 |
| Hb (g/dl) | 11.2 ± 0.299 | 7.70 ± 0.141 | <0.0001 |
| Ht (%) | 37.0 ± 0.825 | 25.4 ± 0.480 | <0.0001 |
| MCV (fl) | 50.7 ± 0.804 | 52.6 ± 0.545 | <0.05 |
| MCH (pg) | 15.4 ± 0.258 | 16.0 ± 0.206 | <0.05 |
| MCHC (%) | 30.4 ± 0.311 | 30.4 ± 0.386 | NSa |
| WBC (×102/μl) | 24.3 ± 5.44 | 16.8 ± 5.68 | NS |
| Neu (%) | 17.3 ± 3.40 | 13.0 ± 3.56 | NS |
| Lym (%) | 78.0 ± 5.29 | 84.5 ± 3.79 | NS |
| Ba (%) | 0.00 ± 0.00 | 0.00 ± 0.00 | NS |
| Eo (%) | 2.00 ± 1.83 | 1.00 ± 0.82 | NS |
| Mo (%) | 2.75 ± 0.96 | 1.50 ± 1.29 | NS |
| PLT (×104/μl) | 87.3 ± 7.83 | 76.2 ± 2.62 | NS |
| Reticulocyte (‰) | 36.0 ± 1.41 | 236 ± 10.2 | <0.0001 |
a NS, not significant.
Erythropoiesis Is Up-regulated in Nmnat3gt/gt Mice as a Compensatory Mechanism
Nmnat3gt/gt mice showed increased numbers of reticulocytes (Table 2 and Fig. 2L), suggesting that erythropoiesis in these mice would be normal. In anemic mice, increased erythropoiesis primarily occurs in the spleen rather than in bone marrow (45). We next investigated the erythropoiesis stage using the cell surface markers CD71 (transferrin receptor) and Ter119 (glycophorin-associating protein) in splenocytes and bone marrow cells (46). Immature CD71high/Ter119high (P4) and CD71middle/Ter119high (P5) fractions were markedly increased in splenocytes from Nmnat3gt/gt mice (Fig. 3A). However, the most mature CD71low/Ter119high (P6) fraction was decreased. The larger P4 fraction was also observed in bone marrow cells (Fig. 3B). We further checked the erythroid developmental stage of peripheral blood. Consistent with the hematological examination, the mature erythrocyte fraction (P6) was decreased in Nmnat3gt/gt mice (Fig. 3C). In general, reticulocytes enter the peripheral blood after enucleation and retain mitochondria. We investigated whether this step occurred normally in Nmnat3gt/gt mice. Peripheral blood samples from Nmnat3gt/gt and control mice were stained with Hoechst 33342 and MitoTracker Orange for nucleus and mitochondria, respectively. As shown in Fig. 3D, nuclei were rarely seen in either mice, but there were more mitochondria in Nmnat3gt/gt mice likely due to a larger fraction of reticulocytes. Taking all evidence together, we concluded that erythropoiesis was markedly increased to compensate for the decrease in mature erythrocytes, but that peripheral erythroid maturation was generally normal in Nmnat3gt/gt mice. These results also support the proposition that the anemia in Nmnat3gt/gt mice was not due to the abnormality in erythropoiesis but due to the shorter lifespan of mature erythrocytes.
FIGURE 3.

Erythropoiesis is compensatory up-regulated, but normal in Nmnat3gt/gt mice. A–C, flow cytometer analysis for erythroid differentiation stage. Splenocytes (A), bone marrow cells (B), and peripheral blood (C) prepared from 8-week-old WT and Nmnat3gt/gt mice were analyzed by the expression of erythroid cell surface marker Ter119 and CD71 with a flow cytometer. The representative data are shown in left panel for each cell types. P4 (Ter119 high/CD71high), P5 (Ter119 high/CD71middle), and P6 (Ter119high/CD71low) populations were calculated as percent of total (right graph). Data are presented as mean ± S.D. (n = 4 for each group). D, whole blood cells were stained with Hoechst 33342 and MitoTracker Orange for nucleus and mitochondria, respectively. Cells stained with Hoechst 33342 are indicated by arrow. Phase-contrast image (DIC) was shown in left panel.
Nmnat3 Is a Dominant Nmnat Isozyme in Mature Erythrocytes
We found that Nmnat3 was present in mature erythrocytes and had a crucial role in their lifespan regulation. However, the significance of the two other Nmnat isozymes in mature erythrocytes is not clear. To address this question, we investigated whether enzymatic activity of the other Nmnat isoforms could be detected in mature erythrocytes. To assess Nmnat enzymatic activity, we employed an Nmnat isozyme discrimination assay (38), in which MgCl2 was used as a metal cofactor to measure total Nmnat activity and CoCl2 for relatively Nmnat3-specific activity. We confirmed that Nmnat3-specific activity was almost absent from Nmnat3gt/gt erythrocytes (Fig. 4A, left panel). Total Nmnat activity was largely compromised as well, suggesting that the other two Nmnat activities were absent or at least very minor (Fig. 4A, right panel). Consistent with these results, neither Nmnat1 nor Nmnat2 were identified in mature erythrocytes by Western blotting with Nmnat1- and Nmnat2-specific antibodies (Fig. 4B). These results suggested that Nmnat3 is most dominant among the three Nmnat isozymes in mature erythrocytes.
FIGURE 4.
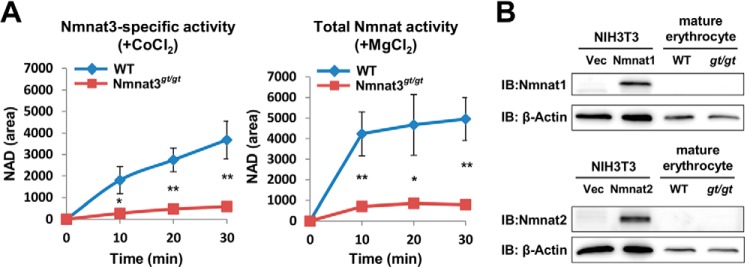
Nmnat3 is a dominant Nmnat isozyme in mature erythrocytes. A, Nmnat3-specific activity and total Nmnat activity of mature erythrocytes were determined by a discrimination assay with CoCl2 and MgCl2, respectively. For this assay, mature erythrocyte lysates were prepared from WT and Nmnat3gt/gt mice. Samples were dialyzed to remove endogenous metal ion and metabolites. Data are presented as mean ± S.D. (n = 3 for each group). B, immunoblot (IB) analysis of endogenous Nmnat1 and Nmnat2 protein in mature erythrocyte with Nmnat1 and Nmnat2 specific antibody. Total cell lysates from mouse Nmnat1 or Nmnat2 overexpressed NIH3T3 cells were used as positive control.
NAD Pool Is Drastically Decreased in Nmnat3gt/gt Erythrocytes
Next, we investigated the effect of Nmnat3 deficiency on NAD metabolism in erythrocytes. We measured NAD-related metabolites in RBCs using MRM-based liquid chromatography-tandem mass spectrometry (LC-MS/MS) method. The NAD level in Nmnat3gt/gt erythrocytes was drastically reduced compared with that in wild-type erythrocytes (Fig. 5, A and B). NADH was also markedly decreased in Nmnat3gt/gt erythrocytes (Fig. 5C). However, the NADH/NAD ratio was not much changed (WT, 0.0072; Nmnat3gt/gt, 0.0063). To avoid the potential changes during sample preparation, we also measured NAD in whole blood samples, which were immediately quenched after blood collection from anesthetized mice. NAD levels of whole blood in Nmnat3gt/gt mice were reduced to the same extent as in RBCs (Fig. 5D). We also measured other NAD-related metabolites in RBCs and whole blood. NMN and NAM were markedly reduced in Nmnat3gt/gt erythrocytes (Fig. 5, E and F). However, nicotinic acid (NA) and tryptophan (Trp) were unchanged between WT and Nmnat3gt/gt RBCs. We also found that nicotinic acid dinucleotide (NAAD) was significantly reduced in Nmnat3gt/gt RBCs (Fig. 5E). This result confirmed the involvement of Nmnat3 in the final step of the de novo synthesis pathway. In addition, we measured NAD levels in other tissues, such as liver, heart, and skeletal muscle, and surprisingly found that the level of NAD in these tissues was not changed in Nmnat3gt/gt mice (Fig. 5G). We also determined whether the NAD level in erythroid precursor cells was affected. We isolated P4 (polychromatophilic erythroblast, orthochromatic erythroblast and reticulocyte), P5 (reticulocyte), and P6 (mature erythrocyte) subpopulation cells from total splenocytes using a cell sorter (Fig. 5H). Consistent with the result obtained from RBCs and whole blood, the mature erythrocyte fractions (P6) from Nmnat3gt/gt mice had a markedly reduced NAD level. In contrast, no change was observed in the P4 or P5 fractions (Fig. 5I). These results suggested that Nmnat3 is critical for maintaining NAD levels only in mature erythrocytes and not in their precursor cells or other tissues such as heart, liver, and skeletal muscle.
FIGURE 5.

NAD pool in mature erythrocytes is drastically reduced in Nmnat3gt/gt mice. A, representative chromatograms of NAD in RBC samples prepared from WT and Nmnat3gt/gt mice. B and C, absolute quantification of NAD (B) and NADH (C) levels in RBC prepared from 8-week-old WT and Nmnat3gt/gt mice. The concentration was calculated from the peak area using a standard curve and expressed as the defined unit. Data are presented as mean ± S.D. (n = 4 for each group). D, absolute quantification of the NAD level in whole blood prepared from 8-week-old WT and Nmnat3gt/gt mice. The concentration was calculated from the peak area using the standard curve and expressed as the defined unit. Data are presented as mean ± S.D. (n = 4 for each group). E and F, semiquantification of NAD-related metabolites in RBC (E) or whole blood (F). NAM, NMN, NAD, nicotinic acid (NA), nicotinic acid mononucleotide (NAMN), nicotinic acid adenine dinucleotide (NAAD), and nicotinamide riboside (NR) were measured by LC-MS/MS. Data are presented as mean ± S.D. (n = 4 for each group). N.D. means not detected. G, NAD amount was measured in heart, liver, and skeletal muscle. NAD amount was normalized by wet tissue weight. Data are presented as mean ± S.D. (n = 4 for each group). H, representative result of FACS sorting. Splenocytes from WT and Nmnat3gt/gt mice were stained with anti-CD71-FITC and anti-Ter119-PE, and sorted by FACS Aria with defined gates. I, P4 (Ter119high/CD71high), P5 (Ter119high/CD71middle), and P6 (Ter119high/CD71low) subpopulations of splenocytes were sorted, and the NAD level in these samples were measured by LC-MS/MS. Data are presented as mean ± S.D. (n = 4 for each group). J, absolute quantification of NADP in RBC. NADP was measured by LC-MS/MS. The concentration was calculated from the peak area using the standard curve and expressed as the defined unit. Data are presented as mean ± S.D. (n = 4 for each group). K, immunoblot analysis of NADK and Nampt in mature erythrocytes from WT and Nmnat3gt/gt mice. β-Actin was used as a loading control. The arrowhead indicates the NADK band (∼50 kDa). Proteins were extracted from three mice for each group. L, GSH (reduced glutathione) and GSSG (oxidized glutathione) in RBC were measured by LC-MS/MS. Data are presented as mean ± S.D. (n = 4 for each group).
In erythrocytes, the pentose phosphate pathway is very active in protecting against oxidative stress through the NADP-glutathione system (47). Interestingly, we observed no significant difference in the NADP level between WT and Nmnat3gt/gt erythrocytes (Fig. 5J). To investigate how NADP was maintained in Nmnat3gt/gt erythrocytes, we examined the expression level of NAD kinase (NADK), which was responsible for generating NADP from NAD. We found that NADK was significantly increased in Nmnat3gt/gt erythrocytes (Fig. 5K). In addition, the concentration of NADP in erythrocyte was much less than that of NAD (Fig. 5, B and J). Therefore, it was speculated that NADP in Nmnat3gt/gt erythrocytes was more preferentially maintained than NAD. We also found that the reduced glutathione (GSH) level in Nmnat3gt/gt erythrocytes was comparable with that in WT. However, the oxidative glutathione (GSSG) was slightly but significantly decreased (Fig. 5L). This result also supported the idea that NADP was maintained in Nmnat3gt/gt erythrocytes. Taken all together, we inferred that the NADP-glutathione system in Nmnat3gt/gt erythrocytes was not impaired.
Glycolytic Pathway Was Blocked in Nmnat3gt/gt Erythrocytes
Erythrocytes are known to exclude all of organelles, including nucleus and mitochondria, during maturation. Thus, energy (as ATP) production in mature erythrocytes relies primarily on the cytosolic glycolysis pathway. In particular, GAPDH and lactate dehydrogenase use NAD and NADH for their enzymatic reactions and recycle them between these two reactions. To assess the effect of Nmnat3 deficiency on glycolysis, we quantified metabolites of the glycolysis pathway and the pentose phosphate pathway by LC-MS/MS. Among glycolysis pathway intermediate metabolites, upstream metabolites, including glucose 6-phosphate (Glc-6-P), fructose 6-phosphate (Fru-6-P), and fructose 1,6-bisphosphate (Fru-1,6-BP) were markedly increased in Nmnat3gt/gt erythrocytes (Fig. 6A). In contrast, downstream metabolites, including 3-phosphoglycerate, phosphoenolpyruvate, and lactate were significantly decreased in Nmnat3gt/gt erythrocytes (Fig. 6A). In addition, PRPP was markedly increased (Fig. 6A). In the pentose phosphate pathway, ribose 5-phosphate, ribulose 5-phosphate, and xylulose 5-phosphate were increased in Nmnat3gt/gt erythrocytes (Fig. 6A). These data indicated that the glycolysis pathway in Nmnat3gt/gt erythrocytes was blocked in the middle and that the metabolic flow was shifted to the pentose phosphate pathway.
FIGURE 6.

Glycolysis pathway is blocked in Nmnat3gt/gt erythrocytes. A, metabolites in the glycolysis pathway and pentose phosphate pathway were measured using RBC samples obtained from 8-week-old WT and Nmnat3gt/gt mice (n = 4 for each group). Glc-6-P/Fru-6-P (glucose 6-phospate/fructose 6-phosphate), fructose 1,6-bisphosphate (Fru-1,6-BP), dihydroxyacetone phosphate (DHAP), GAP, 2,3-bisphosphoglycerate (2,3-BPG), 3-phosphoglycerate (3PG), phosphoenolpyruvate (PEP), pyruvate (PYR), lactate (LAC), 6-phosphogluconate (6PG), PRPP, ribose 5-phosphate/ribulose 5-phosphate (R5P/Ru5P), xylulose 5-phosphate (Xu5P), and sedoheptulose 7-phosphate (S7P) were analyzed by a MRM-based LC-MS/MS method. Data are presented as mean ± S.D. B, enzymatic activities of glycolysis enzymes were assayed with RBC lysate prepared from 8-week-old WT and Nmnat3gt/gt mice (n = 4 for each group). Phosphofructokinase (PFK), aldolase (ALD), pyruvate kinase (PK), hexokinase (HK), glucose-6-phosphate isomerase (GPI), triose-phosphate isomerase (TPI), phosphoglycerate kinase (PGK), enolase (ENOL), and lactate dehydrogenase (LDH) were measured by the methods recommended by International Committee for Standardization in Hematology. C, immunoblot analysis of phosphofructokinase and GAPDH in mature erythrocytes from WT and Nmnat3gt/gt mice. β-Actin was used as loading control. Proteins were extracted from three mice for each group. D, enzymatic activities of pentose phosphate pathway enzymes (Glc-6-PD, glucose-6-phosphate dehydrogenase; 6PGD, 6-phosphogluconolactone dehydrogenase) were assayed with RBC lysate prepared from 8-week-old WT and Nmnat3gt/gt mice (n = 4 for each group). E, enzymatic activities of adenylate kinase (AK) and adenosine deaminase (ADA) were assayed with RBC lysate prepared from 8-week-old WT and Nmnat3gt/gt mice (n = 4 for each group). F, measurement of acetyl-CoA level in RBC prepared from WT and Nmnat3gt/gt mice (n = 4 for each group). G, acetylation status of erythrocytes protein. RBC lysates were separated by SDS-PAGE and subjected to immunoblotting (IB) with acetyl-lysine-specific antibodies (Abcam and Cell Signaling). Proteins were extracted from three different mice for each group.
Next, we examined enzymatic activities of various glycolytic enzymes in erythrocytes to determine how the glycolysis pathway in Nmnat3gt/gt erythrocytes was blocked. We measured enzymatic activities of RBC lysate with excess amounts of substrates in vitro. The activities of most enzymes were up-regulated in Nmnat3gt/gt erythrocytes (Fig. 6B). For instance, phosphofructokinase, a rate-limiting enzyme of glycolysis, was markedly increased in Nmnat3gt/gt erythrocytes (Fig. 6B). In agreement with this finding, the protein level of phosphofructokinase was also increased in Nmnat3gt/gt erythrocytes (Fig. 6C). We also investigated other enzymes whose deficiency causes hemolytic anemia in human patients. However, they were unchanged or even increased in Nmnat3gt/gt erythrocytes (Fig. 6, D and E). Previous studies reported that acetylation increased the enzymatic activities of certain glycolytic enzymes (4, 5). In Nmnat3gt/gt erythrocytes, NAD levels were markedly decreased, and NAD-dependent deacetylase sirtuins may have been inactivated. Additionally, levels of acetyl-CoA, which is a substrate for acetylation, were also markedly increased in Nmnat3gt/gt erythrocytes (Fig. 6F). We accordingly speculated that the acetylation status of Nmnat3gt/gt erythrocyte proteins would be increased. We examined the acetylation status by Western blotting with antibodies against acetylated lysine residues and found that acetylation levels were indeed increased in Nmnat3gt/gt erythrocytes compared with that in WT (Fig. 6G). We inferred that the increased activities of several glycolytic enzymes in Nmnat3gt/gt erythrocytes were due in part to the increased acetylation of these enzymes.
Metabolic Flow in Nmnat3gt/gt Erythrocytes Was Reversed to Fru-1,6-BP through the Pentose Phosphate Pathway
Because glycolysis enzymes in Nmnat3gt/gt erythrocytes showed increased activity compared with that in WT erythrocytes, we speculated that inhibition of the glycolysis pathway in Nmnat3gt/gt erythrocytes was due to the blockade at GAPDH, which uses NAD as a coenzyme for the enzymatic reaction. Metabolomics data also suggested that the glycolysis pathway in Nmnat3gt/gt erythrocytes was stalled between Fru-1,6-BP and 3-phosphoglycerate (Fig. 6A). However, we confirmed that the protein levels of GAPDH were unchanged in Nmnat3gt/gt erythrocytes (Fig. 6C). This finding also suggested that GAPDH was inhibited due to the reduced levels of NAD. To test this hypothesis, we performed ex vivo stable-isotope tracer analysis using 13C-labeled glucose. Erythrocytes isolated from WT and Nmnat3gt/gt mice were cultured in RPMI 1640 medium supplemented with 13C-labeled glucose, and samples were collected at several time points. First, [U-13C]glucose was employed to evaluate the total flow of the glycolysis pathway. As shown in Fig. 7A, 13C-labeled Fru-1,6-BP increased much more rapidly in Nmnat3gt/gt erythrocytes. Ribose 5-phosphate/ribulose 5-phosphate and dihydroxyacetone phosphate also increased more in Nmnat3gt/gt erythrocytes. However, the accumulation of downstream metabolites including GAP, 2,3-BPG, 3-phosphoglycerate, and phosphoenolpyruvate was clearly slower in Nmnat3gt/gt erythrocytes (Fig. 7A). Thus, the glycolysis pathway in Nmnat3gt/gt erythrocytes was markedly slowed compared with that in WT erythrocytes.
FIGURE 7.

Glucose flow is shifted to the pentose phosphate pathway and reversed from GAP to Fru-1,6-BP in Nmnat3gt/gt erythrocytes. A, primary cultured erythrocytes prepared from WT and Nmnat3gt/gt mice were cultivated in the medium containing [U-13C]glucose. 13C-Labeled metabolites were monitored by the MRM-based LC-MS/MS method. Samples were harvested at the time point of 0, 30, 60, 90, and 120 min. Data are presented as mean ± S.D. (n = 4 for each group). B, scheme of the carbon flow by [1,2-13C]glucose tracer analysis. White and red circles are 12C and 13C, respectively. C and D, primary cultured erythrocytes prepared from WT and Nmnat3gt/gt mice were cultivated in medium containing [1,2-13C]glucose. Different isotopomers of 13C-labeled Fru-1,6-BP (C) and ribose 5-phosphate/ribulose 5-phosphate (R5P/Ru5P) (D) were monitored by the MRM-based LC-MS/MS method. Samples were harvested at the time points of 0, 30, 60, 90, and 120 min. Data are presented as mean ± S.D. (n = 4 for each group). E, measurement of ATP level in whole blood collected from WT and Nmnat3gt/gt mice (n = 4 for each group). Data are presented as mean ± S.D.
From static metabolomics data, we observed that Fru-1,6-BP, but not GAP, was increased in Nmnat3gt/gt erythrocytes (Fig. 6A). [U-13C]Glucose tracer analysis also indicated that the flow became slower between Fru-1,6-BP and GAP, a step catalyzed by aldolase. However, the enzymatic activity of aldolase was not reduced in Nmnat3gt/gt erythrocytes (Fig. 6B). We accordingly hypothesized that the glucose flow from the pentose phosphate pathway was reversed between Fru-1,6-BP and GAP. To test this hypothesis, we used [1,2-13C]glucose for further experiments to determine whether the flux to Fru-1,6-BP was directly from glycolysis or reversed from the pentose phosphate pathway via GAP. If Fru-1,6-BP were derived straight from glucose, the 1,2-carbon (+2) of Fru-1,6-BP would be labeled. In contrast, if it was synthesized through the pentose phosphate pathway and reversed from GAP, the 1-carbon (+1), 1,2,4-carbon (+3), or 1,2,3,4-carbon (+4) of Fru-1,6-BP would be labeled with 13C (Fig. 7B). As shown in Fig. 7C, Fru-1,6-BP (+1), (+3), and (+4) were significantly increased in Nmnat3gt/gt erythrocytes, whereas the level of Fru-1,6-BP (+2) was near that of WT. Additionally, ribose 5-phosphate/ribulose 5-phosphate (+1) was also increased in Nmnat3gt/gt erythrocytes (Fig. 7D). We concluded that the glycolytic flow in Nmnat3gt/gt erythrocytes was blocked at GAPDH because of the shortage of NAD. Moreover, the glycolytic flow in Nmnat3gt/gt erythrocytes was shifted to the pentose phosphate pathway, and the blockade at GAPDH resulted in a reverse flow into Fru-1,6-BP from GAP.
Finally, we measured the ATP level of whole blood in WT and Nmnat3gt/gt mice and found that the ATP level was markedly decreased in Nmnat3gt/gt mice (Fig. 7E). Thus, glycolysis blockade in Nmnat3gt/gt erythrocytes caused ATP production failure and ultimately lead to hemolytic anemia (Fig. 8).
FIGURE 8.

Schematic of the hemolytic anemia in Nmnat3gt/gt mice. Nmnat3 is the dominant Nmnat among the three isoforms in mature erythrocytes, and its deficiency leads to a drastic depletion of the NAD pool. A lowered NAD level inhibits glycolysis at GAPDH and reverse the glycolytic flow between Fru-1,6-BP and GAP. Impaired ATP synthesis in Nmnat3gt/gt erythrocytes leads to the dysfunction of Na+,K+-ATPase and a resulting spiked shaped erythrocytes, which are preferentially trapped and destroyed by the reticuloendothelial system of the spleen. Thus, Nmnat3 deficiency in mice caused splenomegaly and hemolytic anemia.
DISCUSSION
Although the importance of NAD metabolism in various biological processes is known, the physiological function of Nmnat3 in vivo is not fully understood. In this study, we demonstrated that the NAD synthesis enzyme, Nmnat3, plays an essential role in the maintenance of the NAD pool in mature erythrocytes. Given that Nmnat3 is the dominant Nmnat among the three isoforms in mature erythrocytes, its deficiency leads to a drastic depletion of the NAD pool. Mature erythrocytes have no mitochondria, and their energy metabolism relies primarily on glycolysis. Thus, a lowered NAD level inhibits glycolysis at GAPDH and their ATP production is impaired in Nmnat3gt/gt erythrocytes. In erythrocytes, most ATP is consumed by Na+,K+-ATPase, a plasma membrane-embedded pump that maintains erythrocyte shape (48). An ATP shortage in Nmnat3gt/gt erythrocytes leads to dehydration of erythrocytes and a resulting spiked shape. These abnormally shaped erythrocytes are preferentially trapped and destroyed by the reticuloendothelial system of the spleen. Thus, Nmnat3 deficiency in mice caused splenomegaly and hemolytic anemia (Fig. 8).
Nmnat3gt/gt mice manifest hemolytic anemia from a very early age, as early as 4 weeks. It is well known that some of metabolic enzyme deficiencies can cause congenital hemolytic anemia in humans (49). Nmnat3gt/gt mice exhibit a phenotype very similar to that of pyruvate kinase (PK)-deficient mice (50, 51). Among PK isoforms, liver and RBC-type PK (PKLR) deficiency cause hemolytic anemia. In PK-deficient mice, a shortened lifespan of mature erythrocytes primarily contributes to hemolytic anemia pathogenesis, whereas ineffective erythropoiesis also occurs in these mice (52). Thus, it is possible that ineffective erythropoiesis may occur in Nmnat3gt/gt mice. To date, no Nmnat3 gene mutation has been found in human hemolytic anemia patients. However, hemolytic anemia in Nmnat3gt/gt mice resemble the phenotype of PK-deficient mice. Indeed, lack of PK in mice similarly causes glycolysis inhibition and failure of ATP production. Notably, some hemolytic anemia patients clinically showed PK deficiency-like hemolytic anemia, but neither enzymatic deficiency nor a genetic mutation in pyruvate kinase were not found (53). Thus, it may be that an Nmnat3 gene mutation is hidden in human patients with congenital hemolytic anemia, particularly in undiagnosed PK deficiency-like patients.
We revealed that the level of NAD of Nmnat3gt/gt erythrocytes was drastically decreased compared with that of WT. In addition, mild decreases of NAM and NMN were also observed in Nmnat3gt/gt erythrocytes. One explanation of these decreases is that the salvage pathway in Nmnat3gt/gt erythrocytes is impaired. In the salvage pathway, NAM is supplied from NAD by sirtuin or PARP. It is uncertain that the conversion of NAM from NAD exists in mature erythrocytes. However, an extensive proteomic analysis identified PARP10, PARP12, and ADP-ribosylhydrolase 3 (ARH3) in human erythrocyte, as well as Nmnat3 (54). This fact implied the existence of a salvage pathway by PARP in mature erythrocytes, but the actual molecular identities are still unknown. Another explanation for the reduction of NAM and NMN in Nmnat3gt/gt erythrocytes is that the incorporation of NAM was impaired in Nmnat3gt/gt erythrocytes due to the deformation of plasma membrane. Indeed, PRPP, the other substrate for NMN synthesis and Nampt, a NMN synthesis enzyme, were significantly increased in Nmnat3gt/gt erythrocytes (Figs. 5K and 6A). These results also recapture the facts that NAM and NMN were decreased in Nmnat3gt/gt erythrocytes. However, molecular details of NAM incorporation into mature erythrocytes are still unclear and of interest for further investigations.
In Nmnat3gt/gt erythrocytes, Fru-1,6-BP was markedly increased due to the reverse flow from GAP. Fru-1,6-BP is known as an allosteric activator of pyruvate kinase (55). The accumulation of Fru-1,6-BP may increase the downstream flow of glycolysis by activating PK to compensate for the reduced glycolysis in Nmnat3gt/gt erythrocytes. We also demonstrated that the acetylation status in Nmnat3gt/gt erythrocytes was increased compared with that in WT. This difference could be due to decreased NAD and increased acetyl-CoA. As it is not verified whether sirtuin is present in erythrocytes, and thus the impact of decreased NAD in the hyperacetylation of Nmnat3gt/gt erythrocytes is unclear. However, a recent study suggests that protein acetylation in mitochondria occurs non-enzymatically and merely increased cellular acetyl-CoA can chemically acetylate proteins (56). It was reported that cytoplasmic acetyl-CoA in erythrocytes was generated from acetate by acetyl-CoA synthetase (57). It might be possible that the blockade of glycolysis in Nmnat3gt/gt erythrocytes indirectly activates the acetyl-CoA synthesis pathway. We measured the activity of several glycolysis and pentose phosphate pathway enzymes and found their activities to be similar or increased compared with that in WT. These results suggested that acetylation increased, or at least did not decrease, the activity of these enzymes. We can accordingly speculate that acetylation is not the cause of glycolysis inhibition in Nmnat3gt/gt erythrocytes but a compensatory result for decreased glycolysis. Thus, the accumulation of Fru-1,6-BP and hyperacetylation of erythrocyte proteins would be a compensatory reaction for recovering the compromised ATP production in Nmnat3gt/gt erythrocytes.
Although Nmnat3 is considered a mitochondrial protein, our study revealed that Nmnat3 can reside in the cytoplasm of mature erythrocytes. A previous report also indicated that Nmnat3 enzymatic activity was dominant in human erythrocytes (35). During the final step of erythropoiesis, mitochondria are excluded from reticulocytes. However, our result showed that Nmnat3 existed in the cytoplasm even in the reticulocytes. It was reported that some mitochondrial proteins are present in mature erythrocytes (54, 58). Thus, it is desirable to investigate the subcellular localization of Nmnat3 in various cell types other than erythrocytes. In addition, Nmnat3 distribution is limited to certain tissues. If Nmnat3 is responsible for mitochondrial NAD synthesis, it should be present in most cell types that possess mitochondria. Furthermore, we found that NAD levels in liver, skeletal muscle, and heart of Nmnat3gt/gt mice were similar to those in WT. Nmnat3gt/gt mice have no other phenotypes other than hemolytic anemia in the normal housed conditions, which pointed out an intriguing question of how the mutant mice maintain their mitochondrial NAD level in the absence of Nmnat3. It is currently accepted that NAD cannot cross the inner membrane of mitochondria and may be generated in the mitochondria matrix by Nmnat3 (59, 60). However, our results suggest that NAD is imported into mitochondria through an unidentified NAD transporter. Indeed, other groups have proposed such an NAD transporter (61–63). We also showed that Nmnat3gt/gt mice have normal hematopoiesis and erythropoiesis. In Nmnat3gt/gt mice, white blood cell and platelets show normal numbers and subpopulations. The Nmnat3gt/gt erythroblast fraction has the same amount of NAD as WT. Our results accordingly suggest that Nmnat1 and Nmnat2 can compensate for the mitochondrial NAD metabolism in these cells. As told, the mechanism of mitochondrial NAD supply may be more versatile than we understand currently.
In conclusion, our study has revealed the essential role of Nmnat3 on the NAD pool maintenance in mature erythrocytes. These findings provide new tools for studying the mechanism and pathophysiology of congenital hemolytic anemia and suggest the potential of NAD metabolism as a new therapeutic target of hemolytic anemia.
Acknowledgments
We are grateful to D. H. Lee, K. Shinzawa, and H. C. Chang for critical reading of the manuscript and Nakagawa Lab members for discussion. We also thank to Kazuyuki Nishio and Masahiko Kawahara (Life Science Research Center, University of Toyama) for help with scanning electron microscopy experiments and Tomomi Kubo for mice care and husbandry.
This work was supported by a Grant-in-aid for Young Scientists (A) (24609019) and a Grant-in-Aid for Scientific Research on Innovative Areas (24116511) (to T. N.). This work was also supported by grants from The Sumitomo Foundation, Kanae Foundation for the Promotion of Medical Science, Astellas Foundation for Research on Metabolic Disorders, and the Takeda Science Foundation (to T. N.).
- PARP
- poly(ADP-ribose) polymerases
- Nampt
- nicotinamide phosphoribosyltransferase
- NAM
- nicotinamide
- PRPP
- phosphoribosyl pyrophosphate
- NMN
- nicotinamide mononucleotide
- Nmnat
- nicotinamide mononucleotide adenylyltransferase
- qPCR
- quantitative PCR
- PCA
- perchloric acid
- MRM
- multiple reaction monitoring
- GAP
- glyceraldehyde 3-phosphate
- PK
- pyruvate kinase
- PE
- phycoerythrin.
REFERENCES
- 1. Chiarugi A., Dölle C., Felici R., Ziegler M. (2012) The NAD metabolome: a key determinant of cancer cell biology. Nat. Rev. Cancer 12, 741–752 [DOI] [PubMed] [Google Scholar]
- 2. Houtkooper R. H., Cantó C., Wanders R. J., Auwerx J. (2010) The secret life of NAD+: an old metabolite controlling new metabolic signaling pathways. Endocr. Rev. 31, 194–223 [DOI] [PMC free article] [PubMed] [Google Scholar]
- 3. Guarente L. (2013) Calorie restriction and sirtuins revisited. Genes Dev. 27, 2072–2085 [DOI] [PMC free article] [PubMed] [Google Scholar]
- 4. Zhao S., Xu W., Jiang W., Yu W., Lin Y., Zhang T., Yao J., Zhou L., Zeng Y., Li H., Li Y., Shi J., An W., Hancock S. M., He F., Qin L., Chin J., Yang P., Chen X., Lei Q., Xiong Y., Guan K. L. (2010) Regulation of cellular metabolism by protein lysine acetylation. Science 327, 1000–1004 [DOI] [PMC free article] [PubMed] [Google Scholar]
- 5. Wang Q., Zhang Y., Yang C., Xiong H., Lin Y., Yao J., Li H., Xie L., Zhao W., Yao Y., Ning Z. B., Zeng R., Xiong Y., Guan K. L., Zhao S., Zhao G. P. (2010) Acetylation of metabolic enzymes coordinates carbon source utilization and metabolic flux. Science 327, 1004–1007 [DOI] [PMC free article] [PubMed] [Google Scholar]
- 6. Motta M. C., Divecha N., Lemieux M., Kamel C., Chen D., Gu W., Bultsma Y., McBurney M., Guarente L. (2004) Mammalian SIRT1 represses forkhead transcription factors. Cell 116, 551–563 [DOI] [PubMed] [Google Scholar]
- 7. Purushotham A., Schug T. T., Xu Q., Surapureddi S., Guo X., Li X. (2009) Hepatocyte-specific deletion of SIRT1 alters fatty acid metabolism and results in hepatic steatosis and inflammation. Cell Metab. 9, 327–338 [DOI] [PMC free article] [PubMed] [Google Scholar]
- 8. Rodgers J. T., Lerin C., Haas W., Gygi S. P., Spiegelman B. M., Puigserver P. (2005) Nutrient control of glucose homeostasis through a complex of PGC-1α and SIRT1. Nature 434, 113–118 [DOI] [PubMed] [Google Scholar]
- 9. Mouchiroud L., Houtkooper R. H., Moullan N., Katsyuba E., Ryu D., Cantó C., Mottis A., Jo Y. S., Viswanathan M., Schoonjans K., Guarente L., Auwerx J. (2013) The NAD+/Sirtuin pathway modulates longevity through activation of mitochondrial UPR and FOXO signaling. Cell 154, 430–441 [DOI] [PMC free article] [PubMed] [Google Scholar]
- 10. Revollo J. R., Körner A., Mills K. F., Satoh A., Wang T., Garten A., Dasgupta B., Sasaki Y., Wolberger C., Townsend R. R., Milbrandt J., Kiess W., Imai S. (2007) Nampt/PBEF/Visfatin regulates insulin secretion in β cells as a systemic NAD biosynthetic enzyme. Cell Metab. 6, 363–375 [DOI] [PMC free article] [PubMed] [Google Scholar]
- 11. Yoshino J., Mills K. F., Yoon M. J., Imai S. (2011) Nicotinamide mononucleotide, a key NAD+ intermediate, treats the pathophysiology of diet- and age-induced diabetes in mice. Cell Metab. 14, 528–536 [DOI] [PMC free article] [PubMed] [Google Scholar]
- 12. Lau C., Niere M., Ziegler M. (2009) The NMN/NaMN adenylyltransferase (NMNAT) protein family. Front. Biosci. 14, 410–431 [DOI] [PubMed] [Google Scholar]
- 13. Berger F., Lau C., Dahlmann M., Ziegler M. (2005) Subcellular compartmentation and differential catalytic properties of the three human nicotinamide mononucleotide adenylyltransferase isoforms. J. Biol. Chem. 280, 36334–36341 [DOI] [PubMed] [Google Scholar]
- 14. Di Stefano M., Conforti L. (2013) Diversification of NAD biological role: the importance of location. FEBS J. 280, 4711–4728 [DOI] [PubMed] [Google Scholar]
- 15. Chiang P. W., Wang J., Chen Y., Fu Q., Zhong J., Chen Y., Yi X., Wu R., Gan H., Shi Y., Chen Y., Barnett C., Wheaton D., Day M., Sutherland J., Heon E., Weleber R. G., Gabriel L. A., Cong P., Chuang K., Ye S., Sallum J. M., Qi M. (2012) Exome sequencing identifies NMNAT1 mutations as a cause of Leber congenital amaurosis. Nat. Genet. 44, 972–974 [DOI] [PubMed] [Google Scholar]
- 16. Koenekoop R. K., Wang H., Majewski J., Wang X., Lopez I., Ren H., Chen Y., Li Y., Fishman G. A., Genead M., Schwartzentruber J., Solanki N., Traboulsi E. I., Cheng J., Logan C. V., McKibbin M., Hayward B. E., Parry D. A., Johnson C. A., Nageeb M., Finding of Rare Disease Genes (FORGE) Canada Consortium, Poulter J. A., Mohamed M. D., Jafri H., Rashid Y., Taylor G. R., Keser V., Mardon G., Xu H., Inglehearn C. F., Fu Q., Toomes C., Chen R. (2012) Mutations in NMNAT1 cause Leber congenital amaurosis and identify a new disease pathway for retinal degeneration. Nat. Genet. 44, 1035–1039 [DOI] [PMC free article] [PubMed] [Google Scholar]
- 17. Perrault I., Hanein S., Zanlonghi X., Serre V., Nicouleau M., Defoort-Delhemmes S., Delphin N., Fares-Taie L., Gerber S., Xerri O., Edelson C., Goldenberg A., Duncombe A., Le Meur G., Hamel C., Silva E., Nitschke P., Calvas P., Munnich A., Roche O., Dollfus H., Kaplan J., Rozet J. M. (2012) Mutations in NMNAT1 cause Leber congenital amaurosis with early-onset severe macular and optic atrophy. Nat. Genet. 44, 975–977 [DOI] [PubMed] [Google Scholar]
- 18. Falk M. J., Zhang Q., Nakamaru-Ogiso E., Kannabiran C., Fonseca-Kelly Z., Chakarova C., Audo I., Mackay D. S., Zeitz C., Borman A. D., Staniszewska M., Shukla R., Palavalli L., Mohand-Said S., Waseem N. H., Jalali S., Perin J. C., Place E., Ostrovsky J., Xiao R., Bhattacharya S. S., Consugar M., Webster A. R., Sahel J. A., Moore A. T., Berson E. L., Liu Q., Gai X., Pierce E. A. (2012) NMNAT1 mutations cause Leber congenital amaurosis. Nat. Genet. 44, 1040–1045 [DOI] [PMC free article] [PubMed] [Google Scholar]
- 19. Mack T. G., Reiner M., Beirowski B., Mi W., Emanuelli M., Wagner D., Thomson D., Gillingwater T., Court F., Conforti L., Fernando F. S., Tarlton A., Andressen C., Addicks K., Magni G., Ribchester R. R., Perry V. H., Coleman M. P. (2001) Wallerian degeneration of injured axons and synapses is delayed by a Ube4b/Nmnat chimeric gene. Nat. Neurosci. 4, 1199–1206 [DOI] [PubMed] [Google Scholar]
- 20. Sasaki Y., Vohra B. P., Baloh R. H., Milbrandt J. (2009) Transgenic mice expressing the Nmnat1 protein manifest robust delay in axonal degeneration in vivo. J. Neurosci. 29, 6526–6534 [DOI] [PMC free article] [PubMed] [Google Scholar]
- 21. Conforti L., Janeckova L., Wagner D., Mazzola F., Cialabrini L., Di Stefano M., Orsomando G., Magni G., Bendotti C., Smyth N., Coleman M. (2011) Reducing expression of NAD+ synthesizing enzyme NMNAT1 does not affect the rate of Wallerian degeneration. FEBS J. 278, 2666–2679 [DOI] [PubMed] [Google Scholar]
- 22. Gilley J., Coleman M. P. (2010) Endogenous Nmnat2 is an essential survival factor for maintenance of healthy axons. PLoS Biol. 8, e1000300. [DOI] [PMC free article] [PubMed] [Google Scholar]
- 23. Yan T., Feng Y., Zheng J., Ge X., Zhang Y., Wu D., Zhao J., Zhai Q. (2010) Nmnat2 delays axon degeneration in superior cervical ganglia dependent on its NAD synthesis activity. Neurochem. Int. 56, 101–106 [DOI] [PubMed] [Google Scholar]
- 24. Hicks A. N., Lorenzetti D., Gilley J., Lu B., Andersson K. E., Miligan C., Overbeek P. A., Oppenheim R., Bishop C. E. (2012) Nicotinamide mononucleotide adenylyltransferase 2 (Nmnat2) regulates axon integrity in the mouse embryo. PLoS One 7, e47869. [DOI] [PMC free article] [PubMed] [Google Scholar]
- 25. Gilley J., Adalbert R., Yu G., Coleman M. P. (2013) Rescue of peripheral and CNS axon defects in mice lacking NMNAT2. J. Neurosci. 33, 13410–13424 [DOI] [PMC free article] [PubMed] [Google Scholar]
- 26. Nikiforov A., Dölle C., Niere M., Ziegler M. (2011) Pathways and subcellular compartmentation of NAD biosynthesis in human cells: from entry of extracellular precursors to mitochondrial NAD generation. J. Biol. Chem. 286, 21767–21778 [DOI] [PMC free article] [PubMed] [Google Scholar]
- 27. Sasaki Y., Araki T., Milbrandt J. (2006) Stimulation of nicotinamide adenine dinucleotide biosynthetic pathways delays axonal degeneration after axotomy. J. Neurosci. 26, 8484–8491 [DOI] [PMC free article] [PubMed] [Google Scholar]
- 28. Yahata N., Yuasa S., Araki T. (2009) Nicotinamide mononucleotide adenylyltransferase expression in mitochondrial matrix delays Wallerian degeneration. J. Neurosci. 29, 6276–6284 [DOI] [PMC free article] [PubMed] [Google Scholar]
- 29. Preiss J., Handler P. (1957) Enzymatic synthesis of nicotinamide mononucleotide. J. Biol. Chem. 225, 759–770 [PubMed] [Google Scholar]
- 30. Micheli V., Sestini S. (1997) Determining NAD synthesis in erythrocytes. Methods Enzymol. 280, 211–221 [DOI] [PubMed] [Google Scholar]
- 31. Micheli V., Simmonds H. A., Sestini S., Ricci C. (1990) Importance of nicotinamide as an NAD precursor in the human erythrocyte. Arch. Biochem. Biophys. 283, 40–45 [DOI] [PubMed] [Google Scholar]
- 32. Micheli V., Sestini S., Rocchigiani M., Pescaglini M., Ricci C. (1991) Significance and relevance of NAD synthesis in human erythrocyte life span. Adv. Exp. Med. Biol. 307, 139–146 [DOI] [PubMed] [Google Scholar]
- 33. Sestini S., Ricci C., Micheli V., Pompucci G. (1993) Nicotinamide mononucleotide adenylyltransferase activity in human erythrocytes. Arch. Biochem. Biophys. 302, 206–211 [DOI] [PubMed] [Google Scholar]
- 34. Liu R., Orgel L. E. (1995) Enzymatic synthesis of polymers containing nicotinamide mononucleotide. Nucleic Acids Res. 23, 3742–3749 [DOI] [PMC free article] [PubMed] [Google Scholar]
- 35. Di Stefano M., Galassi L., Magni G. (2010) Unique expression pattern of human nicotinamide mononucleotide adenylyltransferase isozymes in red blood cells. Blood Cells Mol. Dis. 45, 33–39 [DOI] [PubMed] [Google Scholar]
- 36. Noble N. A., Xu Q. P., Ward J. H. (1989) Reticulocytes. I. Isolation and in vitro maturation of synchronized populations. Blood 74, 475–481 [PubMed] [Google Scholar]
- 37. Manodori A. B., Kuypers F. A. (2002) Altered red cell turnover in diabetic mice. J. Lab. Clin. Med. 140, 161–165 [DOI] [PubMed] [Google Scholar]
- 38. Orsomando G., Cialabrini L., Amici A., Mazzola F., Ruggieri S., Conforti L., Janeckova L., Coleman M. P., Magni G. (2012) Simultaneous single-sample determination of NMNAT isozyme activities in mouse tissues. PLoS One 7, e53271. [DOI] [PMC free article] [PubMed] [Google Scholar]
- 39. Beutler E., Blume K. G., Kaplan J. C., Löhr G. W., Ramot B., Valentine W. N. (1977) International Committee for Standardization in Haematology: recommended methods for red-cell enzyme analysis. Br. J. Haematol. 35, 331–340 [DOI] [PubMed] [Google Scholar]
- 40. Yamada K., Hara N., Shibata T., Osago H., Tsuchiya M. (2006) The simultaneous measurement of nicotinamide adenine dinucleotide and related compounds by liquid chromatography/electrospray ionization tandem mass spectrometry. Anal. Biochem. 352, 282–285 [DOI] [PubMed] [Google Scholar]
- 41. Darghouth D., Koehl B., Madalinski G., Heilier J. F., Bovee P., Xu Y., Olivier M. F., Bartolucci P., Benkerrou M., Pissard S., Colin Y., Galacteros F., Bosman G., Junot C., Roméo P. H. (2011) Pathophysiology of sickle cell disease is mirrored by the red blood cell metabolome. Blood 117, e57–66 [DOI] [PubMed] [Google Scholar]
- 42. Sporty J. L., Kabir M. M., Turteltaub K. W., Ognibene T., Lin S. J., Bench G. (2008) Single sample extraction protocol for the quantification of NAD and NADH redox states in Saccharomyces cerevisiae. J. Sep. Sci. 31, 3202–3211 [DOI] [PMC free article] [PubMed] [Google Scholar]
- 43. Yuan M., Breitkopf S. B., Yang X., Asara J. M. (2012) A positive/negative ion-switching, targeted mass spectrometry-based metabolomics platform for bodily fluids, cells, and fresh and fixed tissue. Nat. Protoc. 7, 872–881 [DOI] [PMC free article] [PubMed] [Google Scholar]
- 44. Felici R., Lapucci A., Ramazzotti M., Chiarugi A. (2013) Insight into molecular and functional properties of NMNAT3 reveals new hints of NAD homeostasis within human mitochondria. PLoS One 8, e76938. [DOI] [PMC free article] [PubMed] [Google Scholar]
- 45. van den Bos C., Kieboom D., Visser T. P., Wagemaker G. (1993) Compensatory splenic hemopoiesis in β-thalassemic mice. Exp. Hematol. 21, 350–353 [PubMed] [Google Scholar]
- 46. Loken M. R., Shah V. O., Dattilio K. L., Civin C. I. (1987) Flow cytometric analysis of human bone marrow: I. normal erythroid development. Blood 69, 255–263 [PubMed] [Google Scholar]
- 47. Stanton R. C. (2012) Glucose-6-phosphate dehydrogenase, NADPH, and cell survival. IUBMB Life 64, 362–369 [DOI] [PMC free article] [PubMed] [Google Scholar]
- 48. Liu J., Mohandas N., An X. (2011) Membrane assembly during erythropoiesis. Curr. Opin. Hematol. 18, 133–138 [DOI] [PubMed] [Google Scholar]
- 49. Climent F., Roset F., Repiso A., Pérez de la Ossa P. (2009) Red cell glycolytic enzyme disorders caused by mutations: an update. Cardiovasc. Hematol. Disord. Drug Targets 9, 95–106 [DOI] [PubMed] [Google Scholar]
- 50. Kanno H., Morimoto M., Fujii H., Tsujimura T., Asai H., Noguchi T., Kitamura Y., Miwa S. (1995) Primary structure of murine red blood cell-type pyruvate kinase (PK) and molecular characterization of PK deficiency identified in the CBA strain. Blood 86, 3205–3210 [PubMed] [Google Scholar]
- 51. Morimoto M., Kanno H., Asai H., Tsujimura T., Fujii H., Moriyama Y., Kasugai T., Hirono A., Ohba Y., Miwa S., Kitamura Y. (1995) Pyruvate kinase deficiency of mice associated with nonspherocytic hemolytic anemia and cure of the anemia by marrow transplantation without host irradiation. Blood 86, 4323–4330 [PubMed] [Google Scholar]
- 52. Aizawa S., Harada T., Kanbe E., Tsuboi I., Aisaki K., Fujii H., Kanno H. (2005) Ineffective erythropoiesis in mutant mice with deficient pyruvate kinase activity. Exp. Hematol. 33, 1292–1298 [DOI] [PubMed] [Google Scholar]
- 53. Miwa S., Kanno H., Fujii H. (1993) Concise review: pyruvate kinase deficiency: historical perspective and recent progress of molecular genetics. Am. J. Hematol. 42, 31–35 [DOI] [PubMed] [Google Scholar]
- 54. Roux-Dalvai F., Gonzalez de Peredo A., Simó C., Guerrier L., Bouyssié D., Zanella A., Citterio A., Burlet-Schiltz O., Boschetti E., Righetti P. G., Monsarrat B. (2008) Extensive analysis of the cytoplasmic proteome of human erythrocytes using the peptide ligand library technology and advanced mass spectrometry. Mol. Cell. Proteomics 7, 2254–2269 [DOI] [PubMed] [Google Scholar]
- 55. Kirtley M. E., McKay M. (1977) Fructose-1,6-bisphosphate, a regulator of metabolism. Mol. Cell. Biochem. 18, 141–149 [DOI] [PubMed] [Google Scholar]
- 56. Wagner G. R., Payne R. M. (2013) Widespread and enzyme-independent Nϵ-acetylation and Nϵ-succinylation of proteins in the chemical conditions of the mitochondrial matrix. J. Biol. Chem. 288, 29036–29045 [DOI] [PMC free article] [PubMed] [Google Scholar]
- 57. Pittman J. G., Martin D. B. (1966) Fatty acid biosynthesis in human erythrocytes: evidence in mature erythrocytes for an incomplete long chain fatty acid synthesizing system. J. Clin. Invest. 45, 165–172 [DOI] [PMC free article] [PubMed] [Google Scholar]
- 58. Tyan Y. C., Jong S. B., Liao J. D., Liao P. C., Yang M. H., Liu C. Y., Klauser R., Himmelhaus M., Grunze M. (2005) Proteomic profiling of erythrocyte proteins by proteolytic digestion chip and identification using two-dimensional electrospray ionization tandem mass spectrometry. J. Proteome Res. 4, 748–757 [DOI] [PubMed] [Google Scholar]
- 59. Stein L. R., Imai S. (2012) The dynamic regulation of NAD metabolism in mitochondria. Trends Endocrinol. Metab. 23, 420–428 [DOI] [PMC free article] [PubMed] [Google Scholar]
- 60. Dölle C., Rack J. G., Ziegler M. (2013) NAD and ADP-ribose metabolism in mitochondria. FEBS J. 280, 3530–3541 [DOI] [PubMed] [Google Scholar]
- 61. Haferkamp I., Schmitz-Esser S., Linka N., Urbany C., Collingro A., Wagner M., Horn M., Neuhaus H. E. (2004) A candidate NAD+ transporter in an intracellular bacterial symbiont related to Chlamydiae. Nature 432, 622–625 [DOI] [PubMed] [Google Scholar]
- 62. Palmieri F., Rieder B., Ventrella A., Blanco E., Do P. T., Nunes-Nesi A., Trauth A. U., Fiermonte G., Tjaden J., Agrimi G., Kirchberger S., Paradies E., Fernie A. R., Neuhaus H. E. (2009) Molecular identification and functional characterization of Arabidopsis thaliana mitochondrial and chloroplastic NAD+ carrier proteins. J. Biol. Chem. 284, 31249–31259 [DOI] [PMC free article] [PubMed] [Google Scholar]
- 63. Song E. K., Rah S. Y., Lee Y. R., Yoo C. H., Kim Y. R., Yeom J. H., Park K. H., Kim J. S., Kim U. H., Han M. K. (2011) Connexin-43 hemichannels mediate cyclic ADP-ribose generation and its Ca2+-mobilizing activity by NAD+/cyclic ADP-ribose transport. J. Biol. Chem. 286, 44480–44490 [DOI] [PMC free article] [PubMed] [Google Scholar]