Background: DHRS3 is thought to be important for retinoid metabolism but it is unclear whether it has significant retinaldehyde reductase activity.
Results: DHRS3 requires RDH10 for full enzymatic activity and, in turn, activates RDH10.
Conclusion: The mutually activating relationship allows for precise control over retinoic acid biosynthesis.
Significance: This is a previously unrecognized regulatory mechanism that may be conserved across species.
Keywords: Dehydrogenase, Metabolism, Reductase, Retinoid, Vitamin A
Abstract
The retinoic acid-inducible dehydrogenase reductase 3 (DHRS3) is thought to function as a retinaldehyde reductase that controls the levels of all-trans-retinaldehyde, the immediate precursor for bioactive all-trans-retinoic acid. However, the weak catalytic activity of DHRS3 and the lack of changes in retinaldehyde conversion to retinol and retinoic acid in the cells overexpressing DHRS3 undermine its role as a physiologically important all-trans-retinaldehyde reductase. This study demonstrates that DHRS3 requires the presence of retinol dehydrogenase 10 (RDH10) to display its full catalytic activity. The RDH10-activated DHRS3 acts as a robust high affinity all-trans-retinaldehyde-specific reductase that effectively converts retinaldehyde back to retinol, decreasing the rate of retinoic acid biosynthesis. In turn, the retinol dehydrogenase activity of RDH10 is reciprocally activated by DHRS3. At E13.5, DHRS3-null embryos have ∼4-fold lower levels of retinol and retinyl esters, but only slightly elevated levels of retinoic acid. The membrane-associated retinaldehyde reductase and retinol dehydrogenase activities are decreased by ∼4- and ∼2-fold, respectively, in Dhrs3−/− embryos, and Dhrs3−/− mouse embryonic fibroblasts exhibit reduced metabolism of both retinaldehyde and retinol. Neither RDH10 nor DHRS3 has to be itself catalytically active to activate each other. The transcripts encoding DHRS3 and RDH10 are co-localized at least in some tissues during development. The mutually activating interaction between the two related proteins may represent a highly sensitive and conserved mechanism for precise control over the rate of retinoic acid biosynthesis.
Introduction
All-trans-retinoic acid (atRA)2 is a bioactive derivative of vitamin A that is required for virtually all essential physiological processes and functions. Biological actions of atRA are exerted through its binding to cellular retinoic acid receptors (RAR α, β, and γ), which mediate the effects of atRA at both transcriptional and translational levels (reviewed in Ref. 1).
Numerous studies have demonstrated that the concentration of atRA during embryonic development is tightly controlled in a spatial and temporal manner (reviewed in Ref. 2). In adult tissues, it is maintained within a very narrow range that is specific for each given tissue. Although there has been significant progress in deciphering the molecular mechanisms that enable the maintenance of optimal atRA concentrations, some aspects of these mechanisms remain poorly understood.
For instance, it has been well established that the levels of atRA are controlled by the atRA-inducible CYP26 enzymes (CYP26A1, CYP26B1, and CYP26C1), which are primarily responsible for atRA degradation (reviewed in Refs. 3 and 4). The inducibility of CYP26 gene expression by atRA provides an effective mechanism that insures the concentration of atRA does not exceed certain levels (3). However, recent studies suggest that, in addition to CYP26-mediated control, the cells and tissues have a mechanism to prevent excessive amounts of atRA at the level of its biosynthesis (4).
AtRA is produced from cellular stores of all-trans-retinol in two oxidative steps: first, retinol is oxidized reversibly to retinaldehyde by retinol dehydrogenases (RDH), and then retinaldehyde is oxidized irreversibly to atRA by retinaldehyde dehydrogenases (RALDH1, -2, and -3) (4). The overall rate of atRA biosynthesis is determined by the first step: the oxidation of retinol to retinaldehyde (5). Studies in intact living cells indicate that there are two types of retinoid oxidoreductases present in the cells at the same time: one type (NAD+-preferring) oxidizes retinol to retinaldehyde, whereas the second type (NADPH-preferring), reduces retinaldehyde back to retinol (4). Together, these opposing activities appear to control the steady-state levels of retinaldehyde, the immediate precursor for atRA biosynthesis. The enzyme responsible for the conversion of retinol to retinaldehyde during embryogenesis has been identified as retinol dehydrogenase 10 (RDH10), a member of the short chain dehydrogenase/reductase (SDR) superfamily of proteins (6–8). On the other hand, the molecular identity of the retinaldehyde reductase acting in opposition to RDH10 is much less certain. The reduction of retinaldehyde back to retinol is catalyzed in vitro by several members of the SDR superfamily (4). One of these proteins, DHRS3 (also known as retSDR1), was shown to be inducible by atRA in human neuroblastoma cell lines, THP-1 monocytes, and rat liver (9, 10). Thus far, very little is known about the properties or the exact role of DHRS3 in retinoid homeostasis.
DHRS3 was originally identified at the level of cDNA in the expressed sequence database (EST) of GenBankTM as a photoreceptor visual cycle all-trans-retinol dehydrogenase based on its sequence similarity to previously cloned retinoid-active SDRs (11, 12). However, the mRNA encoding DHRS3 was found to be expressed in many human tissues, including adult heart, placenta, lung, liver, kidney, pancreas, thyroid, testis, stomach, trachea, and spinal cord, as well as fetal tissues such as kidney, liver, and lung (9, 11).
Initial assays of DHRS3 enzymatic activity using recombinant protein overexpressed in Sf9 insect cells suggested that this protein is capable of catalyzing the transfer of 3H from [3H]NADPH, but not from NADH, to 10 μm all-trans-retinaldehyde (11). The exact rate of DHRS3-catalyzed reaction was not reported but the retinaldehyde reductase activity of the enzyme appeared to be much lower than that of other SDRs with NADPH-dependent retinaldehyde reductase activity (13, 14). Furthermore, overexpression of DHRS3 in SK-N-AS neuroblastoma cells stimulated the accumulation of retinyl esters, but did not result in quantifiable changes in the conversion of retinol to retinaldehyde or atRA (9).
Nevertheless, a knockdown of dhrs3a gene expression in zebrafish embryos appeared to increase expression of the cyp26a1 gene and the RARE-GFP reporter construct in the spinal cord (15), suggesting that dhrs3a regulates atRA levels in vivo. However, in view of the seemingly negligible in vitro activity of DHRS3 toward retinaldehyde (11) and the lack of changes in the levels of retinaldehyde or retinol in cultured cells upon DHRS3 overexpression (9), the exact mechanism of DHRS3 action remains unclear. The present study was undertaken to resolve this issue.
EXPERIMENTAL PROCEDURES
Expression and Knockdown in Mammalian Cell Lines
Human DHRS3 was PCR-amplified from primary human keratinocytes (16) using primers 5′-AAA GAA TTC GAG GAT GGT GTG GAA ACG GCT GG-3′ (forward, EcoRI site underlined) and 5′-TTT GTC GAC TGT CCG CCC TTT GAA AGT GTT CA-3′ (reverse, SalI site underlined) and cloned into EcoRI-SalI sites of pCMV-Tag4a vector (Stratagene) in-frame with the C-terminal FLAG tag. For the untagged DHRS3 expression construct, the cDNA was amplified with 5′-GCG GAA TTC ATG GTG TGG AAA CGG C-3′ and 5′-ATC GGA TCC CTA TGT CCG CCC TTT GA-3′ primers and cloned into EcoRI-BamHI sites of pIRESneo vector (Clontech). Human RDH10 untagged construct in pCMV-Tag4a vector was described previously (17).
An Y188A substitution at the substrate binding site tyrosine was introduced using site-directed mutagenesis with primers 5′-GCC TGC ACA TCC AAA GCG TCA-3′ (forward, substitutions underlined) and 5′-GTC GAT GGC ACC GGG GAT GGC-3′ (reverse), Platinum Pfx DNA Polymerase (Invitrogen) and untagged human DHRS3/pIRESneo (used in all HEK293 transfections) or FLAG-tagged DHRS3/pCMV-Tag4a constructs (used for Sf9 cells) as templates. All constructs were verified by sequencing. To generate a catalytically inactive rescue construct, site-directed mutagenesis was performed using primers 5′-AAT AC CTT TAA AGG GCG GAC ATA GGG ATC-3′ and 5′-CAT ACA AGT ATA GGT TCC TGA GAA TTT GTG-3′ and the Y188ADHRS3/pIRESneo construct as a template. The primers introduced six silent nucleotide substitutions (underlined) into the DHRS3 coding sequence.
Transfections of HepG2 and HEK293 cells were carried out as described previously (17). For double-transfection experiments, empty vector was added to the controls transfected with only one expression construct to adjust the amount of DNA. The expression of endogenous human DHRS3 in HEK293 and HepG2 cells was knocked down by stably transfecting the cells with pLKO.1 vector carrying DHRS3 shRNA. Expression in insect Sf9 cells was done as described previously (18).
DHRS3 expression was silenced using pLKO.1 vector carrying DHRS3 shRNA as described in Ref. 17. The DNA oligonucleotide sequences encoding shRNA targeting DHRS3 were as follows: 5′-CCG GCA CCT GCA TGA ACA CTT TCA ACT CGA GTT GAA AGT GTT CAT GCA GGT GTT TTT G-3′ (forward) and 5′-AAT TCA AAA ACA CCT GCA TGA ACA CTT TCA ACT CGA GTT GAA AGT GTT CAT GCA GGT G-3′ (reverse). Stably transfected clones were expanded in the presence of puromycin (3 μg/ml).
Immunofluorescence and Confocal Microscopy
HEK293 cells were co-transfected with RDH10-HA and DHRS3-FLAG or RDH11-FLAG expressing constructs. One day after transfections, cells were seeded on poly-l-lysine-coated glass coverslips. Three days after transfections cells were fixed, permeabilized, and incubated with a mixture of mouse monoclonal HA antibody (kind gift from Dr. Hengbin Wang, University of Alabama at Birmingham) and rabbit polyclonal FLAG antibody (Sigma). The detection was performed with goat anti-rabbit FITC-conjugated antibody (FLAG tag) and goat anti-mouse Alexa Fluor 594-conjugated antibody (HA tag). Immunostained cells were analyzed using an Olympus BX61 motorized upright microscope fitted with a BX-DSU disc scan unit.
Expression in Insect Sf9 Cells
Wild type and Y188A DHRS3 cDNAs each fused to FLAG tag were PCR-amplified from the corresponding pCMV-Tag4a constructs with primers 5′-GCG GGA TCC ATG GTG TGG AAA CGG C-3′ and 5′-TAC TCT AGA CTA CTT ATC GTC GTC ATC-3′ and cloned into BamHI and XbaI sites of pVL1393 vector (BD Biosciences). To generate His-tagged DHRS3, the full-length cDNA was cloned into BamHI-NotI sites of pVL1393, which was previously modified to encode a C-terminal His6 tag (13).
To generate HA-tagged RDH10 protein, RDH10 cDNA was PCR-amplified with primers 5′-CCG GAA TTC ACC ATG AAC ATC GTG GTG GAG TTC TTC-3′ and 5′-AGA CTC GAG GAT TCC ATT TTT TGC TTC ATT ATT GT-3′ (restriction sites underlined) and cloned into EcoRI/XhoI sites of pIREShrGFP-2a vector (Stratagene) in-frame with the C-terminal 3xHA tag. From this vector, RDH10 cDNA including the HA sequence was PCR amplified with primers 5′-CCG GAA TTC ACC ATG AAC ATC GTG GTG GAG TTC TTC-3′ and 5′-AAA CTG CAG AGC GTA GTC AGG TAC ATC G-3′ and cloned into EcoRI and PstI sites of pVL1393 for expression in Sf9 cells.
The vector for expression of RDH10 in Sf9 cells was described previously (17). Co-transfection of Sf9 insect cells with the transfer plasmid and BaculoGold-linearized baculovirus DNA (BD Biosciences), generation of recombinant baculovirus, and protein expression in Sf9 cells were performed as described in Ref. 18.
Generation and Maintenance of Dhrs3+/− Mice
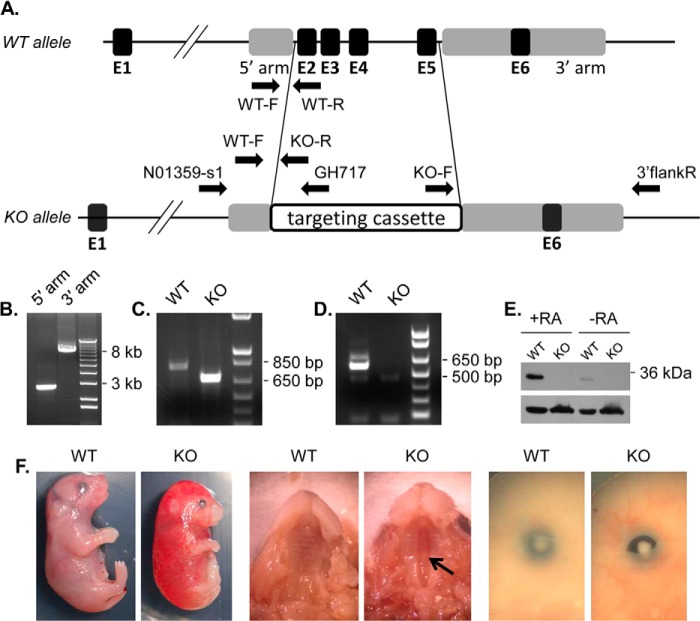
C57BL/6N C2 ES cells carrying targeted knock-out allele Dhrs3tm1(NCOM)Mfgc were obtained from the Canadian Mutant Mouse Repository. The targeting vector was generated by NorCOMM (design N01359, Sanger design ID 232990). Targeted insertion of the NorCOMM L1L2_GOHANU cassette results in deletion of amino acids 66–275 including the active site Tyr-188 in exon 4 (see Fig. 7A). The correct insertion of the cassette in ES cells was verified by long range PCR (see Fig. 7B) for 5′ and 3′ homology arms using the SequalPrep Long PCR kit (Invitrogen) and NorCOMM primers N01359-s1 and GH717 for the 5′ homology arm; and primers KO-F and 3′flankR for 3′ homology arm (see Fig. 7A).
FIGURE 7.
Generation of Dhrs3−/− mice. A, a diagram showing the wild-type (WT) and knock-out (KO) Dhrs3 alleles. Exons (black boxes) are labeled E1 through E6. Targeting homology is represented by gray boxes. In the KO allele, a 6001-bp fragment, which contains coding exons E2–E5, is substituted with the 8540-bp NorCOMM targeting cassette. Arrows indicate the location and orientation of genotyping primers (WT-F, WT-R, and KO-R), and long range PCR primers (N01359-s1, GH717, KO-F, and 3′flankR). B, long range PCR amplification of the 5′ homology arm (expected size 2671 bp) and 3′ homology arm (expected size 7892 bp). C, PCR analysis of WT (primers WT-F and WT-R, product 816 bp) and KO (primers WT-F and KO-R, product 682 bp) mouse tail genomic DNA. D, RT-PCR analysis of exons 2–5 (product 587 bp) using primers mDHRS3ex2F and mDHRS3ex5R. E, Western blot analysis of E14.5 WT and KO MEFs (15 μg of 10,000 × g fraction) treated with 200 nm atRA or vehicle for 12 h using DHRS3 ProteinTech antibody or β-actin antibody (lower). F, external views of E18.5 mouse embryos. Arrow indicates clefting of the secondary palate.
Chimeras were generated by the University of Alabama Transgenic Mouse facility. Germline passage was obtained by crossing chimeric males to albino C57BL/6 females. Genotyping was performed by PCR with TaqDNA polymerase (New England Biolabs) using forward primer WT-F and reverse primer WT-R for the wild type allele (product size 816 bp) or KO-R for the knock-out allele (product size 682 bp) (see Fig. 7A). The deletion of exons 2 through 5 was confirmed by RT-PCR using primers flanking exon 2 (mDHRS3ex2F) and exon 5 (mDHRS3ex5R). Sequences of primers are available upon request.
Mice were maintained on a diet containing 4 IU of vitamin A/g (19) from Research Diets (Brunswick, NJ) in a facility approved by the Association for Assessment and Accreditation of Laboratory Animal Care, in accordance with Institutional Animal Care and Use Committee guidelines at the University of Alabama at Birmingham. At noon of the day, a vaginal plug was taken as embryonic day 0.5 (E0.5). Embryos and fetuses were collected by caesarean section, and the yolk sacs were taken for DNA extraction. The protocols used were approved and conducted according to the University of Alabama at Birmingham IACUC.
DHRS3 Antibody Generation, Western Blot Analysis, and Quantitative PCR (qPCR)
Rabbit polyclonal antiserum generated against amino acids 70–261 of mouse DHRS3 Western blot analysis of E14.5 mouse embryonic fibroblasts (MEFs) treated with 200 nm atRA or vehicle was carried out as described before (16). Rabbit polyclonal antibodies against human DHRS3 (Proteintech), His6 tag mouse monoclonal antibodies (Clontech, BD Biosciences), FLAG antibodies (Sigma), and rabbit anti-mouse RDH10 polyclonal antiserum were all used at a 1:2,000 dilution. Gel loading was determined by reprobing with β-actin antibody (1:2,000 dilution, Abcam).
Reverse transcription and qPCR were performed as described previously (16). Sequences of the primers are available upon request.
Double in Situ Hybridization
The probes for whole mount double in situ hybridization were generated from the full-length cDNAs encoding mouse DHRS3, RDH10, and RALDH2 cloned into pBluescript II SK(−) vector. The antisense and sense probes were transcribed in vitro from the linearized template using T3 or T7 RNA polymerase (Promega) and digoxigenin or fluorescein RNA labeling mixture (Roche Applied Science) according to the manufacturer's protocols. Double in situ hybridization was performed according to published protocols (20, 21).
Analysis of Tissue Retinoids and Activity Assays
Retinoids were extracted from whole mouse E13.5 embryos as described in Ref. 22. Retinol and retinyl esters were separated by reversed-phase HPLC on a SUPELCOSILTM SuplexTM pKb-100 column (Sigma) as a stationary phase, and a mobile phase consisting of a gradient of solvents A (acetonitrile, 2% ammonium acetate, glacial acetic acid, methanol at 79:16:3:2) and B (acetonitrile/dichloromethane at 90:10) as follows: 0–24 min at 100% A, 25–54 min at 100% B, 55–60 min at 100% B. For separation by normal phase HPLC, the mobile phase was hexane/ethyl acetate/acetic acid (95:4.975:0.025, v/v/v) at a flow rate of 0.7 ml/min. The stationary phase was a Waters Spherisorb S3W column (4.6 × 100 mm). Retinoids were quantified by comparing their peak areas to a calibration curve constructed from peak areas of a series of standards. LC/MS-MRM analysis was performed as described previously (16). The concentration of atRA was calculated based on the average values obtained for m/z 159, 123, and 81 fragments.
Activity assays with microsomes of Sf9 cells and kinetic analysis were performed as described (17). The reaction products were separated by HPLC as described above except the mobile phase was hexane/ethyl acetate/acetic acid (90:9.95:0.05, v/v/v). The apparent Km values for the reduction of all-trans-retinaldehyde were determined at 1 mm NADPH or NADH and seven concentrations of all-trans-retinaldehyde (0.0625–8 μm). The apparent Km values for the oxidation of all-trans-retinol were determined at 1 mm NADP+ or NAD+ and nine concentrations of all-trans-retinol (0.0625–8 μm). The apparent Km values for cofactors were determined at 5 μm all-trans-retinaldehyde or all-trans-retinol and seven to nine concentrations of one of the following cofactors: NADPH (1–500 μm), NADP+ (1–500 μm), NADH (1–500 μm), or NAD+ (1–500 μm). Initial velocities (nmol/min of product formed per mg of protein) were obtained by nonlinear regression analysis.
Statistical Analyses
Unpaired t test was used to test for statistical significance. qPCR data are presented as the mean ± S.E. Kinetic constants were calculated using GraFit (Erithacus Software Ltd., UK) and expressed as the mean ± S.D.
RESULTS
DHRS3 Requires the Presence of RDH10 to Display Its Retinaldehyde Reductase Activity
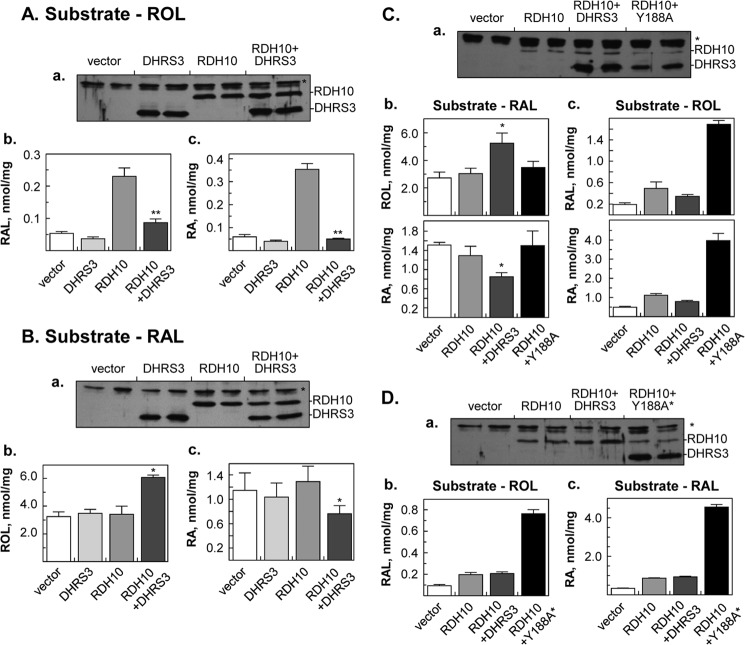
Similar to the previous report (9), overexpression of human DHRS3 in HEK293 cells resulted in small if any changes in the rate of retinol conversion to retinaldehyde or atRA (see Fig. 2A, DHRS3 bar) and no changes in the rate of retinaldehyde reduction back to retinol (see Fig. 2B, DHRS3 bar). The same result was obtained for DHRS3 overexpression in HepG2 cells (data not shown).
FIGURE 2.
Co-expression of DHRS3 or Y188A DHRS3 with RDH10 in HEK293 cells. A, effect of DHRS3 on metabolism of retinol. B, effect of DHRS3 on metabolism of retinaldehyde. C, activation of RDH10 by Y188A DHRS3 mutant. D, effect of Y188A* rescue construct. A–D, a, Western blot analyses of cell homogenates (50 μg); *, a nonspecific band recognized by RDH10 rabbit polyclonal antiserum. Y188A* stands for rescue construct encoding the Y188A mutant of DHRS3. Note similar expression levels of DHRS3 and RDH10 transfected individually and in combination. Ab, Ac, Bb, Bc, Cb, Cc, Db, and Dc, normal phase HPLC analysis of retinaldehyde (RAL), retinol (ROL), and retinoic acid (RA). Cells were incubated with 2 μm retinol for 9 h (A and B), 10 μm retinol for 10 h (C and D) or 5 μm retinaldehyde for 3 h (A-C). A, b and c, **, p < 0.001 for RDH10 versus RDH10 + DHRS3 cells. B, b and c, *, p ≤ 0.03 for RDH10 versus RDH10 + DHRS3 cells. C, b, *, p ≤ 0.03 for RDH10 + DHRS3 versus RDH10 or empty vector. C, c, ***, p ≤ 0.0001 for RDH10 + DHRS3 versus RDH10 + Y188A. The Y188A DHRS3 does not increase the production of retinol, indicating that it lacks the retinaldehyde reductase activity, but at the same time it activates the conversion of retinol to RAL and RA catalyzed by RDH10. D, note that WT DHRS3 co-transfected with RDH10 has no effect on retinoid metabolism in these DHRS3-silenced cells because its transcript is degraded by stably transfected shRNA. All experiments were performed in triplicates.
In contrast, silencing of endogenous DHRS3 expression in human HepG2 cells, as confirmed by immunoblotting (Fig. 1A), resulted in a 1.5–2-fold increase in production of retinaldehyde and atRA from retinol compared with control cells (Fig. 1B). Real-time qPCR analysis revealed that at least five atRA target genes were up-regulated 6–48-fold in DHRS3-silenced cells (Fig. 1C). These results suggested that the endogenously expressed DHRS3 is able to control the levels of both retinaldehyde and transcriptionally active atRA in living cells, whereas the ectopically expressed DHRS3 was essentially inactive.
FIGURE 1.
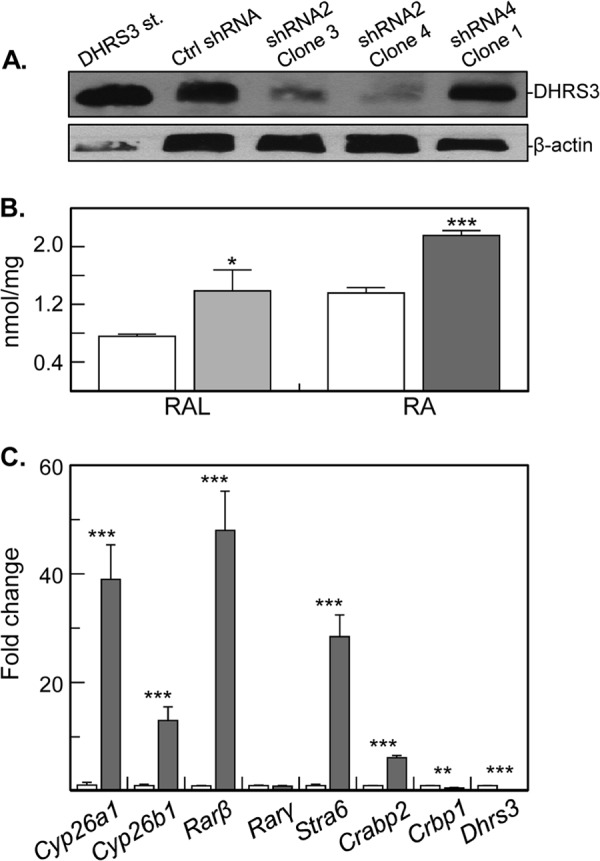
Silencing of human DHRS3 expression. A, Western blot analysis of HepG2 cells stably transfected with scrambled shRNA (Ctrl), DHRS3 shRNA 2 (clones 3 and 4), or DHRS3 shRNA4 (clone 1). Note the reduced levels of DHRS3 protein in two separate clones transfected with shRNA2, but not shRNA4. B, normal phase HPLC analysis of retinol (10 μm, overnight) metabolism to retinaldehyde (RAL) and atRA (RA) in DHRS3-silenced (shRNA2 clone 4, gray bars) versus control HepG2 cells (white bars). The results are representative of three independent experiments: *, p < 0.02. C, qPCR analysis of gene expression in DHRS3-silenced HepG2 cells (gray bars) versus control cells (white bars). ***, p < 0.001, mean ± S.E., n = 3. Two independent clones, 3 and 4, showed similar results.
DHRS3 gene expression is inducible by atRA (9, 10), hence the function of DHRS3 appears to be necessary at elevated levels of atRA. To create elevated levels of atRA, we co-expressed DHRS3 with RDH10 (Fig. 2). The protein levels of DHRS3 and RDH10 expressed separately (controls) and in combination were similar (Fig. 2, A and B, panels a). However, the cells co-expressing DHRS3 with RDH10 produced significantly less (>2-fold) retinaldehyde and atRA from the added retinol than the cells expressing RDH10 alone (Fig. 2A, b and c). Thus, when co-expressed with RDH10, DHRS3 was able to decrease the amount of retinaldehyde synthesized by RDH10.
To determine whether DHRS3 acted as a retinaldehyde reductase, we examined the conversion of retinaldehyde to retinol. Indeed, as shown in Fig. 2B, b and c, there was a ∼1.5-fold increase in the amount of retinol and a concomitant decrease in the amount of atRA produced from retinaldehyde, but only in the cells co-expressing DHRS3 with RDH10. Because in intact cells the NAD+-preferring RDH10 does not convert retinaldehyde to retinol (17), the reductive activity could have come only from DHRS3 co-expressed with RDH10. This experiment demonstrated that when DHRS3 is co-expressed with RDH10 in intact cells, DHRS3 converts retinaldehyde to retinol at a much higher rate than DHRS3 overexpressed alone, suggesting that RDH10 activates DHRS3. Interestingly, the retinaldehyde reductive activity of DHRS3 co-expressed with RDH10 was not detectable below 1 μm retinaldehyde, indicating that the exogenously added retinaldehyde may not be as effective at reaching the active site of DHRS3 as the retinaldehyde produced by RDH10.
To obtain the ultimate proof that DHRS3 itself acts as an enzyme and not by inhibiting the activity of RDH10, we generated a catalytically inactive mutant of DHRS3. The DHRS3 active site Tyr residue (Tyr-188) located in the highly conserved SDR active site consensus sequence (YXXXK) was identified based on DHRS3 protein sequence alignment with other SDRs (23). The active site Tyr was substituted for Ala (Y188A) by site-directed mutagenesis, and the Y188A mutant of DHRS3 was co-expressed with RDH10 in HEK293 cells. As shown in Fig. 2C, a, the Y188A variant was expressed at slightly lower levels than WT DHRS3. As before, WT DHRS3 co-expressed with RDH10 effectively converted retinaldehyde to retinol and decreased the production of atRA. In contrast, the Y188A variant co-expressed with RDH10 had no effect on the conversion of retinaldehyde (Fig. 2C, b), confirming that, indeed, the effect of WT DHRS3 on retinaldehyde metabolism was due to its enzymatic activity as a retinaldehyde reductase, which required an intact catalytic site, and not because of its inhibition of RDH10 activity.
A surprising result was obtained when the cells co-expressing the Y188A variant and RDH10 were incubated with retinol as substrate (Fig. 2C, c). The amount of retinaldehyde and atRA produced from retinol in these cells was actually ∼4-fold higher than in cells transfected with RDH10 alone. Thus, whereas inactive as a retinaldehyde reductase, the Y188A mutant of DHRS3 appeared to potentiate the retinol oxidizing activity of RDH10.
To test whether this effect of the Y188A mutant was caused by its dimerization with native DHRS3 present in the cells and dominant-negative inhibition of native DHRS3 activity, we utilized HEK293 cells stably transfected with DHRS3 shRNA. Western blot analysis confirmed that the WT DHRS3 transfected into these cells was successfully silenced by the shRNA, so that DHRS3 was undetectable (Fig. 2D, a, RDH10+DHRS3). To prevent silencing, the “rescue” cDNA encoding Y188A DHRS3 was altered by introducing silent substitutions that did not change the encoded protein sequence (Fig. 2D, a, RDH10+Y188A*). As shown in Fig. 2D, b and c, WT DHRS3 co-expressed with RDH10 had no effect on retinol conversion in DHRS3-silenced cells, because the ectopically expressed DHRS3 was degraded by shRNA. However, the rescue Y188A DHRS3 retained its potentiating effect on RDH10 activity. These results suggested that the Y188A mutant activates RDH10 not by inhibiting the endogenous DHRS3 through dominant-negative dimerization, but by directly interacting with RDH10.
DHRS3 and RDH10 Proteins Co-localize When Expressed in HEK293 Cells
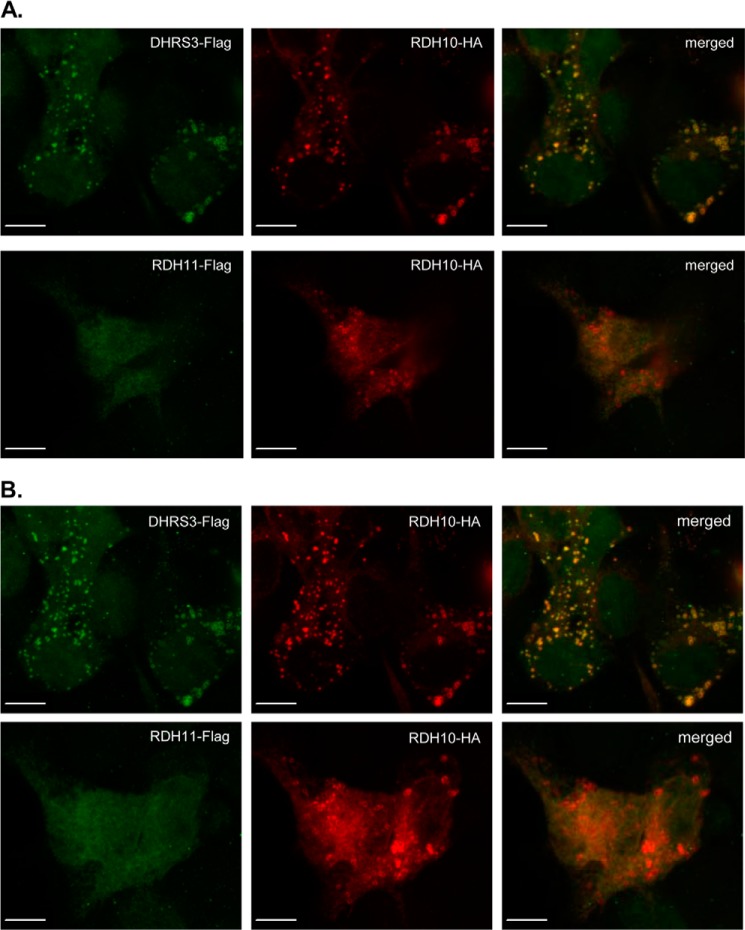
To determine subcellular localization of DHRS3 versus RDH10, we applied confocal fluorescence microscopy to HEK293 cells co-transfected with DHRS3-FLAG and RDH10-HA constructs. The two proteins exhibited a similar expression pattern, with the most intense immunostaining localized in ring structures (Fig. 3). This expression pattern was described previously for the mouse RDH10 fused to green fluorescent protein (GFP) and overexpressed in COS7 cells (24), and for human DHRS3-GFP overexpressed in U2OS cells as well as for endogenous DHRS3 in HepG2 cells (25). The expression pattern of RDH10 and DHRS3 was compared with that of another membrane-bound SDR protein with a known retinaldehyde reductase activity, RDH11 (13). In contrast to DHRS3, RDH11-FLAG did not co-localize with RDH10-HA in ring structures but was evenly distributed throughout the cytoplasm in a pattern consistent with localization in the endoplasmic reticulum (Fig. 3). Thus, RDH10 co-localized with DHRS3, but not with RDH11.
FIGURE 3.
Subcellular localization of DHRS3 and RDH10 proteins. HEK293 cells were co-transfected with constructs encoding DHRS3-FLAG and RDH10-HA (upper panels in A and B) or with RDH11-FLAG and RDH10-HA (lower panels in A and B). Localization of the proteins was detected by immunofluorescence and analyzed by confocal microscopy. Both a single z-slice (A) and the composite z-stack (B) are shown. Scale bar, 10 μm. Note the colocalization of RDH10 with DHRS3 (yellow ring structures), but not with RDH11.
As an additional control, we tested whether the tagged DHRS3 and RDH10 exhibited similar activities as the untagged proteins. Indeed, expression of RDH10-HA in HEK293 cells resulted in a 2.6-fold increase in atRA production from 2 μm retinol (0.18 ± 0.02 nmol/mg) compared with empty vector-transfected cells, indicating that RDH10-HA is catalytically active. Co-transfection of RDH10-HA with DHRS3-FLAG decreased the atRA biosynthesis to 0.07 ± 0.01 nmol/mg, consistent with the activation of DHRS3-FLAG by RDH10-HA. With 5 μm retinaldehyde as substrate, cells co-transfected with RDH10-HA and DHRS3-FLAG produced 1.7-fold more retinol (7.0 ± 0.5 nmol/mg) and 2-fold less atRA (1.3 ± 0.1 nmol/mg) than cells expressing DHRS3-FLAG alone, providing further proof for the activation of DHRS3-FLAG by RDH10-HA. These assays confirmed that the fusion proteins used in this study acted similarly to unmodified proteins.
The Interaction between DHRS3 and RDH10 Is Mutually Activating
Interpretation of the results obtained using intact living eukaryotic cells is complicated by the presence of endogenously expressed RDH10 and DHRS3 as well as other components of retinoid metabolic machinery, which may impact the outcome. To simplify the experimental conditions and determine whether RDH10 directly activates DHRS3, we expressed DHRS3 alone or in combination with RDH10 in insect Sf9 cells using the Baculovirus expression system and isolated the microsomal fractions for activity assays and kinetic analysis. The amount of DHRS3 protein in microsomes from cells co-infected with RDH10 baculovirus was lower than in microsomes from the DHRS3-only cells, but RDH10 was expressed at similar levels (Fig. 4A, upper panel).
FIGURE 4.
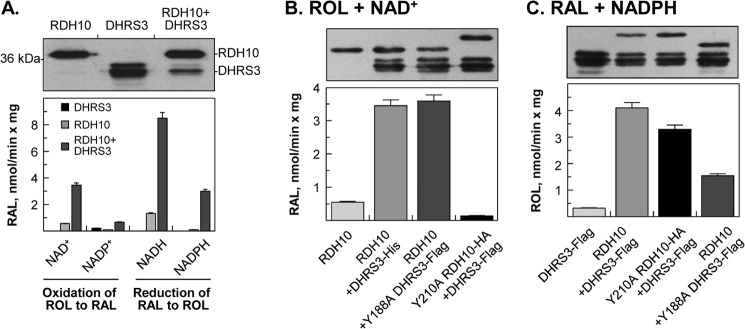
Co-expression of WT or mutant DHRS3 and RDH10 in Sf9 cells. A, DHRS3 + RDH10 microsomes. B, RDH10 + Y188A DHRS3 or Y210RDH10 + DHRS3 microsomes incubated with 2 μm retinol (ROL) and 1 mm NAD+. C, RDH10 + Y188A DHRS3 or Y210RDH10 + DHRS3 microsomes incubated with 2 μm retinaldehyde (RAL) and NADPH. A-C (top panels), Western blot analyses of Sf9 microsomes (3–5 μg). In Sf9 cells DHRS3 protein appears as three bands when probed with either ProteinTech antibodies or our custom-made DHRS3 antibodies. HA-tagged Y210A RDH10-HA runs higher than RDH10. The His6-tagged DHRS3 and FLAG-tagged DHRS3 have similar molecular weight. B and C, bottom panels, reaction rates for microsomes (2 μg each). The results are representative of several measurements using the same preparation of microsomes. Note that both the oxidative and reductive activities are significantly higher for microsomes containing RDH10 + DHRS3. The results demonstrate that DHRS3 itself does not utilize NAD+ as a cofactor but its WT and mutant forms both activate the NAD+-dependent retinol dehydrogenase activity of RDH10, whereas WT and mutant RDH10 both activate the retinaldehyde reductase activity of DHRS3.
Activity assays showed that DHRS3-only microsomes did not exhibit any significant retinoid activity under any assay conditions (Fig. 4A, lower panel, and supplemental Table S1). The slight increase in the oxidation of retinol to retinaldehyde observed in the presence of NADP+ was due to the endogenous activity of WT microsomes, because similar values were obtained with DHRS3-microsomes versus uninfected microsomes. In contrast, DHRS3 + RDH10 microsomes exhibited significant oxidative (retinol/NADP+) and reductive (retinaldehyde/NADPH) activity. As shown in Fig. 4A, RDH10 could not be responsible for this activity because it was not active with NADP+ or NADPH as cofactors. Thus, the observed NADP(H)-dependent retinoid activity was due to activation of DHRS3 in the presence of RDH10.
Surprisingly, DHRS3 + RDH10 microsomes also exhibited a much higher activity than RDH10-only microsomes with NAD+ and NADH as cofactors. This observation suggested that either DHRS3 can utilize both phosphorylated and non-phosphorylated nicotinamide adenine dinucleotides as cofactors or that DHRS3 reciprocally activates RDH10.
To distinguish between these two possibilities, we generated a catalytically inactive mutant of RDH10 by substituting the active site catalytic Tyr-210 for Ala (Fig. 4B). Activity assays of microsomal fractions showed that the Y210A RDH10 + DHRS3 microsomes were essentially inactive with retinol/NAD+, indicating that all of the NAD+-dependent retinol dehydrogenase activity came from RDH10. Remarkably, the activity of RDH10 was ∼3-fold higher in the presence of either WT or Y188A mutant of DHRS3 (Fig. 4B and supplemental Table S2), demonstrating that both WT and mutant DHRS3 stimulate the RDH10 activity.
In turn, the NADP(H)-dependent activity of DHRS3 was stimulated by either WT or Y210A mutant of RDH10 (Fig. 4C and supplemental Table S2). Unexpectedly, the Y188A + RDH10 microsomes still had some residual activity toward retinaldehyde. The reason for this observation is unclear at this time. Perhaps, the mutation of Tyr-188 did not fully inactivate DHRS3, and its activity was further enhanced by RDH10. Alternatively, the low activity of RDH10 with NADPH might have been enhanced by its interaction with Y188A DHRS3.
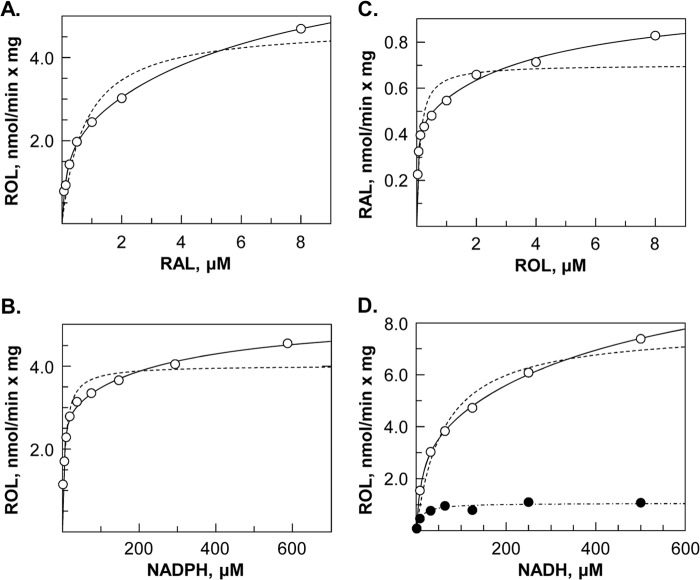
To determine the catalytic parameters of DHRS3, we carried out kinetic analysis of RDH10-activated DHRS3 (Fig. 5). As an additional control, we included kinetic analysis of microsomes containing each protein separately (DHRS3-only and RDH10-only microsomes) and a mixture of such microsomes. These assays showed that the addition of RDH10-only microsomes to DHRS3-only microsomes did not result in activation of DHRS3 (Fig. 5A). Similarly, RDH10 was not activated by the addition of DHRS3-only microsomes (data not shown), indicating that the two proteins must be co-expressed in the same membrane to exhibit the activating effect.
FIGURE 5.
Kinetic analysis of DHRS3 + RDH10 microsomes. DHRS3 + RDH10 microsomes were incubated with 1 mm NADPH and varied concentrations of retinaldehyde (RAL) (A); with retinaldehyde (5 μm) and varied concentrations of NADPH (B) or NADH (D); or with 1 mm NADP+ and varied concentrations of retinol (ROL) (C). Open circles represent data points obtained with DHRS3 + RDH10 microsomes. Closed circles in A represent RDH10-only microsomes; open squares, DHRS3-only microsomes; closed squares, RDH10-only microsomes plus DHRS3-only microsomes. The amount of microsomal protein in each reaction was equalized by adding microsomes from uninfected Sf9 cells. Note that simple mixing of microsomes containing each protein separately does not lead to activation of DHRS3. Closed circles in D represent data points for RDH10-only microsomes. The kinetic data were fitted to one-enzyme (dashed lines) or two-enzyme (solid lines) models. The difference in the Vmax values between RDH10 microsomes and DHRS3 + RDH10 microsomes is consistent with the activation of RDH10 by DHRS3.
The kinetic data obtained for co-expressed DHRS3 and RDH10 were fitted to one-enzyme or two-enzyme models. The best fit was achieved by fitting the data to a two-enzyme model as judged by the smallest χ2 values (Fig. 5). Accordingly, this fitting produced 2 sets of constants (Table 1). Considering that RDH10 alone has little or no activity in the presence of NADP+ or NADPH, the constants obtained with these cofactors likely represent two different forms of DHRS3, potentially a heterodimer and a heterotetramer with RDH10. One of these forms exhibited a robust retinaldehyde reductase activity (2–3 nmol/min × mg) with high affinity for retinaldehyde (Km = 0.15 μm) and NADPH (Km = 2.6 μm) (Table 1, Fig. 5, A and B). The second form exhibited lower affinity for retinaldehyde and NADPH.
TABLE 1.
Kinetic constants of human DHRS3 + RDH10 versus RDH10 alone
Kinetic constants were determined using the same preparation of microsomes containing DHRS3 + RDH10, except for NADP+ Km value, which was obtained using a different preparation of microsomes. All kinetic measurements were repeated at least 3 times.
| Substrate/cofactor | Apparent Km | Apparent Vmax |
|---|---|---|
| μm | nmol min−1mg−1 | |
| DHRS3 + RDH10 | ||
| NADPH | 2.6 ± 0.8 | 2.9 ± 0.3 |
| 280 ± 230 | 2.3 ± 0.5 | |
| NADP+ | 7.8 ± 1.5 | 3.5 ± 0.3 |
| 740 ± 770 | 0.9 ± 0.4 | |
| NADH | 12 ± 4 | 3.5 ± 0.7 |
| 470 ± 280 | 7.8 ± 1.4 | |
| All-trans-retinaldehyde + NADPH | 0.15 ± 0.06 | 2.1 ± 0.5 |
| 6.8 ± 4.9 | 4.9 ± 0.9 | |
| All-trans-retinol + NADP+ | 0.029 ± 0.006 | 0.45 ± 0.03 |
| 3.9 ± 1.5 | 0.55 ± 0.06 | |
| All-trans-retinaldehyde + NADH | 0.24 ± 0.67 | 1.7 ± 4.4 |
| 3.2 ± 2.3 | 17 ± 3 | |
| 11-cis-retinaldehyde | NDa | |
| RDH10 | ||
| NADH | 11 ± 4 | 1.1 ± 0.1 |
| All-trans-retinol + NAD+ | 0.039 ± 0.013 | 0.55 ± 0.03 |
| All-trans-retinaldehyde + NADH | 0.46 ± 0.06 | 1.7 ± 0.1 |
| 11-cis-retinolb | 0.06 ± 0.01 | 1.42 ± 0.06 |
a ND, not detectable.
b Data from Ref. 17. The two sets of numbers represent two different forms of DHRS3 (in case of NADP(H) as cofactor) or two different forms of RDH10 (in case of NAD(H) as cofactor): one with higher affinities for retinoid substrates and cofactors, and the other, with lower affinities.
Similar to other SDRs, the RDH10-activated DHRS3 acted as a bi-directional oxidoreductase in vitro, catalyzing the oxidation of retinol to retinaldehyde when given NADP+ (Fig. 5C). With NADH as cofactor, the retinaldehyde reductase activity of DHRS3 + RDH10 microsomes was severalfold higher than the activity of RDH10-only microsomes (Fig. 5D), providing further proof of the DHRS3-mediated activation of RDH10, which as a reversible oxidoreductase (17), can catalyze the reduction of retinaldehyde in vitro when given retinaldehyde and NADH. The activity of RDH10 was stable, but the RDH10-activated DHRS3 appeared to be labile: the reaction rate decreased over time when microsomes were stored frozen. Unlike RDH10, which was active with 11-cis-retinol (17), DHRS3 did not recognize 11-cis-retinaldehyde as substrate (Table 1).
Because DHRS3 does not utilize NAD+ or NADH as cofactors, the activities measured for DHRS3 + RDH10 microsomes with NAD(H) likely correspond to two different forms of RDH10. Comparison of the data obtained for DHRS3 + RDH10 microsomes in the presence of NADH with the single-enzyme Michaelis-Menten kinetics of RDH10 alone (Fig. 5D, closed circles, and Table 1) suggests that the high-affinity kinetic constants for retinaldehyde (Km = 0.24 μm) and NADH (Km = 12 μm) correspond to RDH10 alone, whereas the second set of constants may correspond to RDH10 + DHRS3. Thus, kinetic analysis indicated that: 1) DHRS3 requires the presence of RDH10 for realizing its full enzymatic potential; 2) DHRS3 prefers NADP(H) as cofactor; 3) DHRS3 recognizes all-trans- but not 11-cis-retinaldehyde as substrate; and DHRS3 activates RDH10.
Dhrs3 and Rdh10 Transcripts Are Co-localized in Mouse Limb Buds
To determine whether DHRS3 is present in the same tissues as RDH10, we examined the expression pattern of transcripts encoding these two proteins relative to other retinoid-metabolizing enzymes using the double whole mount in situ hybridization technique. This analysis revealed that in the interdigital areas of E13.5 hindlimbs, the Dhrs3 transcript was almost precisely co-localized with Rdh10 transcript, and it was mostly excluded from the areas of Cyp26b1 expression (Fig. 6). The same was true for hindlimbs and forelimbs throughout E12.5–E14.5 developmental stages (data not shown). Raldh2 expression area appeared to be wider than that of Dhrs3/Rdh10, extending beyond the Dhrs3/Rdh10 expression boundaries. Thus, the spatial localization of Dhrs3 and Rdh10 transcripts is consistent with the possibility that the two proteins physically interact and influence each other's activity.
FIGURE 6.
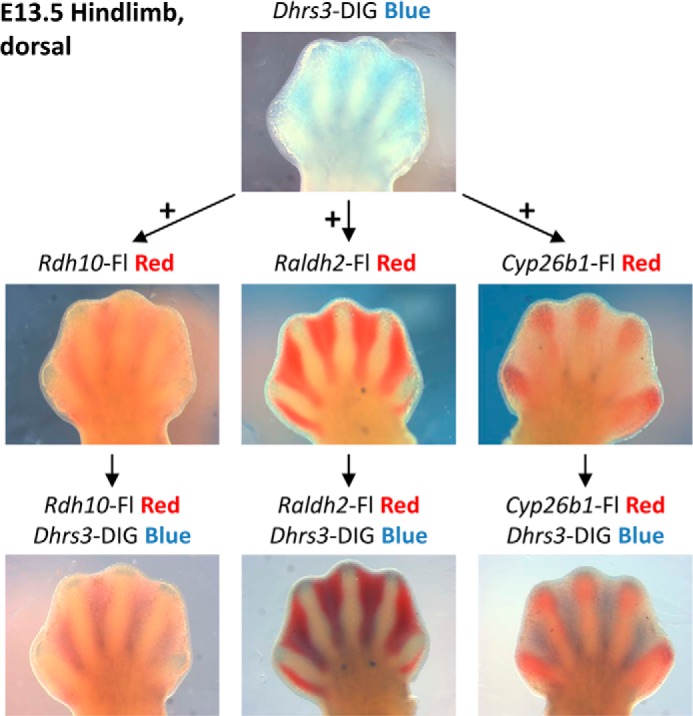
Expression pattern of Dhrs3 relative to other retinoid genes in E13.5 mouse hindlimb buds. Top panel, autopods were incubated in digoxigenin-labeled antisense Dhrs3 riboprobe and developed using nitro blue tetrazolium/5-bromo-4-chloro-3-indolyl phosphate. Dhrs3 mRNA localizes to interdigital tissue. Middle and bottom panels, autopods were incubated in fluorescein-labeled antisense Rdh10, Raldh2, or Cyp26b1 riboprobes and developed using Vector Red substrate. Autopods were further probed with digoxigenin-labeled antisense Dhrs3 riboprobe and developed using nitro blue tetrazolium/5-bromo-4-chloro-3-indolyl phosphate. Purple hue indicates colocalization of transcripts. Note the overlapping expression domains of Dhrs3 with those of Rdh10 and Raldh2.
DHRS3-null Mice Have Depleted Stores of Retinol and Retinyl Esters
To determine whether DHRS3 has an impact on the retinoid metabolism in vivo, we generated a mouse model with targeted deletion of Dhrs3 exons 2–5 (Fig. 7A) using the ES cells available from the Canadian Mutant Mouse Repository. Correct insertion of the targeting cassette was verified by long range PCR spanning 5′ and 3′ homology arms (Fig. 7B). The deletion of exons 2–5 was further confirmed by genotyping (Fig. 7C), and by RT-PCR amplification of the mRNA fragment corresponding to exons 2–5 (Fig. 7D). The absence of DHRS3 protein in Dhrs3−/− mice was demonstrated by Western blot analysis of E14.5 MEFs. The intensity of the protein band recognized by DHRS3 antibodies was increased in MEFs treated with atRA, providing further proof of its identity (Fig. 7E).
Dhrs3+/− mutants obtained from crossing the chimeric males with WT females were fully viable and fertile. However, live born Dhrs3−/− mutants were recovered at a low frequency (2/92) and died within 15 min of birth. To determine when the Dhrs3 mutation becomes lethal, Dhrs3−/− embryos were collected at various stages and yolk sac DNA was genotyped (Fig. 7C). At E18.5, Dhrs3−/− embryos were still alive and obtained in close to expected frequencies (6/17), but the null mutants had a noticeably different appearance compared with their WT littermates, with smaller eyes, unfused eyelids, and a very prominent and consistent cleft palate (Fig. 7F). Some E18.5 Dhrs3−/− embryos showed signs of edema.
HPLC analysis revealed that E13.5 Dhrs3−/− embryos had ∼4-fold reduced levels of retinol and retinyl esters compared with WT littermates (Fig. 8, A and B). On the other hand, atRA in Dhrs3−/− embryos appeared to be somewhat elevated (10.8 ± 2.6 versus 8.5 ± 1.8 pmol/g, wet weight) relative to WT embryos, although the difference in atRA levels did not reach statistical significance (p = 0.13, n = 5). No changes were observed in the levels of retinaldehyde.
FIGURE 8.
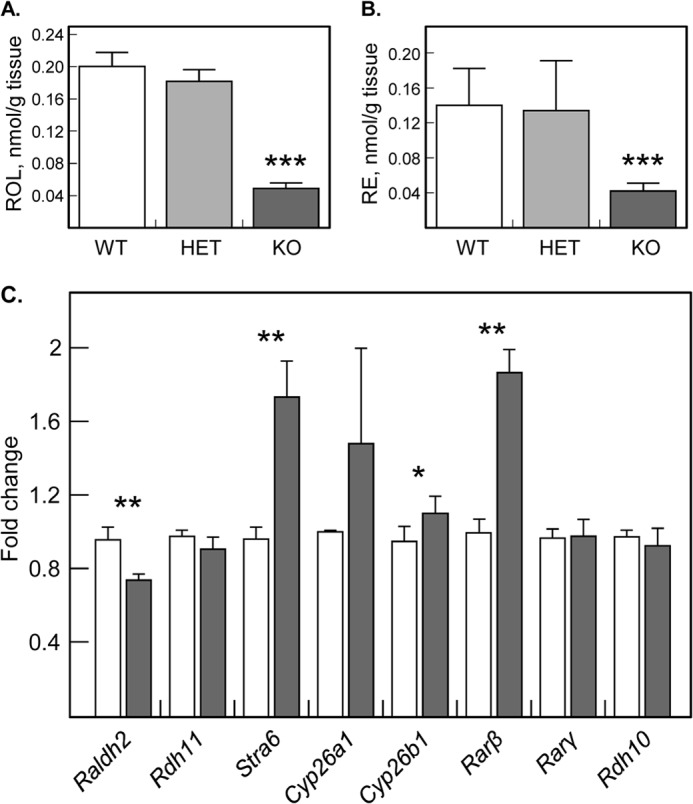
Analysis of retinoids and atRA-responsive genes in wild type and mutant mice. Retinol (A) and retinyl esters (B) were normalized per wet weight of E13.5 embryos. ***, p < 0.0003, mean ± S.D., n = 5. C, qPCR analysis of RNA isolated from WT (white bars) or KO (gray bars) E14.5 embryos. *, p < 0.05; **, p < 0.01, mean ± S.E., n = 3. Stra, stimulated by the retinoic acid gene; Rdh, retinol dehydrogenase; Raldh, retinaldehyde dehydrogenase; Cyp, cytochrome P450; Rar, retinoic acid receptor.
qPCR analysis detected a ∼1.8-fold increase in the expression of Rarβ and Stra6, whereas the expression of Raldh2 was decreased by ∼1.3-fold (Fig. 8C). Cyp26b1 transcript was slightly elevated (1.2-fold), but the increase in Cyp26a1 did not reach statistical significance. Thus, at E13.5, the relatively small changes in the expression of atRA-responsive genes correlated with the small increase in atRA levels, which could be possibly due to the reduced RDH10 activity in the absence of DHRS3 and the overall depletion of retinoid stores.
DHRS3-null Mice Have Reduced Retinaldehyde Reductase and Retinol Dehydrogenase Activities
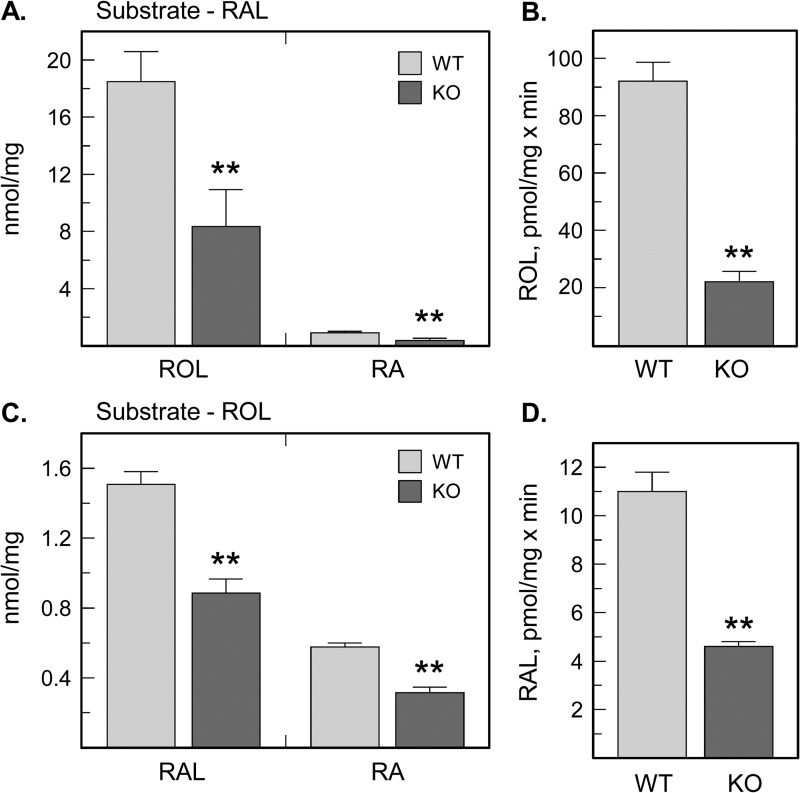
To compare the retinaldehyde reductase and retinol dehydrogenase activities in Dhrs3−/− mice versus WT littermates, we isolated MEFs from E14.5 embryos and incubated these cells with retinaldehyde or retinol. As expected, Dhrs3−/− MEFs produced less retinol from retinaldehyde than WT MEFs (Fig. 9A). Interestingly, the conversion of retinaldehyde to atRA was also reduced, in agreement with the decreased expression of Raldh2 (Fig. 8C). In accord with the reduced conversion of retinaldehyde to retinol in MEFs, the retinaldehyde reductase activity of the 15,000 × g membrane fraction isolated from E14.5 Dhrs3−/− embryos was ∼4-fold lower than the activity of WT membranes (Fig. 9B), indicating that DHRS3 is the primary but not the sole retinaldehyde reductase during embryogenesis.
FIGURE 9.
Analysis of retinaldehyde reductase and retinol dehydrogenase activities in Dhrs3−/−versus WT mice. MEFs isolated from E14.5 embryos were incubated with 5 μm retinaldehyde (A) or 10 μm retinol (C) for 12 h. Extracted retinoids were separated by normal phase HPLC and normalized per amount of cellular protein. **, p < 0.01, mean ± S.D., n = 3. Note that the conversion of retinol (ROL) to retinaldehyde (RAL) and atRA (RA) was reduced in Dhrs3−/− mice, supporting the in vitro data on activation of RDH10 by DHRS3. Membrane fractions (30 μg) isolated from wild-type (WT) or Dhrs3−/− (KO) E14.5 embryos were incubated with 1 μm retinaldehyde (B) or 2 μm retinol (D). **, p < 0.01, mean ± S.D., n = 3 embryos. Note that the membrane-associated retinaldehyde reductase and retinol dehydrogenase activities are both decreased in E14.5 Dhrs3−/− embryos.
Importantly, the conversion of retinol to retinaldehyde and atRA was also decreased in Dhrs3−/− MEFs. Dhrs3−/− MEFs produced 1.7-fold less retinaldehyde and 1.8-fold less atRA from 10 μm retinol after 12 h of incubation (Fig. 9C). In agreement with this finding, the 15,000 × g membrane-associated retinol dehydrogenase activity of E14.5 Dhrs3−/− embryos was about 2-fold lower than the activity of WT membranes (Fig. 9D).
DISCUSSION
This study uncovered an unexpected new layer of complexity in the molecular mechanisms controlling the biosynthesis of atRA. The major findings are as follows. First, human DHRS3 and RDH10 activate each other in a reciprocal manner, and this activation does not depend on the catalytic activity of either protein. Second, the RDH10-activated DHRS3 acts as a high-affinity all-trans-retinaldehyde-specific reductase that does not recognize 11-cis-retinaldehyde as substrate and prefers NADPH as a cofactor. Third, Dhrs3 transcript colocalizes with that of Rdh10 in the interdigital areas of mouse limb buds. Fourth, elimination of the DHRS3 protein in mice results in perinatal/early postnatal lethality, significantly reduced levels of retinol and retinyl esters, and reduced embryonic retinaldehyde reductase as well as retinol dehydrogenase activities.
Previous studies suggested that DHRS3 may be physiologically important for retinoid homeostasis as an atRA-inducible retinaldehyde reductase, but definitive proof that DHRS3 has enzymatic activity was lacking. The results presented here fill in this gap. The first evidence that DHRS3 functions as a retinaldehyde reductase comes from studies using HepG2 cells with silenced expression of DHRS3, which show that the decrease in endogenous native DHRS3 protein leads to a significantly increased conversion of retinol to retinaldehyde and atRA. This is accompanied by a strong up-regulation of atRA-responsive genes, indicating that the native DHRS3 controls the levels of transcriptionally active atRA.
Experiments involving co-transfections of DHRS3 with RDH10 in HEK293 cells demonstrate that DHRS3 requires RDH10 to display its full enzymatic potential. The presence of DHRS3 in the cells simultaneously with RDH10 clearly lowers the amount of retinaldehyde and atRA generated from retinol. The finding that DHRS3 needs RDH10 for the full activity explains the lack of DHRS3 effect on retinoid metabolism in the cells overexpressing DHRS3 alone, these cells do not have a sufficient amount of endogenous RDH10.
The ultimate proof that DHRS3 functions as an enzyme comes from experiments utilizing the DHRS3 active site mutant, Y188A, because no reduction of retinaldehyde to retinol can be detected in the cells co-expressing the Y188A mutant of DHRS3 with RDH10. Thus, DHRS3 functions as a true enzyme that requires an intact active site.
Experiments using recombinant DHRS3 and RDH10 expressed separately and in combination in Sf9 cells demonstrate that the activation of DHRS3 occurs solely as a result of its interaction with RDH10 and does not require any other components of the retinoid metabolic system. Importantly, these experiments show that RDH10 does not have to be catalytically active to exert its potentiating effect. This suggests that the activation of DHRS3 occurs as a result of its protein-protein interaction with RDH10, and not because RDH10 channels the retinaldehyde into the active site of DHRS3, which may also occur, but is not the molecular basis for the observed RDH10-mediated activation of DHRS3.
Another unexpected finding is that DHRS3 itself, either WT or mutant, potentiates the NAD(H)-dependent oxidoreductive activity of RDH10. This finding explains the puzzling activating effect of Y188A DHRS3 on RDH10-catalyzed oxidation of retinol in HEK293 cells: although catalytically inactive, the mutant DHRS3 can still stimulate the RDH10 activity, but because Y188A DHRS3 is unable to convert retinaldehyde back to retinol, the co-expression of Y188A DHRS3 with RDH10 results in an ∼8-fold higher production of retinaldehyde and atRA than the expression of RDH10 alone.
Similarly to other SDRs, DHRS3 is a bidirectional oxidoreductase that catalyzes both the reductive and oxidative directions in vitro and prefers NADP(H) as cofactor. The preference for NADP(H) ensures that in living cells DHRS3 functions exclusively in the reductive direction, because NADP+ exists mostly in the reduced form. Because DHRS3 requires RDH10 to display measurable activity, the kinetic data reflect the presence of more than one form of active DHRS3 enzyme, with the most active form exhibiting a low Km value for retinaldehyde (∼0.15 μm) similar to those of other SDRs with retinaldehyde reductase activity, such as RDH11 (∼0.2 μm for membrane-bound) and RDH12 (0.04 μm for purified) (13, 14). The Km value of DHRS3 + RDH10 for NADPH is also similar to those of the membrane-bound RDH11 (0.48 μm) and RDH12 (1.2 μm). However, unlike Dhrs3−/− mice, Rdh11−/− or Rdh12−/− mice are fully viable and fertile (26, 27). Thus, the special role of DHRS3 during mouse embryonic development is most likely due to its specific interaction with RDH10.
DHRS3 and RDH10 are closely related (4), sharing 54% sequence identity. Both proteins are associated with membranes and, as shown in this study, are co-localized in characteristic ring structures described previously by two other groups (24, 25). Like RDH10, DHRS3 is highly conserved across species with the mouse ortholog sharing 98% sequence identity to the human protein. Thus, the activating interaction between the two proteins may be a regulatory mechanism conserved across species. The observation that the retinol dehydrogenase activity is decreased 2-fold in mouse Dhrs3−/− embryos provides further support for this mechanism.
While this manuscript was in preparation, Billings et al. (28) reported the characterization of a different model of DHRS3 KO mice. The phenotype of KO mice described by this group is essentially similar to that observed here. The authors also detected a decrease in the levels of retinol and retinyl esters (2.3–2.6-fold) and an increase in the levels of atRA (∼32%) accompanied by up-regulation of atRA-inducible genes (≤2-fold) in E14.5 Dhrs3−/− embryos. The authors concluded that the reduction of retinaldehyde by DHRS3 is critical for preventing formation of excess atRA during embryonic development. The smaller changes in atRA relative to those in retinol and retinyl esters as observed by Billings et al. (28) as well as in this study are consistent with the decreased retinol dehydrogenase activity in DHRS3-null embryos. In addition, the overall depletion of retinoid stores in DHRS3-null embryos could result in reduced conversion of retinol to retinaldehyde. Finally, a recent study revealed that excess atRA is teratogenic by inducing a longer lasting, local atRA deficiency caused by decreased levels of Raldh transcripts and increased levels of Cyp26a1 and Cyp26b1 mRNAs (29). If Dhrs3−/− mice experience atRA toxicity during the earlier stages of development, this protracted overcompensation could contribute to further lowering of atRA levels in KO embryos at later stages.
The results of this study present a complex mechanism regulating atRA biosynthesis. One can envision a scenario where the cellular levels of atRA increase sufficiently to induce Dhrs3 expression. DHRS3 is then activated by RDH10 and counteracts RDH10 activity by converting retinaldehyde produced by RDH10 back to retinol. The reciprocal activation of RDH10 by DHRS3 resets the production of retinaldehyde at a higher level, preserving some atRA biosynthesis, but at a lower overall rate, allowing the system to adjust atRA levels in a gradual rather than all-or-nothing manner (illustrated in Fig. 10). The new baseline level of atRA biosynthesis would then depend on the exact ratio of mutually activating DHRS3 and RDH10 proteins. It is likely that the interaction between DHRS3 and RDH10 is transient, with the frequency of collisions depending on the concentration of each protein in the membrane. It is not yet known whether RDH10 and DHRS3 are always co-localized in different cell types, and whether their relative levels and localization change in response to varied physiological conditions. This information will be instrumental in understanding the pathophysiology of diseases associated with disruptions in atRA biosynthesis and retinoid homeostasis.
FIGURE 10.
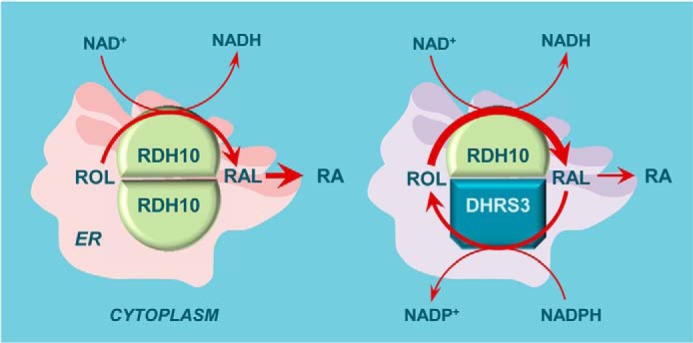
A model of gradual adjustment of the atRA rate of biosynthesis through mutually activating interaction between RDH10 and DHRS3. Note that the rate of ROL conversion to RAL is increased (thicker arrow) in the presence of DHRS3 compared with RDH10 alone, because DHRS3 activates RDH10. However, because this interaction also activates DHRS3 itself, the overall flux from RAL to RA is decreased (thinner arrow). The simultaneous activation of both RDH10 and DHRS3 would allow for a more measured adjustment of atRA biosynthesis (e.g. 25 versus 50%) in response to induction of DHRS3 expression. The exact rate would be determined by the relative ratios of RDH10 and DHRS3 proteins.
Supplementary Material
Acknowledgments
Services provided in this publication through the University of Alabama Transgenic Mouse Facility (RAK) are supported by National Institutes of Health Grants P30 CA13148, P30 AR048311, P30 DK074038, P30 DK05336, and P60 DK079626. We thank Dr. Hengbin Wang (University of Alabama School of Medicine, Birmingham, AL) for antibodies against the HA tag. We are also very grateful to Dr. Chesnokov for allowing us to use the confocal microscope in his laboratory, and especially to Katarina Akhmetova for excellent technical assistance with confocal microscopy analysis.
This work was supported, in whole or in part, by National Institutes of Health Grant AA12153 from the NIAAA.

This article contains supplemental Tables S1 and S2.
- atRA
- all-trans-retinoic acid
- qPCR
- quantitative PCR
- MEF
- mouse embryonic fibroblasts
- RDH
- retinol dehydrogenase
- SDR
- short chain dehydrogenase/reductase.
REFERENCES
- 1. Al Tanoury Z., Piskunov A., Rochette-Egly C. (2013) Vitamin A and retinoid signaling: genomic and nongenomic effects. J. Lipid Res. 54, 1761–1775 [DOI] [PMC free article] [PubMed] [Google Scholar]
- 2. Clagett-Dame M., Knutson D. (2011) Vitamin A in reproduction and development. Nutrients 3, 385–428 [DOI] [PMC free article] [PubMed] [Google Scholar]
- 3. Ross A. C., Zolfaghari R. (2011) Cytochrome P450s in the regulation of cellular retinoic acid metabolism. Annu. Rev. Nutr. 31, 65–87 [DOI] [PMC free article] [PubMed] [Google Scholar]
- 4. Kedishvili N. Y. (2013) Enzymology of retinoic acid biosynthesis and degradation. J. Lipid Res. 54, 1744–1760 [DOI] [PMC free article] [PubMed] [Google Scholar]
- 5. Napoli J. L. (1986) Retinol metabolism in UC-PKI cells. Characterization of retinoic acid synthesis by an established mammalian cell line. J. Biol. Chem. 261, 13592–13597 [PubMed] [Google Scholar]
- 6. Sandell L. L., Sanderson B. W., Moiseyev G., Johnson T., Mushegian A., Young K., Rey J. P., Ma J. X., Staehling-Hampton K., Trainor P. A. (2007) RDH10 is essential for synthesis of embryonic retinoic acid and is required for limb, craniofacial, and organ development. Genes Dev. 21, 1113–1124 [DOI] [PMC free article] [PubMed] [Google Scholar]
- 7. Rhinn M., Schuhbaur B., Niederreither K., Dollé P. (2011) Involvement of retinol dehydrogenase 10 in embryonic patterning and rescue of its loss of function by maternal retinaldehyde treatment. Proc. Natl. Acad. Sci. U.S.A. 108, 16687–16692 [DOI] [PMC free article] [PubMed] [Google Scholar]
- 8. Ashique A. M., May S. R., Kane M. A., Folias A. E., Phamluong K., Choe Y., Napoli J. L., Peterson A. S. (2012) Morphological defects in a novel Rdh10 mutant that has reduced retinoic acid biosynthesis and signaling. Genesis 50, 415–423 [DOI] [PMC free article] [PubMed] [Google Scholar]
- 9. Cerignoli F, Guo X., Cardinali B., Rinaldi C., Casaletto J., Frati L., Screpanti I., Gudas L. J., Gulino A., Thiele C. J., Giannini G. (2002) retSDR1, a short-chain retinol dehydrogenase/reductase, is retinoic acid-inducible and frequently deleted in human neuroblastoma cell lines. Cancer Res. 62, 1196–1204 [PubMed] [Google Scholar]
- 10. Zolfaghari R., Chen Q., Ross A. C. (2012) DHRS3, a retinal reductase, is differentially regulated by retinoic acid and lipopolysaccharide-induced inflammation in THP-1 cells and rat liver. Am. J. Physiol. Gastrointest. Liver Physiol. 303, G578–G588 [DOI] [PMC free article] [PubMed] [Google Scholar]
- 11. Haeseleer F., Huang J., Lebioda L., Saari J. C., Palczewski K. (1998) Molecular characterization of a novel short-chain dehydrogenase/reductase that reduces all-trans-retinal. J. Biol. Chem. 273, 21790–21799 [DOI] [PubMed] [Google Scholar]
- 12. Chai X., Boerman M. H., Zhai Y., Napoli J. L. (1995) Cloning of a cDNA for liver microsomal retinol dehydrogenase. A tissue-specific, short-chain alcohol dehydrogenase. J. Biol. Chem. 270, 3900–3904 [DOI] [PubMed] [Google Scholar]
- 13. Belyaeva O. V., Stetsenko A. V., Nelson P., Kedishvili N. Y. (2003) Properties of short-chain dehydrogenase/reductase RalR1: characterization of purified enzyme, its orientation in the microsomal membrane, and distribution in human tissues and cell lines. Biochemistry 42, 14838–14845 [DOI] [PubMed] [Google Scholar]
- 14. Belyaeva O. V., Korkina O. V., Stetsenko A. V., Kim T., Nelson P. S., Kedishvili N. Y. (2005) Biochemical properties of purified human retinol dehydrogenase 12 (RDH12): catalytic efficiency toward retinoids and C9 aldehydes and effects of cellular retinol-binding protein type I (CRBPI) and cellular retinaldehyde-binding protein (CRALBP) on the oxidation and reduction of retinoids. Biochemistry 44, 7035–7047 [DOI] [PMC free article] [PubMed] [Google Scholar]
- 15. Feng L., Hernandez R. E., Waxman J. S., Yelon D., Moens C. B. (2010) Dhrs3a regulates retinoic acid biosynthesis through a feedback inhibition mechanism. Dev. Biol. 338, 1–14 [DOI] [PMC free article] [PubMed] [Google Scholar]
- 16. Lee S. A., Belyaeva O. V., Wu L., Kedishvili N. Y. (2011) Retinol dehydrogenase 10 but not retinol/sterol dehydrogenase(s) regulates the expression of retinoic acid-responsive genes in human transgenic skin raft culture. J. Biol. Chem. 286, 13550–13560 [DOI] [PMC free article] [PubMed] [Google Scholar]
- 17. Belyaeva O. V., Johnson M. P., Kedishvili N. Y. (2008) Kinetic analysis of human enzyme RDH10 defines the characteristics of a physiologically relevant retinol dehydrogenase. J. Biol. Chem. 283, 20299–20308 [DOI] [PMC free article] [PubMed] [Google Scholar]
- 18. Gough W. H., VanOoteghem S., Sint T., Kedishvili N. Y. (1998) cDNA cloning and characterization of a new human microsomal NAD+-dependent dehydrogenase that oxidizes all-trans-retinol and 3α-hydroxysteroids. J. Biol. Chem. 273, 19778–19785 [DOI] [PubMed] [Google Scholar]
- 19. Zhang M., Hu P., Krois C. R., Kane M. A., Napoli J. L. (2007) Altered vitamin A homeostasis and increased size and adiposity in the rdh1-null mouse. FASEB J. 21, 2886–2896 [DOI] [PubMed] [Google Scholar]
- 20. Nagy A., Gertsenstein M., Vintersten K., Behringer R. (2003) Manipulating the Mouse Embryo: A Laboratory Manual, Cold Spring Harbor Laboratory Press, Cold Spring Harbor, NY [Google Scholar]
- 21. Hauptmann G. (2001) One-, two-, and three-color whole mount in situ hybridization to Drosophila embryos. Methods 23, 359–372 [DOI] [PubMed] [Google Scholar]
- 22. Napoli J. L., Horst R. L. (1998) Quantitative analyses of naturally occurring retinoids. in Methods in Molecular Biology: Retinoid Protocols (Redfern C. P. F., ed) Vol. 89, Humana Press, Totowa, NJ: [DOI] [PubMed] [Google Scholar]
- 23. Persson B., Hedlund J., Jörnvall H. (2008) Medium- and short-chain dehydrogenase/reductase gene and protein families: the SDR superfamily: functional and structural diversity within a family of metabolic and regulatory enzymes. Cell Mol. Life Sci. 65, 3879–3894 [DOI] [PMC free article] [PubMed] [Google Scholar]
- 24. Jiang W., Napoli J. L. (2013) The retinol dehydrogenase Rdh10 localizes to lipid droplets during acyl ester biosynthesis. J. Biol. Chem. 288, 589–597 [DOI] [PMC free article] [PubMed] [Google Scholar]
- 25. Deisenroth C., Itahana Y., Tollini L., Jin A., Zhang Y. (2011) Expression of retSDR1 is activated by members of the p53 family, suggesting a potential role for retSDR1 in tumor suppression. J. Biol. Chem. 286, 28343–28356 [DOI] [PMC free article] [PubMed] [Google Scholar]
- 26. Kim T. S., Maeda A., Maeda T., Heinlein C., Kedishvili N., Palczewski K., Nelson P. S. (2005) Delayed dark adaptation in 11-cis-retinol dehydrogenase-deficient mice: a role of RDH11 in visual processes in vivo. J. Biol. Chem. 280, 8694–8704 [DOI] [PMC free article] [PubMed] [Google Scholar]
- 27. Maeda A., Maeda T., Imanishi Y., Sun W., Jastrzebska B., Hatala D. A., Winkens H. J., Hofmann K. P., Janssen J. J., Baehr W., Driessen C. A., Palczewski K. (2006) Retinol dehydrogenase (RDH12) protects photoreceptors from light-induced degeneration in mice. J. Biol. Chem. 281, 37697–37704 [DOI] [PMC free article] [PubMed] [Google Scholar]
- 28. Billings S. E., Pierzchalski K., Butler Tjaden N. E., Pang X. Y., Trainor P. A., Kane M. A., Moise A. R. (2013) The retinaldehyde reductase DHRS3 is essential for preventing the formation of excess retinoic acid during embryonic development. FASEB J. 27, 4877–4889 [DOI] [PMC free article] [PubMed] [Google Scholar]
- 29. Lee L. M., Leung C. Y., Tang W. W., Choi H. L., Leung Y. C., McCaffery P. J., Wang C. C., Woolf A. S., Shum A. S. (2012) A paradoxical teratogenic mechanism for retinoic acid. Proc. Natl. Acad. Sci. U.S.A. 109, 13668–13673 [DOI] [PMC free article] [PubMed] [Google Scholar]
Associated Data
This section collects any data citations, data availability statements, or supplementary materials included in this article.


