

Abstract
Directed self-assembly of small molecules in living systems could enable a myriad of applications in biology and medicine, and it has been widely used to synthesize supramolecules and nano/microstructures in solution and in living cells. However, controlling self-assembly of synthetic small molecules in living animals is challenging because of the complex and dynamic in vivo physiological environment. Here we employed an optimized first-order bioorthogonal cyclization reaction to control self-assembly of a fluorescent small molecule, and demonstrated its in vivo applicability by imaging of casapae-3/7 activity in human tumor xenograft mouse models of chemotherapy. The in situ assembled fluorescent nanoparticles have been successfully imaged in both apoptotic cells and tumor tissues using three-dimensional structured illumination microscopy. This strategy combines the advantages offered by small molecules with those of nanomaterials and should find widespread use for non-invasive imaging of enzyme activity in vivo.
Controlling small molecules self-assembly into supramolecular complexes is pervasive among living things, building complex structures capable of high-order functions necessary for life1,2. In the laboratory, this principle is also widely used to synthesize supramolecules and nano/microstructures3–5. Recently, extensive efforts have been made to design small molecules with the propensity for controlled self-assembly in living cells6–10. In these examples, small molecules are shown to enter cells and undergo self-assembly after activation by subcellular targets. Introduction of this technology into whole mammalian organisms would offer myriads of applications in biology and medicine such as controlled drug delivery, synthesis of new functional molecules, new ways for regulating cellular processes and molecular imaging in living subjects11. However, the in vivo physiological environment—a much more complex and dynamic setting than cultured cells—demands high bioorthogonality and biocompatibility of the self-assembly chemistry, and presents significant barriers to characterize such a system.
Biocompatible reactions including Staudinger ligation12,13, strain-promoted azide-alkyne cycloaddition14,15, trans-cyclooctene/tetrazine cycloaddition16–18, and Pictet-Spengler ligation19, have been developed for probing biological interactions in living cells20,21, but there are few examples of their applications in living animals22–25. Recently, we have reported a new biocompatible reaction between free cysteine and cyanobenzothiazole (CBT) that can proceed in physiological conditions with a fast second-order rate constant (9.1 M−1 s−1)26,27. This reaction has been applied to protein labeling26 and protease activity imaging in living cells6. Here we employed an optimized CBT-like first-order condensation reaction10 to control self-assembly of a fluorescent small molecule in apoptotic cells, and further demonstrated its applicability in vivo through imaging of chemotherapeutic efficacy against human tumor xenograft mouse models.
Imaging tumor apoptosis can provide invaluable predictive information regarding therapeutic efficacy and anti-cancer drug selection28,29. The effector caspases (e.g. caspase-3 and -7)30–32 are ideal apoptosis imaging targets, since their activation necessarily commits the cell to programmed death. We designed a series of in vitro and in vivo experiments demonstrating the active caspase-3/7-controlled self-assembly of small molecules into nanoparticles, distinguishing negative from positive response of tumors to chemotherapy. The in situ assembled fluorescent nanoparticles distributed throughout the cytosol and apoptotic bodies were successfully imaged for the first time in cells and tumor tissue using three-dimensional structured illumination microscopy. This first demonstration of synthetic small molecules capable of self-assembly in live animals proves the potential of this novel bioorthogonal cyclization chemistry for molecular imaging.
Results
Design of caspase-3/7-sensitive and control probes
Caspase-sensitive nano-aggregation fluorescent probe (C-SNAF) was designed to be biocompatible, possess near-infrared (NIR) spectral properties, and undergo triggered self-assembly through condensation chemistry10 in vivo. As shown in Fig. 1a, it comprises: (1) D-cysteine and 2-cyano-6-hydroxyquinoline (CHQ) moieties linked to an amino luciferin scaffold, and (2) an L-DEVD capping sequence and a disulfide bond required for two-step activation involving caspase-3/7-mediated cleavage and intracellular thiol-mediated reduction. Fig. 1b illustrates the proposed mechanism by which C-SNAF reports chemotherapy-induced tumor cell death in vivo. After intravenous administration, C-SNAF extravasates and penetrates into tumor tissue. In tumor tissue unresponsive to applied therapy, pro-caspase-3/7 dominates and cannot release the L-DEVD capping peptide from C-SNAF33, which results in rapid clearance of the probe. However, in therapy responsive tissue, increased cell membrane permeability and extensive activation of caspase-3/7 upon progression to cell death34–36 permit uptake of C-SNAF and cleavage of the L-DEVD capping peptide to trigger intramolecular condensation into the macrocycle C-SNAF-cycl. C-SNAF-cycl is rigid and hydrophobic (logP: 3.06 for C-SNAF-cycl vs. −2.44 for C-SNAF)37, and susceptible to intermolecular interactions (i.e. hydrophobic interactions, π-π stacking) promoting nano-aggregation in situ. These nano-aggregates are retained in apoptotic cells and afford high imaging contrast for treatment response detection.
Figure 1. Illustration of the mechanism of in vivo imaging of caspase-3/7 activity in human tumor xenograft mouse models by C-SNAF.
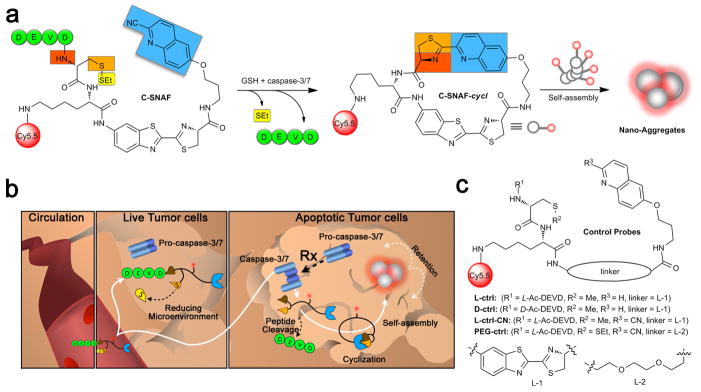
a, Proposed caspase-3/7 and reduction-controlled conversion of C-SNAF to C-SNAF-cycl through the bioorthogonal intramolecular cyclization reaction, followed by self-assembly into nano-aggregates in situ. b, The fate of C-SNAF in vivo is dependent upon the tumor response to chemotherapy. Following intravenous administration, C-SNAF extravasates into tumor tissue due to its small size. In live tumor tissue that is not responding to applied chemotherapy, the pro-caspase-3 is inactive, and the DEVD capping peptide remains intact. C-SNAF can freely diffuse away from live tumor tissue, leading to low fluorescence. In apoptotic tumor tissue, pro-caspase-3 is converted to active caspase-3, and C-SNAF can readily enter cells due to the compromised membrane integrity associated with apoptosis. After DEVD cleavage by active caspase-3 and disulfide reduction, C-SNAF undergoes macrocyclization and in situ nano-aggregation, leading to enhanced probe retention and high fluorescence. c, The chemical structures of control probes L-ctrl, D-ctrl, L-ctrl-CN and PEG-ctrl.
A series of control compounds were synthesized to substantiate this proposed mechanism of C-SNAF (Fig. 1c). The first control (L-ctrl) comprised a methylated cysteine thiol and a quinolin-6-yl ring replacing the CHQ, preventing intramolecular cyclization following L-DEVD peptide cleavage by caspase-3/7. L-ctrl-CN is an L-ctrl derivative with a cyano group. L-ctrl and L-ctrl-CN thus interrogated the relative contribution of peptide cleavage and macrocyclization to the mechanism of C-SNAF. A third control probe (D-ctrl) containing a D-DEVD sequence resistant to caspae-3/7 cleavage38 examined the contribution of caspase-3/7-independent chemotherapy induced tumor changes (i.e. altered perfusion or cell membrane integrity) that could otherwise possibly affect C-SNAF performance in vivo. PEG-ctrl contained a hydrophilic poly(ethylene glycol) (PEG) linker replacing the hydrophobic aminoluciferin linker in order to prevent self-assembly after cyclization, and was designed to examine the role of nano-aggregation in the activity of C-SNAF.
Macrocyclization and self-assembly of C-SNAF in vitro
Macrocyclization of C-SNAF to C-SNAF-cycl was monitored in solution using high performance liquid chromatography (HPLC) and matrix-assisted laser desorption/ionization mass spectroscopic (MALDI-MS) analysis. Upon incubation with recombinant human caspase-3 (4.9 × 10⁻³ U/ml) in reaction buffer, C-SNAF (25 μM) (HPLC retention time TR = 15.8 min) was efficiently converted to C-SNAF-cycl (TR = 17.7 min) with fast reaction kinetics (half-life (t1/2) < 1 h) (Fig. 2, Supplementary Fig. S1). C-SNAF and its disulfide-reduced intermediates were nearly completely converted to C-SNAF-cycl after 6 h (Supplementary Fig. S2). In contrast, only caspase-3-mediated DEVD hydrolysis (without macrocyclization) was observed with L-ctrl (Supplementary Fig. S3), and D-ctrl remained unchanged after 24 h of incubation with caspase-3 (Supplementary Fig. S4). Transmission electron microscope (TEM) images of the reaction solution revealed that only C-SNAF formed nano-aggregates with average diameter of 174 ± 44 nm (Fig. 2c, Supplementary Fig. S1), not L-ctrl nor D-ctrl (Supplementary Fig. S3,4). These in vitro results demonstrate that caspase-3-mediated proteolytic hydrolysis induces C-SNAF to undergo intramolecular macrocyclization leading to nano-aggregation.
Figure 2. In vitro characterization of caspase-3/7-sensitive nano-aggregation fluorescent probe (C-SNAF).
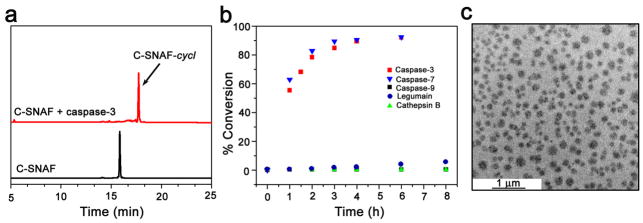
a, HPLC traces of C-SNAF in water (black, TR = 15.8 min) and the incubation of C-SNAF (25 μM) with recombinant human caspase-3 (4.9 × 10⁻³ U/ml) for 24 h at 37 °C in the caspase-3 buffer (red, TR = 17.7 min). b, The enzymatic reaction kinetics and specificity studies by longitudinal monitoring of % conversion of C-SNAF (25 μM) to C-SNAF-cycl after incubation with equal masses (0.735 μg/ml) of recombinant human caspase-3, caspase-7, caspase-9, cathepsin B, or legumain. c, TEM image of nano-aggregates after incubation C-SNAF (50 μM) with recombinant human caspase-3 (4.9 × 10⁻³ U/mL) overnight at 37 °C in caspase-3 buffer; scale bar, 1 μm.
The specificity of C-SNAF towards representative cysteine proteases, including caspase-7, caspase-9, cathepsin B and legumain, was examined. HPLC analysis of incubations of C-SNAF (25 μM) with recombinant enzymes (0.735 μg/ml, each) unambiguously revealed its high selectivity toward effector caspases-3/7, which share the same peptide substrate specificity31,38 (Fig. 2b, Supplementary Fig. S2). Neither the initiator caspase-9, nor cathepsin B or legumain could significantly activate C-SNAF, even though recent reports show their potential for DEVD peptide recognition32,39.
Imaging caspase-3/7 activity in drug-treated cancer cells
After apoptotic cell model validation (Supplementary Fig. S5,10,15), flow cytometry was employed to interrogate the capacity of C-SNAF to specifically label apoptotic tumor cells in vitro. The ability of C-SNAF, L-, or D-ctrl to indicate apoptosis was assessed in staurosporine (STS)-treated HeLa cells40 with co-labelling by a fluorescent inhibitor of caspase (FLICA), an established standard marker of caspase-3/7-mediated apoptosis (Fig. 3a). Weak fluorescence of untreated HeLa cells following incubation with C-SNAF, L-, or D-ctrl suggests the low uptake of these probes in viable cells (Supplementary Fig. S6). FLICA-positive apoptotic cells were efficiently co-labeled by C-SNAF with a nearly 13-fold increase in Cy5.5 fluorescence relative to viable cells. Neither L- nor D-ctrl probe showed any significant fluorescence enhancement. Labeling by C-SNAF was abrogated by the pan-caspase inhibitor Z-VAD-fmk, confirming the activation of C-SNAF by effector caspases (Supplementary Fig. S7). Similar results were obtained following treatment of HeLa cells with doxorubicin (DOX)41 (Supplementary Fig. S11).
Figure 3. Imaging of caspase-3/7 activity in STS-treated cancer cells with C-SNAF.

a, Flow cytometry analysis of viable and STS-induced apoptotic HeLa cells after incubation with C-SNAF (2 μM), C-SNAF (2 μM) with caspase inhibitor Z-VAD-fmk (50 μM), or L-ctrl or D-ctrl (2 μM). The quadrants Q are defined as Q1 = fluorescent inhibitor of caspase (FLICA) negative/Cy5.5 negative, Q2 = FLICA positive/Cy5.5 negative, Q3 = FLICA positive/Cy5.5 positive and Q4 = FLICA negative/Cy5.5 positive. Representative dot plots show that FLICA-positive apoptotic cells were efficiently labeled by C-SNAF, but not by control probes (L-ctrl and D-ctrl), demonstrating a good correlation between C-SNAF and FLICA. b, Fluorescence microscopy imaging of C-SNAF (2 μM) labeling STS-induced apoptotic HeLa cells. Cells were stained with nuclear dye Hoechst 33342 (blue). Extensive fluorescence (red) was observed only in the apoptotic cells, indicating specific intracellular accumulation of C-SNAF after caspase-3/7-triggered macrocyclization and nano-aggregation.
The retention of C-SNAF in apoptotic HeLa cells was further investigated by fluorescence microscopy. C-SNAF accumulated extensively in the cytosol of apoptotic cells, while only negligible fluorescence was observed in both viable cells and apoptotic cells pre-treated with Z-VAD-fmk (Fig. 3b, Supplementary Fig. S7). The labeling of apoptotic cells by C-SNAF was both drug concentration- and incubation time-dependent, showing an approximately 4-fold enhancement in cell labeling efficiency (23 to 90%) with a paralleled 4-fold increase in the STS concentration (0.5 to 2 μM) (Supplementary Fig. S8). This dose dependence was recapitulated with DOX, resulting in an approximately 10-fold enhancement in cell labeling efficiency (9 to 92%) with a paralleled 5-fold increase in concentration (1 to 5 μM) (Supplementary Fig. S12). Efficient labeling of apoptotic cells was only achieved with the application of C-SNAF, but not with L- or D-ctrl (Fig. 3b, Supplementary Fig. S11), its pre-formed aggregate C-SNAF-cycl, or L-ctrl-CN (Supplementary Fig. S13). Additionally, the incubation of STS-treated HeLa cells with PEG-ctrl (2 μM) resulted in significantly lower fluorescence retention than C-SNAF (Supplementary Fig. S14). Similar imaging results were observed in STS-treated MDA-MB-231 cells (Supplementary Fig. S15), demonstrating the cell type-independent nature of C-SNAF activation.
We confirmed the formation of C-SNAF-cycl both in apoptotic cell lysates and whole cells by HPLC analysis. Upon incubation of C-SNAF (5 μM) with lysate of apoptotic HeLa (Supplementary Fig. S9,10) or MDA-MB-231 (Supplementary Fig. S15) cells, more than 90% of C-SNAF was converted to C-SNAF-cycl. In contrast, upon incubation with viable cell lysate, the majority of C-SNAF underwent disulfide reduction except a minor condensation product with endogenous free cysteine. The production of C-SNAF-cycl was also observed upon the incubation of C-SNAF (50 μM) with whole STS-induced apoptotic HeLa cells within 24 h (Supplementary Fig. S9), indicating efficient intramolecular cyclization initiated by activated caspase-3/7 in a complex cellular environment.
Direct observation of in situ formed nanoparticles
We employed three-dimensional structured illumination microscopy (3D-SIM) to directly image self-assembled nano-aggregates inside cells and in tumor tissue42,43. To enable 3D-SIM, an Alexa488-labelled probe, C-SNAF-SIM, was synthesized (Supplementary Scheme S5, Fig. S16). Like C-SNAF, C-SNAF-SIM (25 μM) was efficiently cyclized upon incubation with caspase-3 (4.9 × 10⁻³ U/ml) in reaction buffer and subsequently self-assembled as revealed by TEM (Supplementary Fig. S16). The nano-aggregation was time-dependent as demonstrated by the serial DLS measurements of particle size (Supplementary Fig. S17).
C-SNAF-SIM (2 μM) was incubated with STS-treated HeLa cells for 3D-SIM imaging. Strong fluorescent punctates distributed throughout both the cytosol and apoptotic bodies were observed in individual apoptotic cells (Fig. 4a–c, Movie S1). The average size of nano-aggregates was approximately 148 ± 36 nm on the x-y plane (n = 50), which correlated well with DLS (151 ± 53 nm) and TEM (143 ± 27 nm) results (Supplementary Fig. S16). The incubation of viable cells with C-SNAF-SIM or apoptotic cells with the control probe L-ctrl-SIM gave diffuse and weak cellular fluorescence (Supplementary Fig. S18,19). Similar fluorescent nano-aggregates were also found in cells incubated with SIM-1, a reduction-sensitive probe, but not with SIM-ctrl (Supplementary Fig. S20, Movie S2).
Figure 4. Three-dimensional structured illumination microscopy (3D-SIM) imaging of self-assembled fluorescent nano-aggregates in cells.
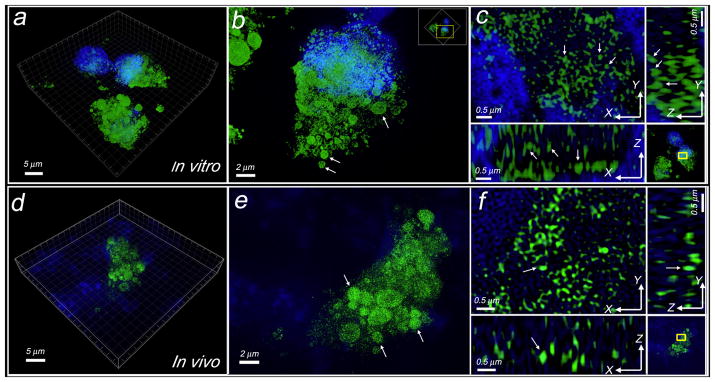
a, Representative 3D-SIM image of self-assembled fluorescent nanoparticles in apoptotic cells incubated with C-SNAF-SIM (2 μM). Cells were co-stained with DAPI (4′,6-diamidino-2-phenylindole). Green color indicates the probe fluorescence, and blue indicates nucleus. b, Enlarged 3D-SIM image of a single cell in a. Arrows show the probe accumulated in the apoptotic bodies. Yellow box indicates the enlarged area. c, Enlarged 3D-SIM images in 3D-slice in cells. Upper left shows XY slices; upper right and lower left show orthogonal YZ and XZ views of the processed Z-stack. Yellow box indicates the enlarged area. Arrows show the views of representative individual fluorescent dots in XY, YZ, and XZ panels, with a diameter of ~150 nm at X or Y dimension. d, Representative 3D-SIM image of tissue slice (10 μm thick) from DOX-treated tumor after i.v. injection of C-SNAF-SIM (20 nmol). Tissues were co-stained with DAPI. e, Enlarged 3D-SIM image in apoptotic tumor tissues from d. Arrows show the probe accumulated in the therapy-induced apoptotic bodies. f, Enlarged 3D-SIM images in 3D-slice in tumor tissues. Arrows show the same fluorescent dot observed in XY, YZ, and XZ panels.
Next, C-SNAF-SIM or L-ctrl-SIM was administered i.v. into HeLa tumor-bearing mice following three rounds of systemic DOX chemotherapy (8 mg/kg). Tumors were resected and processed for 3D-SIM imaging one hour later. Fluorescent nanoparticles were clearly visible within apoptotic tumor tissue, with an average particle size of 141 ± 31 nm on the x-y plane (n = 40) (Fig. 4d–f, Movie S3). The punctate subcellular distribution of nanoparticles in vivo mirrored that observed in vitro, with aggregates distributed throughout the cytosol and apoptotic bodies. The administration of L-ctrl-SIM did not show nano-aggregates but much weaker and diffuse fluorescence inside tumor tissues (Supplementary Fig. S21).
Noninvasive monitoring of DOX-induced tumor apoptosis
In healthy nude mice, C-SNAF cleared rapidly from the circulation with a blood half-life of 1.0 ± 0.45 h, which was not significantly different from L-ctrl (0.5 ± 0.28 h) (p>0.05) and in good agreement with the biodistribution data of C-SNAF (Supplementary Fig. S22). A high kidney uptake with little accumulation in other organs indicated predominant renal clearance of C-SNAF. Nearly complete elimination of C-SNAF from the body occurred by 12 h after administration. An investigation of the integrity of C-SNAF, L-ctrl, and D-ctrl in mouse serum demonstrated good stability of C-SNAF, with a longer than 6 h half-life suitable for in vivo imaging (Supplementary Fig. S23).
The ability of C-SNAF to indicate positive response to chemotherapy was assessed in female nude mice bearing subcutaneous HeLa tumors that received either i.v. chemotherapy consisting of three doses of 8 mg/kg DOX (3X DOX)44 or saline (Fig. 5, Supplementary Fig. S24). C-SNAF or either of the control probes (5 nmol) was administered i.v. to tumor-bearing mice, and whole-body fluorescence was monitored longitudinally using a Maestro fluorescence imager. C-SNAF showed significantly brighter signals in DOX-treated compared to saline-treated tumors (Fig. 5a, Supplementary Fig. S25) (n = 5, p<0.05), with maximum fluorescence 1 h after administration. A significant 1.6-fold increase in fluorescence signal in DOX-treated tumors compared to saline-treated mice occurred by 4 h (Fig. 5b). This signal enhancement correlates well with the 1.9-fold increase in caspase-3/7 activity measured in DOX-treated relative to saline-treated tumors (Supplementary Fig. S24). Neither L-ctrl nor D-ctrl resulted in a significant increase in fluorescence relative to their saline-treated counterparts (p>0.05) (Fig. 5b, Supplementary Fig. S25): an average signal change at 4 h of only 0.24 % and −12%, respectively.
Figure 5. Noninvasive imaging of apoptosis in tumor-bearing mice treated with DOX.
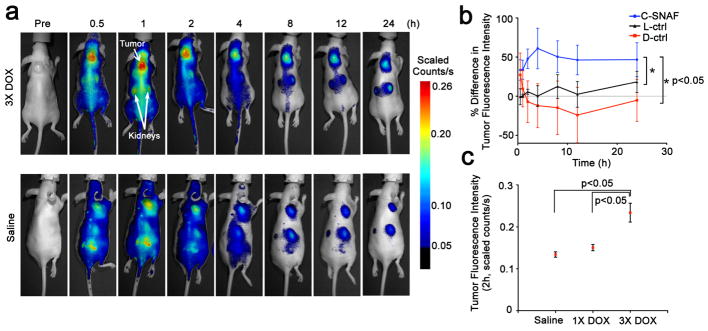
a, Longitudinal fluorescence imaging of 3X DOX- (top) and saline-treated (bottom) tumor-bearing mice with C-SNAF (5 nmol). Anatomical locations of the tumor and kidneys are indicated by white arrows. Mice bearing subcutaneous HeLa tumors received either i.v. chemotherapy of 8 mg/kg DOX or saline once every 4 days for a total of three times. Two days following the final treatment, C-SNAF (5 nmol) in saline was administered i.v. and whole-body fluorescence was monitored longitudinally using a Maestro fluorescence imager. b, The percent difference in tumor fluorescence intensity between 3X DOX and saline treatment groups over the course of imaging for C-SNAF (blue, n = 5), L-ctrl (black, n = 5), and D-ctrl (red, n = 5). * p<0.05 between groups indicates by brackets. c, A comparison of the average tumor fluorescence intensity at 2 h after C-SNAF administration in saline-treated mice (n = 4), or following a single (1X DOX) or three DOX treatments (3X DOX) in the same animals (n = 4). * p<0.05 between groups indicated by brackets. All the error bars indicate standard deviation.
Tumors were resected 4 h after probe injection for immunohistochemistry (Fig. 6a, Supplementary Fig. S26), showing a lower level of active caspase-3 (green) and C-SNAF retention (red) in saline-treated relative to DOX-treated tumors. Additionally, the spatial distribution of enhanced probe retention in DOX-treated tumors matched well that of active caspase-3. While the L-ctrl and D-ctrl produced elevated fluorescence in saline-treated tumor tissues relative to C-SNAF, lower fluorescence with less co-localization with active caspase-3 was observed in DOX-treated tumor tissues compared to C-SNAF, which is consistent with whole-body imaging data (Supplementary Fig. S26). HPLC analysis revealed a significantly greater amount of C-SNAF-cycl in DOX-treated relative to saline-treated tumor lysates (Fig. 6b), confirming that cyclization occurred in living mice. These results indicate that (1) the accumulation of both control probes in tumors was treatment-independent, (2) only C-SNAF provided the specific labeling of apoptotic tumors responding to chemotherapy through caspase-triggered macrocyclization and nano-aggregation.
Figure 6. Correlation of enhanced C-SNAF macrocyclization and tissue retention with caspase-3 activation and tumor response to therapy.

a, Immunohistochemical analysis of tumors resected from mice treated with saline (top) or 3X DOX (bottom) 4 h following administration of C-SNAF (5 nmol, red). Tissue sections were co-stained for nuclei (blue) and active caspase-3 (green). b, HPLC traces (675 nm detection) of blank tumor lysate from saline treatment (black), and C-SNAF (5 μM) following 24 h incubation with tumor lysate from mice after treatment with saline (blue), 3X DOX (red), or saline with addition of caspase-3 (green, 4.9 × 10⁻³ U/mL). Peak # indicates C-SNAF-cycl. c, Plots of the maximum tumor fluorescence 1 h after C-SNAF administration versus the maximum tumor size change following 3X DOX revealed a strong correlation for DOX-treated mice (red, Pearson’s r = −0.9, p<0.05), but no correlation for saline-treated animals (blue, r = −0.2, p>0.05). d, Plots of the maximum tumor fluorescence 1 h after control probes administration versus the maximum tumor size change following 3X DOX revealed no significant correlation (p>0.05) for both the L-ctrl (blue, r = −0.3) and D-ctrl (red, r =0.2). The regression lines are shown in solid.
The capability of C-SNAF to serially report tumor response to chemotherapeutic intervention in the same mouse was demonstrated by probe administration and imaging two days after both the first and the third treatment with DOX. Following a single dose of DOX (1X DOX), a moderate increase in tumor fluorescence relative to saline-treated mice could be detected (Fig. 5c). A significant fluorescence enhancement following the third round of DOX therapy occurred in the same group of animals relative to both saline and 1X DOX treatment (p<0.05) (Fig. 5c). The imaging results paralleled that of tumor size changes, where no significant size difference was noted following 1X DOX, but a significant size reduction occurred following the third round of chemotherapy (Supplementary Fig. S24). There is a strong correlation (r = −0.9, p<0.05) between the maximum tumor fluorescence signal produced after the administration of C-SNAF and the maximum tumor volume change observed following chemotherapy (Fig. 6c). No correlation was observed in saline-treated mice (Fig. 6c) or either control probe in mice receiving 3X DOX treatment (Fig. 6d). Therefore, C-SNAF can provide information regarding the degree of response of individual tumors to applied therapy, and not just a binary indication of the induction of apoptosis.
Discussion
The cyclization reaction between free cysteine and CHQ is a biocompatible, kinetically fast intramolecular condensation (6 × 10⁻³ s−1)10. This first-order reaction allows for efficient intramolecular macrocyclization in physiological environments independent of local probe concentrations; this is an important advantage over intermolecular reactions for controlled self-assembly in vivo. The cysteine concentration in human blood is generally around 10–100 μM45,46, which may additionally compromise the ability of the CBT-based system to undergo intermolecular condensation in vivo47. In contrast, the transition from inter- to intramolecular condensation between CHQ and cysteine moieties in C-SNAF effectively outcompetes free cysteine and has resulted in efficient controlled self-assembly in vivo.
We designed a set of control probes to interrogate each step in the proposed mechanism of C-SNAF (Fig. 1b). The lack of successful imaging by the inert D-ctrl precludes any changes to tumor physiology other than caspase-3/7 activity from contributing to the mechanism of C-SNAF, including the compromised membrane permeability associated with apoptosis. L-ctrl and L-ctrl-CN indicate that DEVD cleavage alone is insufficient for C-SNAF retention in apoptotic tissues, and nano-aggregation requires macrocyclization. The inefficient labeling of apoptotic cells by non-aggregatable PEG-ctrl further proved the requirement of nano-aggregation for C-SNAF retention in apoptotic cells (Supplementary Fig. S14). Pre-formed nano-aggregates ineffectively labeled apoptotic cells (Supplementary Fig. S13), demonstrating that nano-aggregation occurred intracellularly. Finally, the in situ self-assembled fluorescent nano-aggregates were directly observed with 3D-SIM in both apoptotic cells and chemotherapy-treated tumor tissue (Fig. 4), with excellent correlation of nano-aggregate size to measurements by DLS and TEM (Supplementary Fig. S16). Together, these results firmly establish the mechanism of caspase-3/7-triggered nano-aggregation in living animals.
C-SNAF was capable of serially detecting tumor response in vivo throughout the course of chemotherapy, with an increase in tumor fluorescence from the first to the third round of treatment (Fig. 5c). Moreover, the degree of maximum tumor fluorescence from C-SNAF strongly correlated with the maximum tumor size change at the end of chemotherapy. The evaluation of the degree of tumor response both longitudinally in a single mouse and relative to other mice receiving treatment provides valuable information regarding the efficacy of applied therapy to the individual. This, in conjunction with rapid, real-time, and non-invasive acquisition of this information, suggests that C-SNAF is highly feasible for imaging of drug-induced tumor apoptosis in vivo.
Our in situ self-assembly strategy has several advantages for in vivo molecular imaging. The small size of the probe ensures deeper tissue penetration and more extensive biodistribution48. The in situ nano-aggregation affords the activated probe a longer residence time in the target tissue of interest49 (e.g. apoptotic tumor tissue). The macrocyclization and self-assembly of the probe after proteolytic activation is bioorthogonal, permitting the continued activation of probe molecules by target enzymes. It is interesting to note that C-SNAF shows high specificity to caspase-3/7 over cathepsin B and legumain in vitro (Fig. 2b) while other caspase-3 activity-based probes have been reported cross-reactivity to legumain39 even though they all use the same DEVD recognition sequence. Finally, fluorescence quenching/dequenching as a popular imaging strategy can be readily integrated with our self-assembly approach (Supplementary Fig. S27).
In conclusion, we report here a novel strategy for directing in situ self-assembly of synthetic small molecules into nano-aggregates in living mice, and demonstrate its utility for imaging tumor response to chemotherapy. The proposed mechanism has been thoroughly validated using a series of control probes, and self-assembled nano-aggregates in vitro and in vivo have been directly visualized using superresolution fluorescence microscopy. The caspase-3/7-triggered bioorthogonal macrocyclization and nano-aggregation of C-SNAF allows for effective monitoring of tumor therapy response in vivo, and may also be applied to image caspase-3/7 activity in other disease (i.e., neurodegenerative diseases and organ transplant rejection). The same self-assembly strategy may be amenable to other molecular targets (i.e., furin, cathepsin), and opens up new avenues for molecular imaging probe design.
Methods
Synthetic procedures and chemical characterizations of all probes are described in the Supplementary Information.
Caspase-3-mediated macrocyclization in vitro
A solution of C-SNAF (25 μM) in 1 mL of caspase reaction buffer (50 mM HEPES, 100 mM NaCl, 1 mM EDTA, 10 mM tris(2-carboxyethyl) phosphine hydrochloride (TCEP), 10% glycerol, and 0.1% 3-[(3-Cholamidopropyl)dimethylammonio]-1-propanesulfonate (CHAPS) at pH 7.4) was incubated at room temperature (r.t.) for 10 min for efficient disulfide reduction. Human recombinant caspase-3 (4.9 × 10⁻³ U; 7.35 × 10⁻⁴ mg, Sigma) was then added to initiate the enzymatic reaction at 37 °C. The reaction was monitored by HPLC at 0, 1, 1.5, 2, 3, 4 and 6 h. The percentage conversion of the reaction was calculated based on the percentage of peak area of C-SNAF-cycl in the HPLC trace monitored at 675 nm.
Cell staining and epifluorescence microscopy imaging
HeLa (or MDA-MB-231) cells in #1.5 borosilicate 8-well chambered coverslips (Nunc) at 70% confluency were either left naive or treated with STS (2 μM) for 4 h. After removal of the medium, cells were incubated with 2 μM of C-SNAF, L-ctrl, or D-ctrl for 24 h. For the inhibition study, cells were first incubated with caspase inhibitor (Z-VAD-fmk, 50 μM) for 30 min before incubation with C-SNAF. The cells were then washed with PBS (1×) three times, and stained with Hoechst 33342 (2 μM) at 37 °C for 30 min. After rinsing with PBS (1×) several times, the medium was replaced and fluorescence images were acquired with DAPI and Cy5.5 filters. The images were processed using standard CRi Nuance software, analyzed using Image J software package (NIH), and presented at the same intensity scale for comparison.
3D-SIM imaging of self-assembled nanoparticles
HeLa cells on micro cover glass (22 × 22 mm, #1.5, VWR) were either left naive or treated with STS (2 μM) for 4 h, followed by incubation with 2 μM of C-SNAF-SIM or L-ctrl-SIM for 24 h. After removal of the medium, cells were 1) washed with PBS (1×) three times, 2) fixed with 2% paraformaldehyde (PFA) at 37 °C for 10 min and washed with PBS further three times, 3) then permeabilized with 0.1% Triton X-100 at 37 °C for 10 min and washed three times with PBS. Finally, the cover slips were mounted on microscope slides with mounting medium containing DAPI and sealed. For 3D-SIM on ex vivo tumor samples, HeLa tumor-bearing nude mice were treated with either saline or 8 mg/kg DOX three times, once every 4 days. Two days after the last treatment, 20 nmol of C-SNAF-SIM or L-ctrl-SIM were administered i.v. One hour later, mice were euthanized and the tumors were resected. Tumors were fixed in buffered formalin overnight, and then in 30% w/v sucrose solution overnight at 4 °C. Tumors were then bisected and frozen in optical cutting temperature medium (OCT). Ten-micron sections were cut and mounted on poly-L-lysine-coated coverslips (#1.5). The OCT was removed by washing with PBS (1×) three times, mounting medium containing DAPI was applied, and the samples were mounted on microscope slides and sealed. The superresolution images were acquired by 3D-SIM using a DeltaVision OMX imaging system (Applied precision) with simultaneous excitation at 408 nm for DAPI and 488 nm for Alexa 488, according to the standard procedure in the manufacturer instructions, and analyzed with an API DeltaVision OMX softWoRx image processing software. The 3D-SIM images were finally processed by Imaris (Bitplane, Inc.), and the size of self-assembling particles was analyzed using Image J (NIH) software package.
Chemotherapy mouse model
Animal care and euthanasia were done with the approval of the Administrative Panels on Laboratory Animal Care of Stanford University. To establish tumors in 6-week-old female nu/nu mice, 2 millions of HeLa cells suspended in 50 μL of a 50% v/v mixture of Matrigel in supplemented DMEM (10% FBS, 1% penstrep) were injected subcutaneously in the shoulders of the mouse. Tumors were grown until a single aspect was 0.7 to 0.9 cm (approx. 10–15 days), and then treatment consisting of 8 mg/kg DOX or saline was initiated through intravenous administration, once every 4 days for a total of three times. Total mouse body weight and tumor size (width and length by caliper) was measured every other day. Tumor volumes were calculated assuming an ellipsoid shape with the formula (length × width2)/2.
In vivo fluorescence imaging
Two days following the final treatment, 5 nmol of probe in saline was injected i.v. and fluorescence imaging began immediately on a Maestro hyperspectral fluorescent imaging system (PerkinElmer, MA, USA) using a 635±25 nm excitation filter and a 675 nm long-pass emission filter, with emission from 670 to 900 nm. Tissue autofluorescence and Cy5.5 fluorescence were deconvolved, and tumor fluorescence intensity was quantified by region of interest measurement using Nuance v.3.0.1.2 software (PerkinElmer, MA, USA).
Supplementary Material
Acknowledgments
This work was supported by the Stanford University National Cancer Institute (NCI) Centers of Cancer Nanotechnology Excellence (1U54CA151459-01), the NCI ICMIC@Stanford (1P50CA114747-06), and an IDEA award from Department of Defense Breast Cancer Research Program (W81XWH-09-1-0057). A.J.S. is supported by a postdoctoral fellowship from the Susan Komen Breast Cancer Foundation. We thank Dr. Andrew Olson at the Neuroscience Microscopy Service in Stanford University for assistance of 3D-SIM imaging.
Footnotes
Author Contributions
D.Y. performed all the compounds syntheses and characterizations, collected enzymatic reaction and carried out the cell imaging. D.Y. and A.J.S. performed the 3D-SIM studies. A.J.S. set up the animal model. A.J.S. and D.Y. performed the in vivo studies and A.J.S. analyzed the data. D.Y. and S.S.T. set up apoptotic cell model. D.Y. and L.C. performed the flow cytometry studies and analyzed the data. G.T. performed the TEM experiment. L.T. did the immunohistochemistry staining of the tumor tissue. All authors discussed the results and commented on the manuscript. D.Y., A.J.S., D.W.F. and J.R. co-wrote the paper.
Additional information
Supplementary information and chemical compound information are available in the online version of the paper. Reprints and permission information is available online at http://www.nature.com/reprints.
References
- 1.Whitesides GM, Mathias JP, Seto CT. Molecular self-assembly and nanochemistry: a chemical strategy for the synthesis of nanostructures. Science. 1991;254:1312–1319. doi: 10.1126/science.1962191. [DOI] [PubMed] [Google Scholar]
- 2.Capito RM, Azevedo HS, Velichko YS, Mata A, Stupp SI. Self-assembly of large and small molecules into hierarchically ordered sacs and membranes. Science. 2008;319:1812–1816. doi: 10.1126/science.1154586. [DOI] [PubMed] [Google Scholar]
- 3.O’Leary LE, Fallas JA, Bakota EL, Kang MK, Hartgerink JD. Multi-hierarchical self-assembly of a collagen mimetic peptide from triple helix to nanofibre and hydrogel. Nat Chem. 2011;3:821–828. doi: 10.1038/nchem.1123. [DOI] [PubMed] [Google Scholar]
- 4.Gazit E. Bioinspired chemistry: Diversity for self-assembly. Nat Chem. 2010;2:1010–1011. doi: 10.1038/nchem.912. [DOI] [PubMed] [Google Scholar]
- 5.Yang Z, Liang G, Xu B. Enzymatic hydrogelation of small molecules. Acc Chem Res. 2008;41:315–326. doi: 10.1021/ar7001914. [DOI] [PubMed] [Google Scholar]
- 6.Liang G, Ren H, Rao J. A biocompatible condensation reaction for controlled assembly of nanostructures in living cells. Nat Chem. 2010;2:54–60. doi: 10.1038/nchem.480. [DOI] [PMC free article] [PubMed] [Google Scholar]
- 7.Gao Y, Shi J, Yuan D, Xu B. Imaging enzyme-triggered self-assembly of small molecules inside live cells. Nat Commun. 2012;3:1033. doi: 10.1038/ncomms2040. [DOI] [PMC free article] [PubMed] [Google Scholar]
- 8.Adler-Abramovich L, et al. Phenylalanine assembly into toxic fibrils suggests amyloid etiology in phenylketonuria. Nat Chem Biol. 2012;8:701–706. doi: 10.1038/nchembio.1002. [DOI] [PubMed] [Google Scholar]
- 9.Williams RJ, et al. The in vivo performance of an enzyme-assisted self-assembled peptide/protein hydrogel. Biomaterials. 2011;32:5304–5310. doi: 10.1016/j.biomaterials.2011.03.078. [DOI] [PubMed] [Google Scholar]
- 10.Ye D, Liang G, Ma ML, Rao J. Controlling intracellular macrocyclization for the imaging of protease activity. Angew Chem Int Ed. 2011;50:2275–2279. doi: 10.1002/anie.201006140. [DOI] [PubMed] [Google Scholar]
- 11.Vemula PK, et al. On-demand drug delivery from self-assembled nanofibrous gels: a new approach for treatment of proteolytic disease. J Biomed Mater Res A. 2011;97:103–110. doi: 10.1002/jbm.a.33020. [DOI] [PubMed] [Google Scholar]
- 12.Saxon E, Bertozzi CR. Cell surface engineering by a modified Staudinger reaction. Science. 2000;287:2007–2010. doi: 10.1126/science.287.5460.2007. [DOI] [PubMed] [Google Scholar]
- 13.Lin FL, Hoyt HM, van Halbeek H, Bergman RG, Bertozzi CR. Mechanistic investigation of the staudinger ligation. J Am Chem Soc. 2005;127:2686–2695. doi: 10.1021/ja044461m. [DOI] [PubMed] [Google Scholar]
- 14.Agard NJ, Prescher JA, Bertozzi CR. A strain-promoted [3 + 2] azide-alkyne cycloaddition for covalent modification of biomolecules in living systems. J Am Chem Soc. 2004;126:15046–15047. doi: 10.1021/ja044996f. [DOI] [PubMed] [Google Scholar]
- 15.Ning X, Guo J, Wolfert MA, Boons GJ. Visualizing metabolically labeled glycoconjugates of living cells by copper-free and fast huisgen cycloadditions. Angew Chem Int Ed. 2008;47:2253–2255. doi: 10.1002/anie.200705456. [DOI] [PMC free article] [PubMed] [Google Scholar]
- 16.Devaraj NK, Upadhyay R, Haun JB, Hilderbrand SA, Weissleder R. Fast and sensitive pretargeted labeling of cancer cells through a tetrazine/trans-cyclooctene cycloaddition. Angew Chem Int Ed. 2009;48:7013–7016. doi: 10.1002/anie.200903233. [DOI] [PMC free article] [PubMed] [Google Scholar]
- 17.Blackman ML, Royzen M, Fox JM. Tetrazine ligation: fast bioconjugation based on inverse-electron-demand Diels-Alder reactivity. J Am Chem Soc. 2008;130:13518–13519. doi: 10.1021/ja8053805. [DOI] [PMC free article] [PubMed] [Google Scholar]
- 18.Lang K, Davis L, Torres-Kolbus J, Chou C, Deiters A, Chin JW. Genetically encoded norbornene directs site-specific cellular protein labelling via a rapid bioorthogonal reaction. Nat Chem. 2012;4:298–304. doi: 10.1038/nchem.1250. [DOI] [PMC free article] [PubMed] [Google Scholar]
- 19.Agarwal P, van der Weijden J, Sletten EM, Rabuka D, Bertozzi CR. A Pictet-Spengler ligation for protein chemical modification. Proc Natl Acad Sci U S A. 2013;110:46–51. doi: 10.1073/pnas.1213186110. [DOI] [PMC free article] [PubMed] [Google Scholar]
- 20.Yusop RM, Unciti-Broceta A, Johansson EM, Sanchez-Martin RM, Bradley M. Palladium-mediated intracellular chemistry. Nat Chem. 2011;3:239–243. doi: 10.1038/nchem.981. [DOI] [PubMed] [Google Scholar]
- 21.Chan J, Dodani SC, Chang CJ. Reaction-based small-molecule fluorescent probes for chemoselective bioimaging. Nat Chem. 2012;4:973–984. doi: 10.1038/nchem.1500. [DOI] [PMC free article] [PubMed] [Google Scholar]
- 22.Prescher JA, Dube DH, Bertozzi CR. Chemical remodelling of cell surfaces in living animals. Nature. 2004;430:873–877. doi: 10.1038/nature02791. [DOI] [PubMed] [Google Scholar]
- 23.Laughlin ST, Baskin JM, Amacher SL, Bertozzi CR. In vivo imaging of membrane-associated glycans in developing zebrafish. Science. 2008;320:664–667. doi: 10.1126/science.1155106. [DOI] [PMC free article] [PubMed] [Google Scholar]
- 24.Devaraj NK, Thurber GM, Keliher EJ, Marinelli B, Weissleder R. Reactive polymer enables efficient in vivo bioorthogonal chemistry. Proc Natl Acad Sci U S A. 2012;109:4762–4767. doi: 10.1073/pnas.1113466109. [DOI] [PMC free article] [PubMed] [Google Scholar]
- 25.Sletten EM, Bertozzi CR. From mechanism to mouse: a tale of two bioorthogonal reactions. Acc Chem Res. 2011;44:666–676. doi: 10.1021/ar200148z. [DOI] [PMC free article] [PubMed] [Google Scholar]
- 26.Ren H, et al. A biocompatible condensation reaction for the labeling of terminal cysteine residues on proteins. Angew Chem Int Ed. 2009;48:9658–9662. doi: 10.1002/anie.200903627. [DOI] [PMC free article] [PubMed] [Google Scholar]
- 27.Van de Bittner GC, Bertozzi CR, Chang CJ. Strategy for dual-analyte luciferin imaging: in vivo bioluminescence detection of hydrogen peroxide and caspase activity in a murine model of acute inflammation. J Am Chem Soc. 2013;135:1783–1795. doi: 10.1021/ja309078t. [DOI] [PMC free article] [PubMed] [Google Scholar]
- 28.Brindle K. New approaches for imaging tumour responses to treatment. Nat Rev Cancer. 2008;8:94–107. doi: 10.1038/nrc2289. [DOI] [PubMed] [Google Scholar]
- 29.Blankenberg FG. In vivo detection of apoptosis. J Nucl Med. 2008;49 (Suppl 2):81S–95S. doi: 10.2967/jnumed.107.045898. [DOI] [PubMed] [Google Scholar]
- 30.Nguyen QD, Smith G, Glaser M, Perumal M, Arstad E, Aboagye EO. Positron emission tomography imaging of drug-induced tumor apoptosis with a caspase-3/7 specific [18F]-labeled isatin sulfonamide. Proc Natl Acad Sci U S A. 2009;106:16375–16380. doi: 10.1073/pnas.0901310106. [DOI] [PMC free article] [PubMed] [Google Scholar]
- 31.Johnson JR, Kocher B, Barnett EM, Marasa J, Piwnica-Worms D. Caspase-activated cell-penetrating peptides reveal temporal coupling between endosomal release and apoptosis in an RGC-5 cell model. Bioconjugate Chem. 2012;23:1783–1793. doi: 10.1021/bc300036z. [DOI] [PMC free article] [PubMed] [Google Scholar]
- 32.Edgington LE, et al. Noninvasive optical imaging of apoptosis by caspase-targeted activity-based probes. Nat Med. 2009;15:967–973. doi: 10.1038/nm.1938. [DOI] [PMC free article] [PubMed] [Google Scholar]
- 33.Thornberry NA, et al. A combinatorial approach defines specificities of members of the caspase family and granzyme B. Functional relationships established for key mediators of apoptosis. J Biol Chem. 1997;272:17907–17911. doi: 10.1074/jbc.272.29.17907. [DOI] [PubMed] [Google Scholar]
- 34.Pozarowski P, et al. Interactions of fluorochrome-labeled caspase inhibitors with apoptotic cells: a caution in data interpretation. Cytometry A. 2003;55:50–60. doi: 10.1002/cyto.a.10074. [DOI] [PubMed] [Google Scholar]
- 35.Park D, et al. Noninvasive imaging of cell death using an Hsp90 ligand. J Am Chem Soc. 2011;133:2832–2835. doi: 10.1021/ja110226y. [DOI] [PMC free article] [PubMed] [Google Scholar]
- 36.Pace NJ, Pimental DR, Weerapana E. An inhibitor of glutathione S-transferase Omega 1 that selectively targets apoptotic cells. Angew Chem Int Ed. 2012;51:8365–8368. doi: 10.1002/anie.201203730. [DOI] [PubMed] [Google Scholar]
- 37.Tetko IV, et al. Virtual computational chemistry laboratory--design and description. J Comput Aided Mol Des. 2005;19:453–463. doi: 10.1007/s10822-005-8694-y. [DOI] [PubMed] [Google Scholar]
- 38.Maxwell D, Chang Q, Zhang X, Barnett EM, Piwnica-Worms D. An improved cell-penetrating, caspase-activatable, near-infrared fluorescent peptide for apoptosis imaging. Bioconjugate Chem. 2009;20:702–709. doi: 10.1021/bc800516n. [DOI] [PMC free article] [PubMed] [Google Scholar]
- 39.Edgington LE, Verdoes M, Bogyo M. Functional imaging of proteases: recent advances in the design and application of substrate-based and activity-based probes. Curr Opin Chem Biol. 2011;15:798–805. doi: 10.1016/j.cbpa.2011.10.012. [DOI] [PMC free article] [PubMed] [Google Scholar]
- 40.Stepczynska A, et al. Staurosporine and conventional anticancer drugs induce overlapping, yet distinct pathways of apoptosis and caspase activation. Oncogene. 2001;20:1193–1202. doi: 10.1038/sj.onc.1204221. [DOI] [PubMed] [Google Scholar]
- 41.Wang S, et al. Doxorubicin induces apoptosis in normal and tumor cells via distinctly different mechanisms. intermediacy of H2O2- and p53-dependent pathways. J Biol Chem. 2004;279:25535–25543. doi: 10.1074/jbc.M400944200. [DOI] [PubMed] [Google Scholar]
- 42.Schermelleh L, et al. Subdiffraction multicolor imaging of the nuclear periphery with 3D structured illumination microscopy. Science. 2008;320:1332–1336. doi: 10.1126/science.1156947. [DOI] [PMC free article] [PubMed] [Google Scholar]
- 43.Westphal V, et al. Video-rate far-field optical nanoscopy dissects synaptic vesicle movement. Science. 2008;320:246–249. doi: 10.1126/science.1154228. [DOI] [PubMed] [Google Scholar]
- 44.Wang K, et al. In vivo imaging of tumor apoptosis using histone H1-targeting peptide. J Control Release. 2010;148:283–291. doi: 10.1016/j.jconrel.2010.09.010. [DOI] [PubMed] [Google Scholar]
- 45.Brigham MP, Stein WH, Moore S. The concentrations of cysteine and cystine in human blood plasma. J Clin Invest. 1960;39:1633–1638. doi: 10.1172/JCI104186. [DOI] [PMC free article] [PubMed] [Google Scholar]
- 46.Salemi G, et al. Blood levels of homocysteine, cysteine, glutathione, folic acid, and vitamin B12 in the acute phase of atherothrombotic stroke. Neurol Sci. 2009;30:361–364. doi: 10.1007/s10072-009-0090-2. [DOI] [PubMed] [Google Scholar]
- 47.Cao CY, Shen YY, Wang JD, Li L, Liang GL. Controlled intracellular self-assembly of gadolinium nanoparticles as smart molecular MR contrast agents. Sci Rep. 2013;3:1024. doi: 10.1038/srep01024. [DOI] [PMC free article] [PubMed] [Google Scholar]
- 48.Wysocki LM, Lavis LD. Advances in the chemistry of small molecule fluorescent probes. Curr Opin Chem Biol. 2011;15:752–759. doi: 10.1016/j.cbpa.2011.10.013. [DOI] [PubMed] [Google Scholar]
- 49.Merian J, Gravier J, Navarro F, Texier I. Fluorescent nanoprobes dedicated to in vivo imaging: from preclinical validations to clinical translation. Molecules. 2012;17:5564–5591. doi: 10.3390/molecules17055564. [DOI] [PMC free article] [PubMed] [Google Scholar]
Associated Data
This section collects any data citations, data availability statements, or supplementary materials included in this article.