

Abstract
P/Q-type voltage-dependent calcium channels play key roles in transmitter release, integration of dendritic signals, generation of dendritic spikes, and gene expression. High intracellular calcium concentration transient produced by these channels is restricted to tens to hundreds of nanometers from the channels. Therefore, precise localization of these channels along the plasma membrane was long sought to decipher how each neuronal cell function is controlled. Here, we analyzed the distribution of Cav2.1 subunit of the P/Q-type channel using highly sensitive SDS-digested freeze-fracture replica labeling in the rat cerebellar Purkinje cells. The labeling efficiency was such that the number of immunogold particles in each parallel fiber active zone was comparable to that of functional channels calculated from previous reports. Two distinct patterns of Cav2.1 distribution, scattered and clustered, were found in Purkinje cells. The scattered Cav2.1 had a somatodendritic gradient with the density of immunogold particles increasing 2.5-fold from soma to distal dendrites. The other population with 74-fold higher density than the scattered particles was found within clusters of intramembrane particles on the P-face of soma and primary dendrites. Both populations of Cav2.1 were found as early as P3 and increased in the second postnatal week to a mature level. Using double immunogold labeling, we found that virtually all of the Cav2.1 clusters were colocalized with two types of calcium-activated potassium channels, BK and SK2, with the nearest neighbor distance of ∼40 nm. Calcium nanodomain created by the opening of Cav2.1 channels likely activates the two channels that limit the extent of depolarization.
Introduction
More than thousand-fold calcium concentration gradient exists across neuronal plasma membrane, and openings of voltage-dependent calcium channels (VDCCs) allow transient influx of Ca2+ that creates a distinct intracellular signal and precisely controls many cellular mechanisms. Due to diffusion and buffering, intracellular calcium signals rapidly collapses; thus, mechanisms dependent on such signal must be situated quite close to the site of influx. It is also well known that the membrane potential dynamics are not dictated solely by Na+ and K+ conductances but VDCCs can also contribute. For these reasons, subcellular localization of VDCCs is likely to be strategically arranged. Locations of VDCCs can be electrophysiologically hunted using outside-out patches but only from soma and large processes. Calcium imaging studies have visualized intracellular calcium concentration ([Ca2+]i) but with resolution limited to sub-micrometer range. Important neuronal functions such as vesicular release depend on [Ca2+]i increase within tens of nanometers from the calcium influx source (calcium nanodomain) and only electron microscopy has this resolution. Here, we used highly sensitive SDS-digested freeze-fracture replica labeling (SDS-FRL) for Cav2.1 subunit to visualize the two-dimensional distribution of P/Q-type VDCCs along the plasma membrane.
Among the various types of VDCCs, the P/Q-type (Cav2.1) has a prevailing role in a number of neuronal functions and is most abundant in Purkinje cells (PCs) (Westenbroek et al., 1995). The Cav2.1 channels play key roles in the generation of dendritic spikes (Tank et al., 1988) after climbing fiber (CF) activation (Davie et al., 2008) or strong parallel fiber (PF) activation (Rancz and Häusser, 2006) and in the amplification of EPSPs in the distal dendrites (De Schutter and Bower, 1994). The Cav2.1 channels also have indispensable roles in the postnatal development of the cerebellar circuitry. Cav2.1 fuels heterosynaptic competition between climbing and parallel fibers and also homosynaptic competition among multiple climbing fibers in developing cerebellum (Miyazaki et al., 2004; Hashimoto et al., 2011).
In this study, we found somatodendritic gradient of Cav2.1 distribution and somatic coclustering of the Cav2.1 with calcium-activated potassium channels (KCa), BK and SK2, in PCs. Calcium imaging studies showed higher and quicker [Ca2+]i changes in the fine dendrites compared with the thicker dendrites during bursts of calcium spikes in PCs (Lev-Ram et al., 1992). Somatodendritic gradient of Cav2.1 was studied to understand whether the difference in [Ca2+]i dynamics is due to the difference in Cav2.1 density or merely due to the difference in surface-to-volume ratio. It has also been shown that the calcium influx through Cav2.1 mainly fuels activation of both BK and SK2 subtypes of KCa in PC (Womack et al., 2004). Such activation of KCa underlies the characteristic after-hyperpolarization following calcium spikes in PCs (Edgerton and Reinhart, 2003) and may result in bidirectional effects on excitability (Montgomery and Meredith, 2012). We studied the spatial coupling between Cav2.1 and KCa to understand how the activation of KCa is regulated.
Materials and Methods
Animals.
Wistar rats at postnatal days (P) 3, 7, 14, 21, 28 (n = 3 each for P3–P21, n = 4 for P28) and young adults (8 weeks, n = 3), Cav2.1 knock-out (KO), adult SK2 KO, adult BK KO, and wild-type mice were used (n = 3 each). The rats and mice were raised on a 12 h light/dark cycle with water and food ad libitum. All animal experiments were conducted in accordance with the guidelines of the National Institute for Physiological Science's Animal Care and Use Committee.
Generation of Cav2.1 antibody.
Cav2.1 antibody was raised in the guinea pig against 361–400 aa residues of mouse Cav2.1 (GenBank, U7616). This sequence is a part of the intracellular loop between I-S6 and II S-1. Glutathione S-transferase (GST) fusion protein containing the sequence was expressed in E. coli and purified using Glutathione-Sepharose 4B (GE Healthcare). The fusion protein was emulsified with Freund's complete or incomplete adjuvant (DIFCO) and injected subcutaneously into female guinea pigs at intervals of 2 weeks. From antisera, specific antibodies were purified using GST-free polypeptides coupled to Sepharose 4B (GE Healthcare).
SDS-FRL.
SDS-FRL was performed with some modifications (Masugi-Tokita and Shigemoto, 2007; Masugi-Tokita et al., 2007; Tarusawa et al., 2009; Kasugai et al., 2010) of the technique developed by Fujimoto (1995). The rats were anesthetized with sodium pentobarbital (50 mg/kg, i.p.) and perfused transcardially with 25 mm PBS for 1 min, followed by perfusion with 2% paraformaldehyde (PFA) and 15% saturated picric acid solution in 0.1 m phosphate buffer (PB) for 12 min. Sagittal or coronal slices (130 μm thick) were cut using a vibrating microslicer (Linear-Pro7, Dosaka) in 0.1 m PB. Regions from middle lobules containing granule cell, Purkinje cell, and molecular layers were trimmed from cerebellar slices. The trimmed slices were immersed in graded glycerol of 10–30% in 0.1 m PB at 4°C overnight and then rapidly frozen by a high pressure freezing machine (HPM010, BAL-TEC, Balzers). Frozen samples were fractured into two parts at −140°C (−120°C for SK2 KO) and replicated by carbon deposition (2 nm thick), platinum (uni-direction from 60°, 2 nm), and carbon (15 nm) in a freeze-fracture replica machine (JFD II, JEOL). Tissue debris was dissolved with gentle shaking at 80°C for 18 h in a solution containing 15 mm Tris-HCl, pH 8.3, 20% sucrose, and 2.5% SDS. For P3 samples, tissue debris was dissolved in a solution containing 15 mm Tris-HCl, pH 6.8, 20% sucrose, and 2.5% SDS. The replicas were washed three times in 50 mm Tris-buffered saline (TBS), pH 7.4, containing 0.05% bovine serum albumin (BSA) and blocked with 5% BSA in the washing buffer for 1 h at room temperature. The replicas were then incubated with the guinea pig primary antibody against Cav2.1 subunit of P/Q type calcium channel (8 μg/ml) overnight at 15°C followed by incubation with anti-guinea pig secondary antibodies conjugated with 5 nm gold particles [BBI (British Biocell International)] overnight at 15°C. The specificity of the Cav2.1 antibody was confirmed by testing cerebellar tissue from Cav2.1 KO mice (Jun et al., 1999). Immunogold particles for Cav2.1 were mostly abolished in the KO tissue (see Results). Colocalization of Cav2.1 with calcium-activated potassium channels was examined with double labeling with rabbit antibodies against BK channel (Kaufmann et al., 2009, 2010) and SK2 channel (Cueni et al., 2008). For double labeling for Cav2.1 with BK channel, SK2 channel, or vesicle glutamate transporter 1 (vGluT1), replicas were first reacted with the Cav2.1 antibody (8 μg/ml) and then anti-guinea pig secondary antibody followed by incubation with the BK antibody (4 μg/ml), SK2 antibody (3 μg/ml), or vGlut1 antibody (8.3 μg/ml), then anti-rabbit secondary antibody for BK and SK2 or anti-mouse secondary antibody for vGluT1. After immunogold labeling, the replicas were rinsed three times with 0.05% BSA/TBS, washed with TBS and distilled water, and picked up onto grids coated with pioloform (Agar Scientific).
Measurement of intramembrane particle cluster area and quantification of the density of immunogold particles.
The labeled replicas were examined using a transmission electron microscope (Tecnai-12; FEI) and photographed at magnifications of 13,500, 26,500, and 97,000. The Cav2.1 antibody used in this study showed labeling concentrated on the protoplasmic face (P-face) of the plasma membrane, whereas no specific labeling was found on the exoplasmic face (E-face). The area of intramembrane particle (IMP) clusters was delineated manually using iTEM software (Olympus Soft Imaging Solutions). Immunogold particles within 30 nm from the edge of IMP clusters were included in the analysis based on the possible distance of the immunogold particle from the epitope (Matsubara et al., 1996). For the measurement of immunogold particle density, profiles of soma and dendrites were tilted to make then as flat as possible. Background labeling was measured on the P-face of the Purkinje cell soma in Cav2.1 KO mice.
Data analysis.
Statistical analysis was conducted with SPSS 16.0 (SPSS). Data are presented as mean ±SD unless otherwise stated. Normal distribution was checked using Shapiro–Wilk's test. Student's t test or ANOVA was used for data with normal distribution. For data violating normal distribution assumption we used Kruskal—Wallis's test for checking significant difference. Pairwise Mann–Whitney U test and Bonferroni correction was used if significant difference was found after Kruskal—Wallis's test. Data from three animals (P3, P7, P14, P21) and four animals (P28) were pooled together when no statistical significance was detected. Correlation was checked using Spearman's rank-order test. Differences between groups were judged to be significant at p < 0.05.
Analysis of spatial distance between Cav2.1 and calcium activated-potassium channels.
The XY coordinates for 5 nm gold particles (Cav2.1) and 10 nm gold particles (either BK or SK2) were plotted using iTEM software. Using a macro written in-house for the Excel software, we measured the nearest neighbor distances (NNDs) between the 5 nm gold particles and the 10 nm gold particles. Distances between the two particles were then compared with those between the real Cav2.1 and the random BK or SK2 distributions. Random distributions were generated by first counting the number of BK or SK2 in each profile. Then, the same number of particles was distributed randomly within the same delineated area of the IMP cluster. In the real distributions, we found that the closest NND between Cav2.1 was 12 and 14 nm for BK and SK2, respectively. Steric hindrance likely determines the closest distance that the two particles can reside. Therefore, the random distributions were created with a constraint that no BK or SK2 location could be closer than 12 nm (BK) or 14 nm (SK2) from the location of the real Cav2.1 particles. Fifty of these random distributions were created for each profile analyzed. Distributions of the real and simulated NND were compared using the Kolmogorov–Smirnov test (KS-test) and judged to be significant at p < 0.05.
Counting the number of synapse per parallel fiber bouton.
Rats (P17, n = 2) were anesthetized with sodium pentobarbital (50 mg/kg, i.p.) and perfused transcardially with 25 mm PBS, followed by perfusion with 0.8% of PFA and 1.5% of glutaraldehyde in 0.1 m PB, pH 7.4, for 12 min. Coronal sections (50 μm thick) were cut using a vibrating microslicer (VT-1000S, Leica) in 0.1 m PB. After washing in 0.1 m PB several times, sections were treated with 1% OsO4 in 0.1 m PB for 1 h, stained with 2% uranyl acetate, dehydrated in graded ethanol, and flat-embedded in Durcupan resin (Fluka, Sigma Aldrich). Serial ultrathin sections were prepared at 70 nm thickness (Ultracut S; Leica) and images of parallel fiber boutons were captured from the beginning to the end of each bouton at magnification of 15,000 or 25,000. Parallel fiber-spine synapses were identified based on asymmetrical synapses with a terminal containing round loosely aggregated synaptic vesicles (Palay and Chan-Palay, 1974).
Results
Sensitivity and specificity of SDS-FRL for Cav2.1 subunit
We previously reported the presence of concentrated Cav2.1 at the presynaptic active zone of PF to PC synapses and at the postsynaptic PC spines in the perisynaptic areas using pre-embedding immunogold method (Kulik et al., 2004). To accurately visualize the two-dimensional distribution of the channels along the plasma membrane and to analyze lower channel densities quantitatively, highly sensitive immunogold labeling in SDS-digested freeze-fracture replica (SDS-FRL) (Tanaka et al., 2005; Masugi-Tokita and Shigemoto, 2007; Lörincz and Nusser, 2010) was used in this study. A new antibody raised against an intracellular loop of Cav2.1 (Hashimoto et al., 2011; Miyazaki et al., 2012) was used for the SDS-FRL in the rat cerebellum. Immunogold particles for Cav2.1 were specifically distributed on the P-face in both presynaptic and postsynaptic profiles. As the epitope site is located at the intracellular portion of the protein, the immunogold particles were found on the P-face area. Virtually no labeling was observed on the E-face or on the cross-fractured face. Layers of the cerebellar cortex could be easily identified in our replicas (see Fig. 2A) and we first evaluated the sensitivity and specificity of our replica labeling for Cav2.1 by focusing on the well-characterized presynaptic active zone of PF-PC synapses (Mintz et al., 1995; Kulik et al., 2004). The active zone of PF-PC synapses was identified (Fig. 1A,B) based on (1) the typical morphology consisting of concave shape of the P-face, higher density of intramembrane particles (IMPs) than in the surrounding areas, and dimples representing vesicle exocytosis or endocytosis (Pfenninger et al., 1972; Hagiwara et al., 2005), and by (2) the double labeling for vesicular glutamate transporter vGluT1 (Fig. 1A, white arrowheads), which is selectively expressed in PF boutons in the molecular layer (Zander et al., 2010). Although vGluTs are vesicular proteins, they are often detected on presynaptic plasma membrane and thus have been used to identify the origin of presynaptic profiles (Hagiwara et al., 2005; Masugi-Tokita et al., 2007). We occasionally found small regions that were double labeled for vGluT1 and Cav2.1 that were not on a concave P-face profile but on a flat P-face profile in the molecular layer (data not shown). These profiles were likely to originate from PF-interneuron synapses because they lacked the concave shape and the number of PF-interneuron synapses is overwhelmed by that of PF-PC synapses (Palkovits et al., 1971; Palay and Chan-Palay, 1974). Immunogold particles for Cav2.1 were concentrated in the presynaptic active zone of PF boutons as described previously (Kulik et al., 2004). These particles were not homogenously distributed throughout the active zone and small aggregations of particles were found (Fig. 1B, arrowheads). A recent report of the axon terminal of CA3 pyramidal cells also revealed non-homogenous distribution of immunogold particle labeled for Cav2.1 and seemingly formed small clusters (Holderith et al., 2012). At P28, the number of particles for Cav2.1 within the active zone was highly variable and ranged from 6 to 43 per active zone (Fig. 1C; mean = 17.1, median = 15, interquartile range = 11–21, n = 58 active zone profiles from three animals). This range was similar to that of functional Cav2.1 channel numbers deduced from calcium imaging and electrophysiological studies (14.5 to 27.3, see Discussion) indicating a high sensitivity of our SDS-FRL for Cav2.1.
Figure 2.

Two distinct localization patterns of Cav2.1 in Purkinje cells. A, The molecular layer (ML), Purkinje cell layer (PL), and granule cell layer (GL) are identifiable under low magnification of a replica image. B, The P-face of soma and proximal dendrite of a PC labeled for Cav2.1 (5 nm). Immunogold particles for Cav2.1 were found concentrated within IMP clusters (red) and scattered throughout the plasma membrane (blue). The Cav2.1-labeled IMP clusters were diffusely distributed in the soma and proximal dendrite. C, D, Scattered Cav2.1 particles in soma (C) and distal dendrites (D) showing isolated particles (black arrowheads) and small aggregations (white arrowheads). E, F, Clusters of immunogold particles for Cav2.1 were associated with IMP clusters. G, The two distinct patterns of Cav2.1 localization, clustered and scattered (black arrowheads for isolated particles and a white arrowhead for a small aggregation), were also seen in wild-type mice. H, The labeling for Cav2.1 within and outside of IMP clusters was absent in Cav2.1 KO mice. Scale bars: A, 50 μm; B, 5 μm; C, D, 100 nm; E–H, 200 nm.
Figure 1.

Localization of Cav2.1 in the presynaptic active zone of parallel fiber boutons. A, The P-face and cross-fractured face of a parallel fiber bouton at P28 showing synaptic vesicles (arrows) and active zone indicated by concave shape of the P-face, high density of IMPs, and dimples (black arrowheads) representing vesicle exocytosis or endocytosis. PF boutons were identified with labeling for vGluT1 (10 nm particles, white arrowheads). B, Small clusters of immunogold particles for Cav2.1 (5 nm particles, arrowheads) were found within the active zone structure. C, High variability of number of Cav2.1 particles (range: 6–43) was found in PF boutons at P28. Box chart shows fifth, 25th, 75th, and 95th percentiles, median (bar), and mean (square). D, In the wild-type mice (Cav2.1+/+), clustered gold particles for Cav2.1 (10 nm) were found at PF presynaptic active zone (P-face) with opposing postsynaptic sites (E-face) labeled for AMPA receptors (5 nm). E, The immunogold labeling for Cav2.1 was abolished in the Cav2.1 KO mice (Cav2.1−/−), while AMPA receptor labeling (5 nm) remained. Scale bars: A, 500 nm; B–E, 200 nm.
The specificity of the replica labeling for Cav2.1 was confirmed using wild-type and Cav2.1 KO mice (Fig. 1D,E). We found concentrated particles for Cav2.1 in the PF presynaptic active zone in wild-type mice (mean = 17.7, median = 18, interquartile range = 12–21, n = 47 active zone from three animals) similar to those in rats but not in the KO mice (mean = 0.65, median = 0, interquartile range = 0–1, n = 31 active zone from three animals).
Two distinct patterns of Cav2.1 distribution in PCs
We next examined the distribution of Cav2.1 subunit in P28 PCs. Immunogold particles for Cav2.1 were observed throughout the soma and dendrites of PCs (Fig. 2B) with two distinct patterns of distribution: scattered (Fig. 2C,D) and clustered (Fig. 2E,F). The scattered pattern consists of dispersed single (isolated) particles and small aggregation of particles (3–10 particles with <30 nm distance from the closest particle) that were found both on the P-face of soma (Fig. 2B,C) and on proximal to distal dendrites (Fig. 2D) of PCs. The clustered pattern of Cav2.1 immunogold particles were found within IMP clusters that were sparsely distributed on the P-face of soma and very proximal dendrites but not distal parts of the dendrites (Fig. 2B shown in red, n = 7 PCs from 4 animals). The dendrites containing the clustered particles were mostly primary dendrites within 20 μm from the soma. IMPs are small convex-shaped particles found in replica material and are assumed to reflect the presence of some membrane proteins. We defined IMP cluster as a group of >10 big IMPs (diameter > 8.6 nm) with NND between each IMP shorter than 25 nm. Virtually all of these P-face IMP clusters had concentrated particles for Cav2.1 (Fig. 2E,F), showing much larger numbers of particles within the IMP clusters than the small aggregation in the scattered pattern. The Cav2.1 immunoparticle density within the IMP clusters was 73 times higher (soma, 426.0 ± 131.3 particles/μm2, n = 73; proximal dendrite, 421.2 ± 163.2 particles/μm2, n = 40) than the density of the scattered particles (5.8 ± 1.68 particles/μm2, n = 4 in soma). The density of the Cav2.1-labeled IMP cluster was not significantly different between soma and primary dendrite (soma, 8.1 ± 2.1 cluster/100 μm2, n = 4, measured area 900 μm2; primary dendrite, 8.0 ± 3.5 cluster/100 μm2, n = 9, measured area 600 μm2, p = 0.950, Student's t test). Size of the Cav2.1-labeled IMP clusters was also similar between soma and primary dendrite (soma, median = 0.090 μm2, n = 73; primary dendrite, median = 0.132 μm2, n = 41, p = 0.93 with Mann–Whitney U test).
Specificity of the labeling for Cav2.1 in soma and dendrite was verified using wild-type and Cav2.1 KO mice. As in rats, scattered and clustered distribution patterns of Cav2.1 were found in wild-type mice (Fig. 2G, arrowheads for the scattered pattern). In Cav2.1 KO mice, no clustered immunogold particles were found (Fig. 2H). The density of scattered particles in Cav2.1 KO mice (0.42 ± 0.22 particles/μm2, n = 4 soma in 3 animals) were significantly lower than that in wild-type mice (2.3 ± 0.48 particles/μm2, n = 3 soma in 3 animals, p = 0.01). Interestingly, the density of the IMP cluster in soma of Cav2.1 KO mice was reduced 2.3 times compared with wild-type mice (wild-type mice, 10.3 ± 6.1 cluster/100 μm2 n = 9 soma in 5 animals; Cav2.1 KO mice, 4.4 ± 1.3 cluster/100 μm2, n = 4 soma in 3 animals, p = 0.006, Mann–Whitney U test).
Perisynaptic localization of Cav2.1 and colocalization with mGluR1α in PC spines
Using the pre-embedding immunogold method, we previously reported that Cav2.1 were concentrated close to the postsynaptic density in PC spines (Kulik et al., 2004). In the present study, we verified using SDS-FRL that Cav2.1 were distributed at a high density surrounding postsynaptic membrane specialization of PF-PC synapses (Fig. 3) in paired replicas containing spines continuous with adjacent PC dendrites (Fig. 3A,D). A sample is separated into two parts upon freeze-fracturing, and corresponding P-face and E-face profiles of the same structure can be found in the paired replicas. Postsynaptic specialization of excitatory synapse is signified by the presence of distinct IMP clusters on the E-face (Harris and Landis, 1986). Immunogold particles for Cav2.1 were found on the P-face in areas surrounding the spine synapses (Fig. 3C,F) demarcated by the IMP cluster area projected from the corresponding E-face (Fig. 3B,E). These Cav2.1 particles were colocalized with those for metabotropic glutamate receptor mGluR1α (Fig. 3C,F), which has been also reported to be concentrated in the perisynaptic regions (Baude et al., 1993; Lujan et al., 1996) and interact directly with Cav2.1 (Kitano et al., 2003).
Figure 3.

Perisynaptic localization of Cav2.1 and colocalization with mGluR1α in Purkinje cell spines. A, D, Low-magnification pictures showing spines protruding from PC dendrites. Areas in boxes are magnified in C and F. These areas show the P-face of PC spines. B, E, Corresponding locations to the boxed areas in A and D were searched on the complimentary replica. The E-face of the spines had IMP clusters indicative of excitatory postsynaptic structure. Gray lines indicate the boundaries of synapses. Note that the corresponding replicas appear as mirrored images, thus one of the pictures (showing the E-face of synapses) was flipped to allow straightforward comparison with the other (C, F, showing the P-face of the same synapse). In C and F, the boundaries of the synapse determined in the E-face replica (B, E) were projected onto the P-face. Labelings for mGluR1α (10 nm) and Cav2.1 (5 nm, arrowheads) were found colocalized near the boundary of the synapse. Scale bars: A, D, 500 nm; B, C, E, F, 100 nm.
Density gradient of the scattered Cav2.1 along PC dendrites
Density of various ion channels in dendrites has been shown to be non-homogenous, and a gradient of the density along the proximal–distal axis has been demonstrated in pyramidal cells (Magee, 1998; Lörincz et al., 2002, Lörincz and Nusser, 2010) and other types of cells (Williams and Stuart, 2000; Endo et al., 2008). It has been shown that non-homogenous distribution of channels can have a great impact on the integration of dendritic signals (Magee and Johnston, 1995; Endo et al., 2008). To evaluate whether such density gradient along PC dendrites exists for Cav2.1, we measured the density of the scattered Cav2.1 particles in primary, secondary, and distal dendrites at P28. The primary dendrite was identified as the dendrite continuum with the soma before the first major division (Fig. 2). Dendrites with diameter larger than 2 μm found in the proximal half of the molecular layer were defined as secondary dendrites and dendrites with diameter smaller than 2 μm found in the distal half of the molecular layer were defined as distal dendrites. Graded increase in the density of the scattered Cav2.1 particles was found from the soma to the distal dendrites (Fig. 4A). Distal dendrites had 2.5 times higher density of scattered Cav2.1 particles than soma and primary dendrites (Fig. 4A; p = 0.001 for soma vs distal dendrites; p = 0.003 for primary vs distal dendrites, Kruskal–Wallis test, pairwise Mann–Whitney U test, and Bonferroni correction). As described in a previous section (Fig. 2), scattered Cav2.1 particles can be subdivided into isolated particles and particles forming small aggregations. The density of isolated Cav2.1 particles in distal dendrites was also significantly higher than that in soma (Fig. 4B; p = 0.004, Kruskal–Wallis test, pairwise Mann–Whitney U test, and Bonferroni correction). The density of the small aggregation was also 2.7 times higher in distal dendrites than in soma (Fig. 4C, p = 0.003, Kruskal–Wallis test, pairwise Mann–Whitney U test, and Bonferroni correction).
Figure 4.
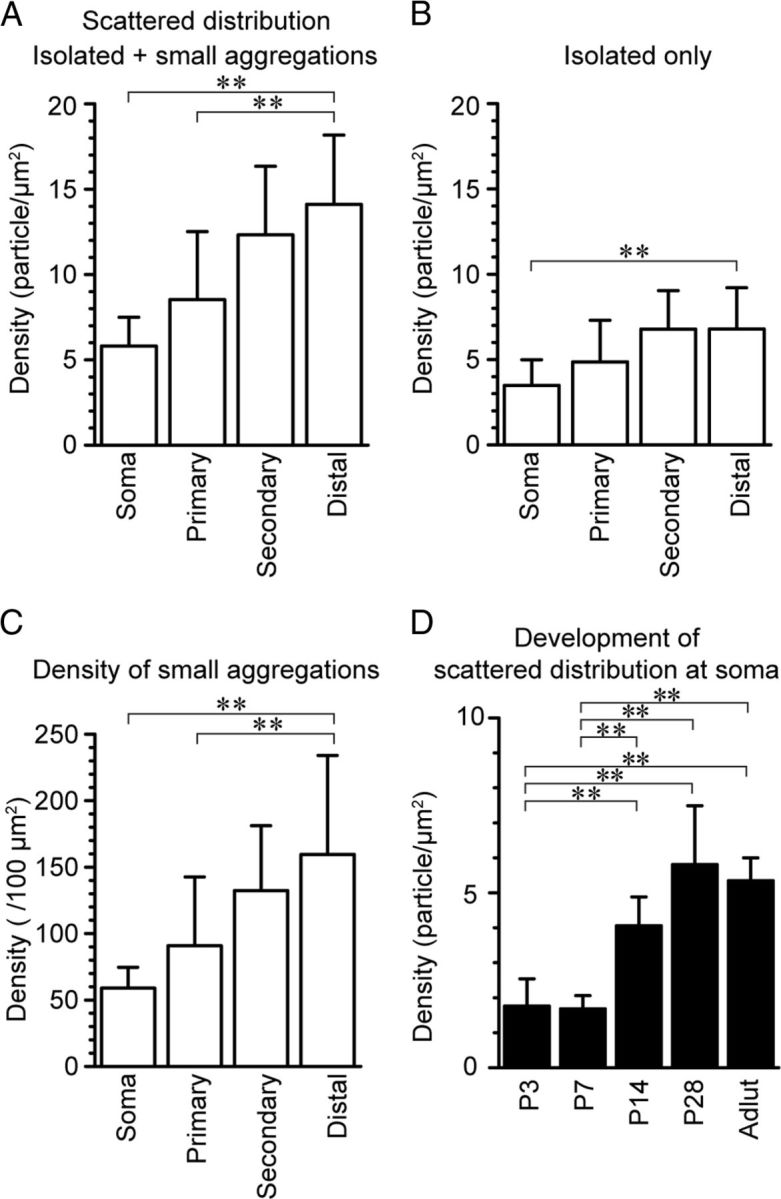
Density gradient of the scattered Cav2.1 along Purkinje soma and dendrites. A, Density of the scattered Cav2.1 particles (including both isolated particles and those within small aggregations) increased from soma to distal dendrites. (soma = 5.81 ± 1.68 /μm2; primary dendrite = 8.53 ± 3.99 /μm2; secondary dendrite = 12.3 ± 4.01 /μm2; distal dendrite = 14.1 ± 4.06 /μm2; measured area = 700–900 μm2). B, Out of all scattered Cav2.1 particles, the density of isolated particles only was extracted. The density increase from the soma to distal dendrites was also observed for the isolated particles (soma = 3.49 ± 1.50 /μm2; primary dendrite = 4.86 ± 2.44 /μm2; secondary dendrite = 6.78 ± 2.26 /μm2; distal dendrite = 6.80 ± 2.41 /μm2; measured area = 700–900 μm2). C, The number of the small aggregation of Cav2.1 particles was counted and the density of such small aggregations was calculated. The density of the small aggregation also increased from soma to distal dendrites (soma = 59.0 ± 15.7/100 μm2; primary dendrite = 90.9 ± 51.8/100 μm2; secondary dendrite = 132.3 ± 48.9/100 μm2; distal dendrite = 159.6 ± 74.4 /μm2; measured area = 700–900 μm2, Kruskal–Wallis test, pairwise Mann–Whitney U test with Bonferroni correction). D, Developmental increase of the density of scattered Cav2.1 particles was seen at PC soma after the second postnatal week (P3 = 1.76 ± 0.78 /μm2; P7 = 1.68 ± 0.38 /μm2; P14 = 4.06 ± 0.82 /μm2; P28 = 5.81 ± 1.68 /μm2; adult = 5.34 ± 0.65 /μm2; measured area = 500–1000 μm2, ANOVA Tukey's test). *p < 0.05; **p < 0.01.
Development of scattered and clustered Cav2.1 distributions
Next, developmental change in Cav2.1 distribution was examined. First, the density of the scattered Cav2.1 immunogold particles at the soma, including both the isolated particles and particles forming small aggregations, from P3 to adult was compared (Fig. 4D). The density of the scattered Cav2.1 particles was low at P3 and P7 but the density significantly increased at the second postnatal week (p = 0.007 for P3 vs P14, p = 0.01 for P7 vs P14, ANOVA and Tukey's test). The scattered particle density remained constant at later ages. When we compared the density of the scattered Cav2.1 particles with the density of the clustered particles within each P-face IMP cluster, we found a relative increase in the density of the scattered particles with development (ratios of scattered particle density over clustered particle density, P3 = 0.0057, P7 = 0.0035, P14 = 0.0091, P28 = 0.014, adult = 0.030).
Next, development of the clustered distribution pattern of Cav2.1 was examined. We observed such clustered distribution in soma at all ages examined (Fig. 5A–D). The size of Cav2.1-labeled IMP clusters (Fig. 5E) significantly increased from P7 to P14 (p = 0.000), remained constant until P28, but increased again in the adult (p = 0.000 for adult vs P7, P14, P21, and P28, Kruskal–Wallis test, pairwise Mann–Whitney U test, and Bonferroni correction). The number of immunogold particles within each IMP cluster (Fig. 5F) significantly increased from P7 to P28 (p = 0.000, Kruskal–Wallis test, pairwise Mann–Whitney U test, and Bonferroni correction) but decreased in adult (p = 0.001 for adult and P21; p = 0.031 for adult and P28 Kruskal–Wallis test, pairwise Mann–Whitney U test, and Bonferroni correction). The density of Cav2.1 particles in IMP clusters was similar among P7, P14, and P28 (426 to 474 particles/μm2), although it was slightly higher in P21 (499 particles/μm2), but significantly decreased in adult (175 particles/μm2, p = 0.000, for adult vs P7, P14, P21, P28, Kruskal–Wallis test, pairwise Mann–Whitney U test, and Bonferroni correction). At all ages, the IMP cluster size and the particle number showed a strong positive correlation (Fig. 5G; r = 0.84, 0.91, 0.94, 0.91, 0.51 for P7, P14, P21, P28, and adult, respectively, p = 0.000 for each age, Spearman's rank-order test, n = 62–73). We also examined the density of the Cav2.1-labeled IMP clusters at the soma and found a significant increase from P3 and P7 to P28 and adult (Fig. 5H; p < 0.05 for P3 and 7 vs P28 and adult, total measured area 500–1000 μm2). These results demonstrate that the Cav2.1-labeled IMP clusters at the PC cell body develop rapidly at around the second postnatal week with an additional developmental change continuing even after the fourth postnatal week.
Figure 5.

Developmental changes of P-face IMP clusters labeled for Cav2.1 in Purkinje cell soma. A–D, P-face IMP clusters labeled for Cav2.1 at P7 (A), P14 (B), P28 (C), and adult (D). E, F, Cumulative frequency plots for the IMP cluster size (E) and number of Cav2.1 particles within each IMP cluster (F). Significant differences in the IMP cluster size was observed between P7 and P14 and between P28 and adult. The number of Cav2.1 particles was significantly increased from P7 to P28, and decreased from P21 to adult (IMP cluster size: P7 = 0.060 ± 0.043 μm2; P14 = 0.101 ± 0.077 μm2; P21 = 0.097 ± 0.085 μm2; P28 = 0.103 ± 0.090 μm2; adult = 0.181 ± 0.171 μm2; number of Cav2.1 particles; P7 = 23.8 ± 21.0 particles; P14 = 42.4 ± 34.0 particles; P21 = 46.3 ± 42.0 particles; P28 = 38.9 ± 35.0 particles; adult = 29.4 ± 26.5 particles; Kruskal–Wallis, pairwise Mann–Whitney U test with Bonferroni correction). G, Positive correlation was found between the number of Cav2.1 particles and the IMP cluster size in all observed ages. The IMP cluster size and the number of Cav2.1 particles concurrently increased, thus the density (signified in the slope of the scattered plots) remained similar from P7 to P28 but significantly reduced in adult. H, Density of IMP clusters increased in PC soma during postnatal development (P3 = 3.53 ± 1.75 clusters/100 μm2; P7 = 4.51 ± 1.22 clusters/100 μm2; P14 = 6.72 ± 0.78 clusters/100 μm2; P28 = 8.12 ± 2.13 clusters/100 μm2; adult = 9.28 ± 2.35 clusters/100 μm2; ANOVA with Tukey's test). I, Cumulative frequency plots of NNDs of Cav2.1 particles within the IMP cluster (Real) and randomly distributed NNDs generated using the same numbers of particles and IMP cluster areas (Random). The real NND was significantly smaller than the random NND, indicating clustering of Cav2.1 within the IMP cluster. *p < 0.05, **p < 0.01, ***p = 0.000.
The Cav2.1 particles appeared not to be evenly distributed throughout the IMP cluster area (Fig. 5). To examine whether these particles are randomly distributed or clustered within the IMP cluster area, the NNDs between each immunogold particle were measured and the distribution of these NNDs was compared with that of randomly distributed NNDs that were generated with the same particle numbers and IMP cluster areas. We found that the distribution of the real NNDs was significantly different from that of the random NNDs (p < 0.01 Kolmogorov–Smirnov test) and the real NNDs had a smaller median value (real, median = 23.5 nm, n = 719; random, median = 24.1 nm, n = 1292, p = 0.03, Mann–Whitney U test). This indicates the presence of tight clustering of Cav2.1 within the IMP cluster, which is likely to be actively regulated.
Colocalization of Cav2.1 with calcium-activated potassium channels within the calcium nanodomain
Previous studies show that a subtype of calcium-activated potassium channel (KCa), BK channel, also has two distinct types of localization, a scattered pattern and a clustered pattern, at the somatic plasma membrane of PCs and pyramidal cells (Kaufmann et al., 2009, 2010). Electrophysiological experiments demonstrate that the activation of BK as well as another KCa, SK2 channels, is regulated by calcium influx through P/Q-type VDCCs (Womack et al., 2004). To understand the spatial relationship between Cav2.1 and BK and SK2 channels, colocalization of the channels were examined by double labeling with 5 and 10 nm immunogold particles (Fig. 6). First, using single labeling, immunogold particles for BK or SK2 channels were found concentrated in the P-face IMP clusters at PC soma (Fig. 6A,B). Such distribution looked very similar to the clustered distribution pattern of the Cav2.1. Double immunogold labeling revealed striking colocalization of Cav2.1 with BK or SK2 channels in these IMP clusters (Fig. 6C,D). It should be noted that application of two different primary antibodies in double labeling experiment could lead to false negative results due to the interference between the two antibodies that results in a decreased labeling efficiency. To minimize the underestimation of colocalization, we applied the two antibodies sequentially with reversed orders in the double labeling experiments (Kasugai et al., 2010). We found virtually 100% colocalization of Cav2.1 with either BK or SK2 channels in the IMP cluster area (Table 1). Conversely, no noticeable colocalization of the scattered Cav2.1 with either of BK or SK2 channels was observed in PC, although particles for BK and SK2 also showed scattered distribution in soma, dendrites, and spines (data not shown). The colocalization with the KCa particles was not observed even for the small aggregation of Cav2.1 particles.
Figure 6.

Calcium nanodomain formation with clustered Cav2.1, BK and SK2 channels in Purkinje cell soma and proximal dendrites. A, B, Single labeling for BK or SK2 channels in the PC soma showing concentrated particles within the P-face IMP clusters. C, D, Double labeling for Cav2.1 (5 nm, black arrowheads) and either BK (10 nm, white arrowheads) or SK2 (10 nm, white arrowheads) channels revealed that these KCa channels are colocalized with Cav2.1 in the IMP clusters at PC soma. E, F, Double labeling for Cav2.1 (5 nm) and either BK (10 nm) or SK2 (10 nm) in BK KO (E) or SK2 KO (F) mice, respectively. The labeling for BK and SK2 channels disappeared in the respective KO mice verifying the labeling specificity. Labeling for Cav2.1 persisted in the IMP clusters in both KO mice. Scale bar, 200 nm.
Table 1.
Colocalization of Cav2.1 with BK and SK2 channels in IMP clusters
| Antibody applied first | Antibody applied second | Proportion [% (total number tested)] of double-labeled IMP clusters in those labeled by antibody applied second |
||
|---|---|---|---|---|
| Rat 1 | Rat 2 | Rat 3 | ||
| Cav2.1 | BK | 100 (88) | 96 (54) | |
| BK | Cav2.1 | 100 (98) | 100 (51) | |
| Cav2.1 | SK2 | 100 (45) | 100 (74) | |
| SK2 | Cav2.1 | 100 (53) | 100 (88) | |
We confirmed the specificity of our BK and SK2 labeling using replica specimens from BK and SK2 KO mice (Fig. 6E,F). Immunogold particles for BK or SK2 channels were mostly abolished in the respective KO mice (BK KO, 0.25 ± 0.12 particles/μm2, WT mice, 5.24 ± 1.80 particles/μm2; SK2 KO, 0.069 ± 0.056 particles/μm2, WT mice, 2.41 ± 0.53 particles/μm2), but those for Cav2.1 remained. The density of IMP clusters found in BK and SK2 KO soma was also reduced to half compared with those in wild-type mice (wild-type mice, 10.3 ± 6.1 cluster/100 μm2 n = 9 soma in 5 animals; BK KO mice, 4.5 ± 1.0 cluster/100 μm2 n = 4 soma in 3 animals, p = 0.003 vs wild-type; SK2 KO mice, 4.8 ± 2.3 cluster/100 μm2, n = 5 soma in 3 animals, p = 0.019 vs wild-type, Mann–Whitney U test).
As the [Ca2+]i rapidly decreases with increase in distance from the calcium influx source, the distance between Cav2.1 and KCa would likely determine the efficacy of KCa activation following Cav2.1 activation. To examine the extent of the spatial coupling between these channels, the NNDs between immunogold particles for Cav2.1 (5 nm) with immunogold particles for BK or SK2 (10 nm) were measured in our double-labeled replicas at P28. The median of the NNDs between Cav2.1 and either BK or SK2 particles were 37.8 nm (interquartile range, 27.3–60.3 nm) and 38.9 nm (interquartile range, 29.9–49.5 nm), respectively. Although these median values were not significantly different (p = 0.69, Mann–Whitney U test), distributions of these two kinds of NNDs showed significant difference (p = 0.019 for Kolmogorov–Smirnov test). To examine specific spatial association of Cav2.1 with BK or SK2 channels, random distributions for BK and SK2 particles were generated within the IMP cluster areas and the NNDs between these particles and the real Cav2.1 particles were measured. We found significantly smaller NNDs for the real SK2 and Cav2.1 particles (median, 38.9 nm) than for the randomly distributed SK2 particles (median, 43.9 nm p < 0.05, Mann–Whitney U test, p = 0.001, Kolmogorov–Smirnov test, Fig. 7B), whereas no significant difference was detected between the real and random NNDs for BK toward Cav2.1 (Fig. 7A). This result suggests that SK2 but not BK channels are specifically targeted to have close association with Cav2.1 channels. However, as these three channels do colocalize within the same IMP cluster areas, the distance between Cav2.1 and BK or SK2 channels is already very close. Thus, both types of KCa are likely to be within the calcium nanodomain created by the Cav2.1 activation at the soma and proximal dendrites of PCs.
Figure 7.

NNDs between Cav2.1 and BK or SK2 channels. A, B, NNDs between BK (A) or SK2 (B) and Cav2.1 particles within the P-face IMP clusters were analyzed. In both cases, median of NND was quite small (∼40 nm) suggesting calcium nanodomain formation. These NNDs (Real) were compared with randomly distributed NNDs (Random) generated using the same numbers of BK or SK2 particles same IMP cluster areas. The real NNDs were significantly smaller than the random NNDs for Cav2.1 and SK2 (p = 0.019, Man–Whitney U test, p = 0.001, Kolmogorov–Smirnov test) but not for Cav2.1 and BK.
Discussion
This study provides the two-dimensional distribution of VDCC along the plasma membrane using highly sensitive SDS-FRL. Due to the lack of decent antibodies, only a few previous studies have described the VDCC distribution using conventional pre-embedding immunogold methods (Hanson and Smith, 2002; Kulik et al., 2004; Parajuli et al., 2010). Knowing the precise localization of the channel at nano-scale resolution is of especial value for the VDCCs as the calcium signal created by these channels is often restricted to the nanodomain and thus the VDCCs are likely to be carefully arranged to serve finely-tuned cellular functions. Among the various VDCCs, Cav2.1 is of particular importance in cerebellar functions. We confirmed the Cav2.1 localization in the presynaptic active zone of PF-PC synapses and perisynaptic site at PC spines. We further discovered two distinct patterns of Cav2.1 distribution in PCs, the scattered and the clustered patterns. The scattered Cav2.1 is distributed non-uniformly from soma to distal dendrite with graded increase in its density. The clustered Cav2.1 is concentrated within IMP clusters on PC soma and proximal dendrites, and colocalized with two types of KCa, BK and SK2, making calcium nanodomains. These two distinct types of localization are developmentally regulated, becoming mostly mature in the second postnatal week. Our findings provide better understanding of distinct functional roles for Cav2.1 in the cerebellar network.
The number and the labeling efficiency of Cav2.1 channels in presynaptic active zone
Although recording of any cellular activity at the small presynaptic terminal is often demanding with either electrophysiological or imaging techniques, several reports provided indirect clues that enabled us to estimate the number of functional Cav2.1 in PF presynaptic active zones. We used these estimates to assess the labeling efficiency of Cav2.1 with our SDS-FRL. By using two-photon calcium concentration imaging, Brenowitz and Regehr (2007) estimated that the number of calcium ions entering a PF bouton upon presynaptic action potential firing is 11,000 on average. Therefore, the charge influx via calcium channels should be twice this number times the charge of an electron. A single PF bouton has 1.05–1.12 active zones on average in young rodents (Napper and Harvey, 1988; Kurihara et al., 1997). Using serial ultrathin sections, we found 1.09 synapses per single PF bouton on average in P17 rat (n = 145 boutons from 2 animals, data not shown). The calculated charge influx should be divided by this number to obtain the charge influx per active zone. Cav2.1 channels mediate 50% of the calcium concentration increase with presynaptic action potential at P9–P14 (Mintz et al., 1995). Therefore, charge influx through Cav2.1 channels is calculated as 1.62 fC.
The ensemble average of the expected charge carried by a single calcium channel in response to a presynaptic action potential can be calculated as follows. Bischofberger et al. (2002) measured the total calcium influx in a mossy fiber bouton as 119 fC on average by direct presynaptic recording. Using nonstationary fluctuation analysis of the calcium current in the same preparation, Li et al. (2007) estimated that the total number of calcium channels present is 2007 on average. These results indicate that 59.3 aC is the expected charge carried by a single calcium channel. Another estimate of the expected charge influx through single calcium channel can be obtained by using the gating model of the P/Q-type calcium channel (Li et al., 2007), and it was calculated as 112 aC (P. Jonas, personal communication). If we divide the total Cav2.1 channel-mediated charge influx per PF active zone (1.62 fC), with the expected charge influx through single channels, we obtain 14.5–27.3 as the expected number of functional P/Q-type channels present. Our SDS-FRL showed 17.1 Cav2.1 particles on average in a single PF active zone, giving the estimated labeling efficiency of 62.6–118%. Although these are approximate estimates, the sensitivity of our SDS-FRL for Cav2.1 was expected to be very high and likely to be similar to that for functional AMPA receptors, which was close to unity (Tanaka et al., 2005). Brenowitz and Regehr (2007) found heterogeneity in the amplitude of presynaptic calcium transients in response to single action potentials among PF boutons (CV = ∼0.40). This is consistent with our results showing a large variability of Cav2.1 particles per active zone (6 to 43, CV = 0.47). The size of the PF-PC synapse was similarly variable ranging from 0.04 to 0.36 μm2 (0.15 ± 0.08 μm2, CV = 0.53) (Harris and Stevens, 1988). Since a positive correlation was found between the number of Cav2.1 and the area of presynaptic active zone, the variability of the total Cav2.1 number is at least partly ascribable to the variability of the synapse size.
Functional role of the Cav2.1 gradient along PC dendrite and its development
VDCCs localized to the PC dendrites induce dendritic spikes after CF activation (Llinás and Sugimori, 1980) or strong PF activation (Llinás and Nicholson, 1971). Dendritic spikes were shown to be initiated at 10–25 μm from the PC soma (Pouille et el., 2000). The disappearance of clustered Cav2.1 coincides with this location of dendritic spike initiation, which suggests that the scattered rather than the clustered Cav2.1 channels take part in the dendritic spike initiation and its propagation.
Previous calcium imaging studies showed larger increases of [Ca2+]i during bursts of calcium spikes in the thinner dendrites of PCs (Ross et al., 1990; Lev-Ram et al., 1992). The difference in the surface-to-volume ratio and/or the difference in the VDCC density could explain such phenomenon. Our results indicate that the density gradient of the scattered Cav2.1 contributes to the difference in [Ca2+]i signals in the distal and proximal dendrites.
Gradient increase of VDCC density from soma to dendrites has been described for L-type channels in globus pallidus neurons (Hanson and Smith, 2002) and low-voltage-activated calcium channels in deep cerebellar nuclei neurons (Gauck et al., 2001). Such gradient as well as the preferential positioning of VDCCs in perisynaptic sites as found in our studies could have a role in amplifying and modifying synaptic signals (Hanson and Smith, 2002). Developmental change of the non-homogenous distribution of Cav2.1 along the dendrite could also have a role in the emergence of trimodal pattern activity upon maturation of the cerebellum (Womack and Khodakhah, 2002).
Increases in the area of the IMP clusters, the number of Cav2.1 within the clusters, and the density of the scattered Cav2.1 were found to occur from the first to second postnatal week. Previous studies reported that Cav2.1 in PCs is essential for homosynaptic competition among multiple CFs (Miyazaki et al., 2004), heterosynaptic competition between CF and PF (Miyazaki et al., 2012), and refining process at early phase (around P12) of CF synapse elimination (Hashimoto et al., 2011). The developmental change of Cav2.1 distribution after the first postnatal week is likely to take a role in such maturation process of the cerebellar circuit.
Calcium nanodomain in PC soma and proximal dendrites
Based on electrophysiological experiments using exogenous calcium chelators, EGTA and BAPTA, local calcium signaling domain was classified into: (1) “calcium nanodomain” (∼20–50 nm from the calcium source) that is effectively interfered by BAPTA but not EGTA, and (2) “calcium microdomain” (50 nm to a few hundred nanometers from the calcium source) that is sensitive to both BAPTA and EGTA (Neher, 1998). In the present study, two types of KCa, BK and SK2, were found to colocalize with Cav2.1 in the nanodomain range (∼40 nm NND) within P-face IMP clusters.
It has been reported that the outward current mediated by BK is strong enough to counteract the inward current delivered by the activation of Cav2.1 during dendritic spikes and contributes to afterhyperpolarization in Purkinje cells (Raman and Bean, 1999; Rancz and Häusser, 2010). Direct interaction of Cav2.1 and BK proteins was also found by copurification of these two molecules from rat brain in tandem mass spectrometry (Berkefeld et al., 2006). On the other hand, activation of SK2 has been reported to control the firing frequency of PCs (Edgerton and Reinhart, 2003). These two KCa differ in their affinity to calcium with BK having lower affinity (3∼50 μm) (Womack and Khodakhah, 2002) than the SK2 (300 nm, Bond et al., 1999). Furthermore, we found closer association of SK2 than BK in their spatial relationship to the Cav2.1. More instant interaction of SK2 than BK with Cav2.1 in the same nanodomain can contribute to the precise regulation of firing frequency of PCs. In episodic ataxia 2 (EA2) model mice, reduced activation of SK channels associated with a decrease in the P/Q-type calcium current (Barclay et al., 2001) caused decreases in the precision of PC pacemaking (Walter et al., 2006). Furthermore, pharmacological increase of SK channel activity recovered not only the pacemaking but also ataxia. In BK KO mice, reduced spontaneous activity of PCs due to depolarization-induced inactivation of action potential mechanism was associated with cerebellar ataxia (Sausbier et al., 2004). The nanodomain formed with Cav2.1 and these two KCa channels may thus contribute to cerebellar coordination through different mechanisms.
The P-face IMP clusters in PC soma have been shown to overlay subsurface cisterns (Henkart et al., 1976; Kaufmann et al., 2009), which are enriched with inositol 1,4,5-triphosphate receptors (IP3R) and ryanodine receptor (RyR) (Walton et al., 1991). A small domain of plasma membrane along with the adjacent junctional endoplasmic reticulum has been suggested to function as coordinated units and such complex has been termed “plasmerosomes” (Blaustein and Golovina, 2001). Reduced density of IMP clusters on Purkinje cell bodies in KO mice of Cav2.1, BK, and SK2 suggests that interactions between these molecules may contribute to the formation of the plasmerosomes. Junctophilins, a family of junctional membrane complex protein, have been shown to contribute to the formation of complex between endoplasmic/sarcoplasmic reticulum and plasma membranes in cardiac myocytes (Takeshima et al., 2000) and support Ca2+-mediated communication between RyR and SK2 (Kakizawa et al., 2007). It is possible that our newly found calcium nanodomain formed by Cav2.1, BK, and SK2 is functionally coupled to IP3R and RyR on the subsurface cistern as well, and the intricate interactions among these channels could fine-tune PC excitability.
Footnotes
This work was supported by Core Research for Evolutional Science and Technology- Japan Science and Technology (CREST, JST). We thank Hee-Sup Shin for providing Cav2.1 knock-out (KO) mice, Hans-Guenther Knaus for BK antibody, John P. Adelman for providing SK2 KO mice, Yasushi Satoh and Takahiro Nakata for preparation of BK KO mice, and Elek Molar for pan AMPAR antibody.
References
- Barclay J, Balaguero N, Mione M, Ackerman SL, Letts VA, Brodbeck J, Canti C, Meir A, Page KM, Kusumi K, Perez-Reyes E, Lander ES, Frankel WN, Gardiner RM, Dolphin AC, Rees M. Ducky mouse phenotype of epilepsy and ataxia is associated with mutations in the Cacna2d2 gene and decreased calcium channel current in cerebellar Purkinje cells. J Neurosci. 2001;21:6095–6104. doi: 10.1523/JNEUROSCI.21-16-06095.2001. [DOI] [PMC free article] [PubMed] [Google Scholar]
- Baude A, Nusser Z, Roberts JD, Mulvihill E, McIlhinney RA, Somogyi P. The metabotropic glutamate receptor (mGluR1α) is concentrated at perisynaptic membrane of neuronal subpopulations as detected by immunogold reaction. Neuron. 1993;11:771–787. doi: 10.1016/0896-6273(93)90086-7. [DOI] [PubMed] [Google Scholar]
- Berkefeld H, Sailer CA, Bildl W, Rohde V, Thumfart JO, Eble S, Klugbauer N, Reisinger E, Bischofberger J, Oliver D, Knaus HG, Schulte U, Fakler B. BKca-Cav channel complexes mediate rapid and localized Ca2+-activated K+ signaling. Science. 2006;314:615–620. doi: 10.1126/science.1132915. [DOI] [PubMed] [Google Scholar]
- Bischofberger J, Geiger JR, Jonas P. Timing and efficacy of Ca2+ channel activation in hippocampal mossy fiber boutons. J Neurosci. 2002;22:10593–10602. doi: 10.1523/JNEUROSCI.22-24-10593.2002. [DOI] [PMC free article] [PubMed] [Google Scholar]
- Blaustein MP, Golovina VA. Structural complexity and functional diversity of endoplasmic reticulum Ca2+ stores. Trends Neurosci. 2001;24:602–608. doi: 10.1016/s0166-2236(00)01891-9. [DOI] [PubMed] [Google Scholar]
- Bond CT, Maylie J, Adelman JP. Small-conductance calciumactivated potassium channels. Ann NY Acad Sci. 1999;868:370–378. doi: 10.1111/j.1749-6632.1999.tb11298.x. [DOI] [PubMed] [Google Scholar]
- Brenowitz SD, Regehr WG. Reliability and heterogeneity of calcium signaling at single presynaptic boutons of cerebellar granule cells. J Neurosci. 2007;27:7888–7898. doi: 10.1523/JNEUROSCI.1064-07.2007. [DOI] [PMC free article] [PubMed] [Google Scholar]
- Cueni L, Canepari M, Luján R, Emmenegger Y, Watanabe M, Bond CT, Franken P, Adelman JP, Lüthi A. T-type Ca2+ channels, SK2 channels and SERCAs gate sleep-related oscillations in thalamic dendrites. Nat Neurosci. 2008;11:683–692. doi: 10.1038/nn.2124. [DOI] [PubMed] [Google Scholar]
- Davie JT, Clark BA, Häusser M. The origin of the complex spike in cerebellar Purkinje cells. J Neurosci. 2008;28:7599–7609. doi: 10.1523/JNEUROSCI.0559-08.2008. [DOI] [PMC free article] [PubMed] [Google Scholar]
- De Schutter E, Bower JM. Simulated responses of cerebellar Purkinje cells are independent of the dendritic location of granule cell synaptic inputs. Proc Natl Acad Sci U S A. 1994;91:4736–4740. doi: 10.1073/pnas.91.11.4736. [DOI] [PMC free article] [PubMed] [Google Scholar]
- Edgerton JR, Reinhart PH. Distinct contributions of small and large conductance Ca2+-activated K+ channels to rat Purkinje neuron function. J Physiol. 2003;548:53–69. doi: 10.1113/jphysiol.2002.027854. [DOI] [PMC free article] [PubMed] [Google Scholar]
- Endo T, Tarusawa E, Notomi T, Kaneda K, Hirabayashi M, Shigemoto R, Isa T. Dendritic Ih ensures high-fidelity dendritic spike responses of motion-sensitive neurons in rat superior colliculus. J Neurophysiol. 2008;99:2066–2076. doi: 10.1152/jn.00556.2007. [DOI] [PubMed] [Google Scholar]
- Fujimoto K. Freeze-fracture replica electron microscopy combined with SDS digesstion for cytochemical labeling for integral membrane proteins. Application to the immunogold labeling of intercellular junctional complexes. J Cell Sci. 1995;108:3443–3449. doi: 10.1242/jcs.108.11.3443. [DOI] [PubMed] [Google Scholar]
- Gauck V, Thomann M, Jaeger D, Borst A. Spatial distribution of low- and high-voltage-activated calcium currents in neurons of the deep cerebellar nuclei. J Neurosci. 2001;21:RC158. doi: 10.1523/JNEUROSCI.21-15-j0004.2001. [DOI] [PMC free article] [PubMed] [Google Scholar]
- Hagiwara A, Fukazawa Y, Deguchi-Tawarada M, Ohtsuka T, Shigemoto R. Differential distribution of release-related proteins in the hippocampal Ca3 area as revealed by freeze-fracture replica labeling. J Comp Neurol. 2005;489:195–216. doi: 10.1002/cne.20633. [DOI] [PubMed] [Google Scholar]
- Hanson JE, Smith Y. Subcellular distribution of high-voltage activated calcium channel subtypes in rat globus pallidus neurons. J Comp Neurol. 2002;442:89–98. doi: 10.1002/cne.10075. [DOI] [PubMed] [Google Scholar]
- Harris KM, Landis DM. Membrane structure at synaptic junctions in area CA1 of the rat hippocampus. Neuroscience. 1986;19:857–872. doi: 10.1016/0306-4522(86)90304-0. [DOI] [PubMed] [Google Scholar]
- Harris KM, Stevens JK. Dendritic spines of rat cerebellar Purkinje cells: serial electron microscopy with reference to their biophysical characteristics. J Neurosci. 1988;8:4455–4469. doi: 10.1523/JNEUROSCI.08-12-04455.1988. [DOI] [PMC free article] [PubMed] [Google Scholar]
- Hashimoto K, Tsujita M, Miyazaki T, Kitamura K, Yamazaki M, Shin HS, Watanabe M, Sakimura K, Kano M. Postynaptic P/Q-type Ca2+ channel in Purkinje cell mediates synaptic competition and elimination in developing cerebellum. Proc Natl Acad Sci U S A. 2011;108:9987–9992. doi: 10.1073/pnas.1101488108. [DOI] [PMC free article] [PubMed] [Google Scholar]
- Henkart M, Landis DM, Reese TS. Similarity of junctions between plasma membranes and endoplasmic reticulum in muscle and neurons. J Cell Biol. 1976;70:338–347. doi: 10.1083/jcb.70.2.338. [DOI] [PMC free article] [PubMed] [Google Scholar]
- Holderith N, Lorincz A, Katona G, Rózsa B, Kulik A, Watanabe M, Nusser Z. Release probability of hippocampal glutamatergic terminals scales with the size of the active zone. Nat Neurosci. 2012;15:988–997. doi: 10.1038/nn.3137. [DOI] [PMC free article] [PubMed] [Google Scholar]
- Jun K, Piedras-Rentería, Smith SM, Wheeler DB, Lee SB, Lee TG, Chin H, Adams ME, Scheller RH, Tsien RW, Shin HS. Ablation of PyQ-type Ca21 channel currents, altered synaptic transmission, and progressive ataxia in mice lacking the α1A-subunit. Proc Natl Acad Sci U S A. 1999;96:15245–15250. doi: 10.1073/pnas.96.26.15245. [DOI] [PMC free article] [PubMed] [Google Scholar]
- Kakizawa S, Kishimoto Y, Hashimoto K, Miyazaki T, Furutani K, Shimizu H, Fukaya M, Nishi M, Sakagami H, Ikeda A, Kondo H, Kano M, Watanabe M, Iino M, Takeshima H. Junctophilin-mediated channel crosstalk essential for cerebellar synaptic plasticity. EMBO J. 2007;26:1924–1933. doi: 10.1038/sj.emboj.7601639. [DOI] [PMC free article] [PubMed] [Google Scholar]
- Kasugai Y, Swinny JD, Roberts JD, Dalezios Y, Fukazawa Y, Sieghart W, Shigemoto R, Somogyi P. Quantitative localisation of synaptic and extrasynaptic GABAA receptor subunits on hippocampal pyramidal cells by freeze-fracture replica immunolabelling. Eur J Neurosci. 2010;32:1868–1888. doi: 10.1111/j.1460-9568.2010.07473.x. [DOI] [PMC free article] [PubMed] [Google Scholar]
- Kaufmann WA, Ferraguti F, Fukazawa Y, Kasugai Y, Shigemoto R, Laake P, Sexton JA, Ruth P, Wietzorrek G, Knaus HG, Storm JF, Ottersen OP. Large conductance calcium-activated potassium channels in Purkinje cell plasma membranes are clustered at sites of hypolemmal microdomains. J Comp Neurol. 2009;515:215–230. doi: 10.1002/cne.22066. [DOI] [PubMed] [Google Scholar]
- Kaufmann WA, Kasugai Y, Ferraguti F, Storm JF. Two distinct pools of large-conductance calcium-activated potassium channels in the somatic plasma membrane of central principal neurons. Neuroscience. 2010;169:974–986. doi: 10.1016/j.neuroscience.2010.05.070. [DOI] [PMC free article] [PubMed] [Google Scholar]
- Kitano J, Nishida M, Itsukaichi Y, Minami I, Ogawa M, Hirano T, Mori Y, Nakanishi S. Direct interaction and functional coupling between metabotropic glutamate receptor subtyoe 1 and voltage-sensitive Cav2.1 Ca2+ channel. J Biol Chem. 2003;278:25101–25108. doi: 10.1074/jbc.M303266200. [DOI] [PubMed] [Google Scholar]
- Kulik A, Nakadate K, Hagiwara A, Fukazawa Y, Luján R, Saito H, Suzuki N, Futatsugi A, Mikoshiba K, Frotscher M, Shigemoto R. Immunocytochemical localization of the α1A subunit of the P/Q-type calcium channel in the rat cerebellum. Eur J Neurosci. 2004;19:2169–2178. doi: 10.1111/j.0953-816X.2004.03319.x. [DOI] [PubMed] [Google Scholar]
- Kurihara H, Hashimoto K, Kano M, Takayama C, Sakimura K, Mishina M, Inoue Y, Watanabe M. Impaired parallel fiber → Purkinje cell synapse stabilization during cerebellar development of mutant mice lacking the glutamate receptor delta2 subunit. J Neurosci. 1997;17:9613–9623. doi: 10.1523/JNEUROSCI.17-24-09613.1997. [DOI] [PMC free article] [PubMed] [Google Scholar]
- Lev-Ram V, Miyakawa H, Lasser-Ross N, Ross WN. Calcium transients in cerebellar evoked by intracellular stimulation. J Neurophysiol. 1992;68:1167–1177. doi: 10.1152/jn.1992.68.4.1167. [DOI] [PubMed] [Google Scholar]
- Li L, Bischofberger J, Jonas P. Differential gating and recruitment of P/Q-, N-, and R-type Ca2+ channels in hippocampal mossy fiber boutons. J Neurosci. 2007;27:13420–13429. doi: 10.1523/JNEUROSCI.1709-07.2007. [DOI] [PMC free article] [PubMed] [Google Scholar]
- Llinás R, Nicholson C. Electrophysiological properties of dendrites and somata in alligator Purkinje cells. J Neurophysiol. 1971;34:532–551. doi: 10.1152/jn.1971.34.4.532. [DOI] [PubMed] [Google Scholar]
- Llinás R, Sugimori M. Electrophysiological properties of in vitro Purkinje cell dendrites in mammalian cerebellar slices. J Physiol. 1980;205:197–213. doi: 10.1113/jphysiol.1980.sp013358. [DOI] [PMC free article] [PubMed] [Google Scholar]
- Lörincz A, Nusser Z. Molecular identity of dendritic voltage-gated sodium channels. Science. 2010;328:906–909. doi: 10.1126/science.1187958. [DOI] [PMC free article] [PubMed] [Google Scholar]
- Lörincz A, Notomi T, Tamás G, Shigemoto R, Nusser Z. Polarized and compartment-dependent distribution of HCN1 in pyramidal cell dendrites. Nat Neurosci. 2002;5:1185–1193. doi: 10.1038/nn962. [DOI] [PubMed] [Google Scholar]
- Lujan R, Nusser Z, Roberts JD, Shigemoto R, Somogyi P. Perisynaptic localization of metabotropic glutamate receptors mGluR1 and mGluR5 on dendrites and dendritic spines in the rat hippocampus. Eur J Neurosci. 1996;8:1488–1500. doi: 10.1111/j.1460-9568.1996.tb01611.x. [DOI] [PubMed] [Google Scholar]
- Magee JC. Dendritic hyperpolarization-activated currents modify the integrative properties of hippocampal CA1 pyramidal neurons. J Neurosci. 1998;18:7613–7624. doi: 10.1523/JNEUROSCI.18-19-07613.1998. [DOI] [PMC free article] [PubMed] [Google Scholar]
- Magee JC, Johnston D. Synaptic activation of voltage-gated channels in the dendrites of hippocampal pyramidal neurons. Science. 1995;268:301–304. doi: 10.1126/science.7716525. [DOI] [PubMed] [Google Scholar]
- Masugi-Tokita M, Shigemoto R. High-resolution quantitative visualization of glutamate and GABA receptors at central synapses. Curr Opin Neurobiol. 2007;17:387–393. doi: 10.1016/j.conb.2007.04.012. [DOI] [PubMed] [Google Scholar]
- Masugi-Tokita M, Tarusawa E, Watanabe M, Molnár E, Fujimoto K, Shigemoto R. Number and density of AMPA receptors in individual synapses in the rat cerebellum as revealed by SDS-digested freeze-fracture replica labeling. J Neurosci. 2007;27:2135–2144. doi: 10.1523/JNEUROSCI.2861-06.2007. [DOI] [PMC free article] [PubMed] [Google Scholar]
- Matsubara A, Laake JH, Davanger S, Usami S, Ottersen OP. Organization of AMPA receptor subunits at a glutamate synapse: a quantitative immunogold analysis of hair cell synapses in the rat organ of Corti. J Neurosci. 1996;16:4457–4467. doi: 10.1523/JNEUROSCI.16-14-04457.1996. [DOI] [PMC free article] [PubMed] [Google Scholar]
- Mintz IM, Sabatini BL, Regehr WG. Calcium control of transmitter release at a cerebellar synapse. Neuron. 1995;15:675–688. doi: 10.1016/0896-6273(95)90155-8. [DOI] [PubMed] [Google Scholar]
- Miyazaki T, Hashimoto K, Shin HS, Kano M, Watanabe M. P/Q type Ca2+ channel a1A regulates synaptic competition on developing cerebellar Purkinje cells. J Neurosci. 2004;24:1734–1743. doi: 10.1523/JNEUROSCI.4208-03.2004. [DOI] [PMC free article] [PubMed] [Google Scholar]
- Miyazaki T, Yamasaki M, Hashimoto K, Yamazaki M, Abe M, Usui H, Kano M, Sakimura K, Watanabe M. Cav2.1 in cerebellar Purkinje cells regulates competitive excitatory synaptic wiring, cell survival, and cerebellar biochemical compartmentalization. J Neurosci. 2012;32:1311–1328. doi: 10.1523/JNEUROSCI.2755-11.2012. [DOI] [PMC free article] [PubMed] [Google Scholar]
- Montgomery JR, Meredith AL. Genetic activation of BK currents in vivo generates bidirectional effects on neuronal excitability. Proc Natl Acad Sci U S A. 2012;109:18997–19002. doi: 10.1073/pnas.1205573109. [DOI] [PMC free article] [PubMed] [Google Scholar]
- Napper RM, Harvey RJ. Number of parallel fiber synapse on an individual Purkinje cell in the cerebellum of the rat. J Comp Neurol. 1988;274:168–177. doi: 10.1002/cne.902740204. [DOI] [PubMed] [Google Scholar]
- Neher E. Vesicle pools and Ca2+ microdomains: new tools for understanding their roles in neurotransmitter release. Neuron. 1998;20:389–399. doi: 10.1016/s0896-6273(00)80983-6. [DOI] [PubMed] [Google Scholar]
- Palay S, Chan-Palay V. Cerebellar cortex. New York: Springer; 1974. [Google Scholar]
- Palkovits M, Magyar P, Szentágothai J. Quantitative histological analysis of the cerebellar cortex in the cat. 3. Strucutral organization of the molecular layer. Brain Res. 1971;34:1–18. doi: 10.1016/0006-8993(71)90347-7. [DOI] [PubMed] [Google Scholar]
- Parajuli LK, Fukazawa Y, Watanabe M, Shigemoto R. Subcellular distribution of α1G subunit of T-type calcium channel in the mouse dorsal lateral geniculate nucleus. J Comp Neurol. 2010;518:4362–4374. doi: 10.1002/cne.22461. [DOI] [PubMed] [Google Scholar]
- Pfenninger K, Akert K, Moor H, Sandri C. The fine structure of freeze-fractured presynaptic membranes. J Neurocytol. 1972;1:129–149. doi: 10.1007/BF01099180. [DOI] [PubMed] [Google Scholar]
- Pouille F, Cavelier P, Desplantez T, Beekenkamp H, Craig PJ, Beattie RE, Volsen SG, Bossu JL. Dendro-somatic distribution of calcium-mediated electrogenesis in Purkinje cells from rat cerebellar slice cultures. J Physiol. 2000;527:265–282. doi: 10.1111/j.1469-7793.2000.00265.x. [DOI] [PMC free article] [PubMed] [Google Scholar]
- Raman IM, Bean BP. Ionic currents underlying spontaneous action potentials in isolated cerebellar Purkinje neurons. J Neurosci. 1999;19:1663–1674. doi: 10.1523/JNEUROSCI.19-05-01663.1999. [DOI] [PMC free article] [PubMed] [Google Scholar]
- Rancz EA, Häusser M. Dendritic calcium spikes are tunable triggers of cannabinoid release and short-term synaptic plasticity in cerebellar Purkinje neurons. J Neurosci. 2006;26:5428–5437. doi: 10.1523/JNEUROSCI.5284-05.2006. [DOI] [PMC free article] [PubMed] [Google Scholar]
- Rancz EA, Häusser M. Dendritic spikes mediate negative synaptic gain control in cerebellar Purkinje cells. Proc Natl Acad Sci U S A. 2010;107:22284–22289. doi: 10.1073/pnas.1008605107. [DOI] [PMC free article] [PubMed] [Google Scholar]
- Ross WN, Lasser-Ross N, Werman R. Spatial and temporal analysis of calcium dependent electrical activity in guinea pig Purkinje cell dendrites. Proc R Soc Lond. 1990;240:173–185. doi: 10.1098/rspb.1990.0032. [DOI] [PubMed] [Google Scholar]
- Sausbier M, Hu H, Arntz C, Feil S, Kamm S, Adelsberger H, Sausbier U, Sailer CA, Feil R, Hofmann F, Korth M, Shipston MJ, Knaus HG, Wolfer DP, Pedroarena CM, Storm JF, Ruth P. Cerebellar ataxia and Purkinje cell dysfunction caused by Ca2+-activated K+ channel deficiency. Proc Natl Acad Sci U S A. 2004;101:9474–9478. doi: 10.1073/pnas.0401702101. [DOI] [PMC free article] [PubMed] [Google Scholar]
- Takeshima H, Komazaki S, Nishi M, Iino M, Kangawa K. Junctophilins: a novel family of junctional membrane complex protein. Mol Cell. 2000;6:11–22. doi: 10.1016/s1097-2765(00)00003-4. [DOI] [PubMed] [Google Scholar]
- Tanaka J, Matsuzaki M, Tarusawa E, Momiyama A, Molnar E, Kasai H, Shigemoto R. Number and density of AMPA receptors in single synapses in immature cerebellum. J Neurosci. 2005;25:799–807. doi: 10.1523/JNEUROSCI.4256-04.2005. [DOI] [PMC free article] [PubMed] [Google Scholar]
- Tank DW, Sugimori M, Connor JA, Llinás RR. Spatially resolved calcium dynamics of mammalian Purkinje cells in cerebellar slice. Science. 1988;242:773–777. doi: 10.1126/science.2847315. [DOI] [PubMed] [Google Scholar]
- Tarusawa E, Matsui K, Budisantoso T, Molnár E, Watanabe M, Matsui M, Fukazawa Y, Shigemoto R. Input-specific intrasynaptic arrangements of ionotropic glutamate receptors and their impact on postsynaptic responses. J Neurosci. 2009;29:12896–12908. doi: 10.1523/JNEUROSCI.6160-08.2009. [DOI] [PMC free article] [PubMed] [Google Scholar]
- Walter JT, Alviña K, Womack MD, Chevez C, Khodakhah K. Decrease in the precision of Purkinje cell pacemaking cause cerebellar dysfunction and ataxia. Nat Neurosci. 2006;9:389–397. doi: 10.1038/nn1648. [DOI] [PubMed] [Google Scholar]
- Walton PD, Airey JA, Sutko JL, Beck CF, Mignery GA, Südhof T, Deerinck TJ, Ellisman MH. Ryanodine and inositol triphosphate receptors coexist in avian cerebellar Purkinje neurons. J Cell Biol. 1991;113:1145–1157. doi: 10.1083/jcb.113.5.1145. [DOI] [PMC free article] [PubMed] [Google Scholar]
- Westenbroek RE, Sakurai T, Elliott EM, Hell JW, Starr TV, Snutch TP, Catterall WA. Immunochemical identification and subcellular distribution of the α1A subunits of brain calcium channels. J Neurosci. 1995;15:6403–6418. doi: 10.1523/JNEUROSCI.15-10-06403.1995. [DOI] [PMC free article] [PubMed] [Google Scholar]
- Williams SR, Stuart GJ. Action potential bakcpropagation and somato-dendritic distribution of ion channels in thalamocortical neurons. J Neurosci. 2000;20:1307–1317. doi: 10.1523/JNEUROSCI.20-04-01307.2000. [DOI] [PMC free article] [PubMed] [Google Scholar]
- Womack M, Khodakhah K. Active contribution of dendrites to the tonic and trimodal patterns of activity in cerebellar Purkinje neurons. J Neurosci. 2002;22:10603–10612. doi: 10.1523/JNEUROSCI.22-24-10603.2002. [DOI] [PMC free article] [PubMed] [Google Scholar]
- Womack MD, Chevez C, Khodakhah K. Calcium-activated potassium channels are selectively coupled to P/Q-type calcium channels in cerebellar Purkinje neurons. J Neurosci. 2004;24:8818–8822. doi: 10.1523/JNEUROSCI.2915-04.2004. [DOI] [PMC free article] [PubMed] [Google Scholar]
- Zander JF, Münster-Wandowski A, Brunk I, Pahner I, Gómez-Lira G, Heinemann U, Gutiérrez R, Laube G, Ahnert-Hilger G. Synaptic and vesicular coexistence of vGluT1 and vGAT in selected excitatory and inhibitory synapses. J Neurosci. 2010;30:7634–7645. doi: 10.1523/JNEUROSCI.0141-10.2010. [DOI] [PMC free article] [PubMed] [Google Scholar]