

Abstract
We investigate the buoyant mass of bacterial cells in real time with the suspended microchannel resonator (SMR) as the population recovers from an osmotic shock. The density of the culture medium is chosen such that the bacteria initially have a positive buoyant mass which becomes negative as they recover from the hyperosmotic stress. This behavior can be used to differentiate between an antibiotic-resistant and an antibiotic-susceptible strain of the pathogenic bacteria Citrobacter rodentium, and we propose a general approach for exploiting the high precision of the SMR for rapid detection of antibiotic resistance.
The buoyant densities of bacterial cells are typically investigated using equilibrium sedimentation centrifugation experiments. Differences in cellular buoyant density have been used to separate different species of cells, 1, 2 as well as to distinguish or separate different cell forms such as spores or minicells from normal cells. 3, 4 It has also been shown that there are differences in buoyant density between the exponential and stationary culture phases. 5 However, centrifugation experiments can only look at populations of cells and cannot observe changes in density in real time. Microcantilever resonators6, 7 have been used to monitor growth of bacteria cells, 8 and in air, have detected bacteria binding events with single cell precision. 9 Although such resonators are highly sensitive in air or vacuum, 10, 11 the presence of viscous damping in fluid has hindered the investigation of living bacteria at the single cell level. In this paper we observe changes in buoyant density of a population of E. coli in real time using single-cell measurements of buoyant mass acquired on a suspended microchannel resonator (SMR), a device in which a microchannel is embedded within a resonating cantilever to reduce viscous damping. 12
The resonant frequency of the SMR is determined by the physical properties of the cantilever itself and the mass of the solution within the channel. When a suspended particle of different density than the carrier fluid is passed through the channel, a transient frequency change occurs which is dependent upon the position of the particle within the cantilever (See Figure 1). The height of the resulting peak is proportional to the buoyant mass of the particle. In addition, the baseline frequency of the SMR provides a direct measure of the density of the carrier fluid throughout the experiment. We have previously reported the weighing of individual bacterial cells as they flow through the SMR. 13 Further, we have demonstrated that the density of a uniform population of particles can be investigated by measuring the buoyant mass of the particles in carrier fluids of different densities. 14 In this work, we investigate changes in the densities of single cells within a population by weighing each cell in a medium that is nearly isopycnic. Measured in this way, our density resolution is determined by the minimum detectable difference between the density of a cell and the fluid surrounding it. For example, a 0.01 g/cm3 difference in density between a bacteria-sized particle (1 fL volume) and the carrier fluid results in a 10 fg buoyant mass, well above the 1 fg detection limit for a transiting particle.
Figure 1.
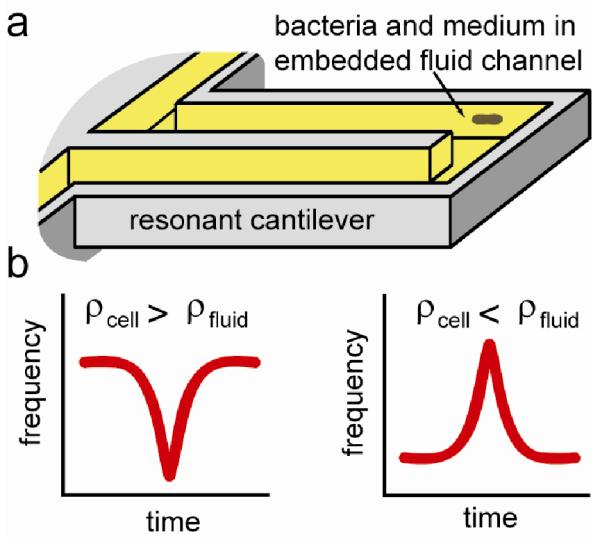
Principle of bacterial buoyant mass measurements on the SMR. (a) Bacteria suspended in a carrier medium pass through an embedded channel within a resonating cantilever, depicted here without an upper surface. (b) The position of a bacterium as it flows through the cantilever defines a transient frequency change, the height of which is proportional to the buoyant mass of the cell.
Large changes in cellular density occur both as an initial reaction to and the subsequent recovery from an osmotic shock, which can be caused by the addition of high solute concentration to a medium containing bacteria. It has previously been observed that the water content in E. coli will decrease in response to an osmotic shock, after which the cells will partially recover lost water. 15 While a number of cellular components are also released in response to hyperosmotic stress, the efflux of water and resulting decrease in cell volume causes the cells to be much denser than they were prior to the shock. 16 Here we observe in real time the recovery of a population of cells from an osmotic shock as the density of individual cells change from being greater than that of the carrier medium to being less than that of the carrier medium. The observed density change can be prevented by the addition of sodium azide or by pretreatment of cells with antibiotics. As a model for the detection of antibiotic resistant bacteria, we have differentiated ampicillin resistant and susceptible strains of the mouse pathogen Citrobacter rodentium17 based on this behavior.
MATERIALS AND METHODS
Suspended Microchannel Resonator
The design and structure of the SMR has been previously reported, 13 and devices of the same type as reported therein have been used for these experiments. The resonant frequency of the cantilever varies with the mass of the contents of the fluidic channel according to equation 1:
where k is the resonator spring constant, m* is the effective mass, and α varies from 0 to ~1 based on the distribution of the added mass Δm relative to the length of the cantilever. In practice, since these values can vary slightly from one device to another, each cantilever is calibrated for uniform mass distribution using glycerol solutions of known density and for transient flow-through mass addition using polystyrene beads of known buoyant mass.
Samples are delivered to the device from pressurized vials (Wheaton W224611) connected to the fluidic bypasses on the SMR via 1/32nd inch Teflon tubing (Upchurch) as shown in Figure 2. Samples are loaded into the SMR bypass channel by pressurizing the vial on the upstream side of the Inlet Bypass (typically to 15 psi) and are stopped by pressurizing the other end of this bypass to the same pressure. Fine pressure control at the downstream side of the Outlet Bypass (set slightly below 15 psi) allows the speed of cells through the cantilever to be adjusted during data acquisition. Data is acquired in LabVIEW and analyzed in MATLAB. The limits on plot axes were chosen to represent the majority of the peaks as well as to show the region near zero clearly. Points outside of these bounds are expected to be large clumps of cells or non-cell particles and are not shown, but account for less than 6% of the acquired peaks for the experiments shown herein. The region on either side of the x-axis in which no data points are shown exists because peaks below a given threshold become difficult to differentiate from the noise in the signal. Regardless of size, a cell with a density close enough to that of the carrier fluid to have a buoyant mass of < ~1 fg will be difficult or impossible to observe. A cutoff of 3 fg was used for the data presented herein.
Figure 2.
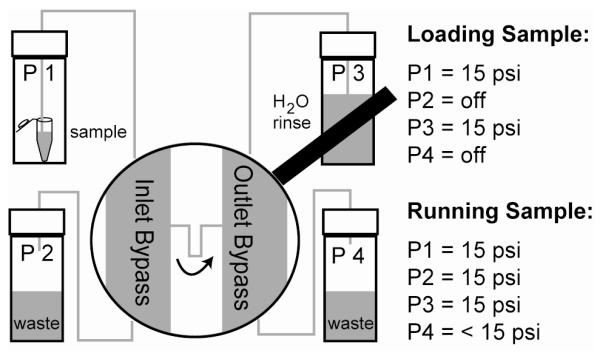
Fluidic setup used to deliver samples to the SMR. Pressurized vials are connected to a manual gas regulator set at 15 psi via individual solenoid valves (P1-P3), or to a computer controlled regulator (P4) to allow fine control of the flow rate through the cantilever.
Cell Culture and Sample Preparation
Escherichia coli K-12 (ATCC#23725) and Citrobacter rodentium (DBS-797; courtesy of John Leong) cultures were grown in Luria Broth (Sigma-Aldrich) at 37 degrees C. Overnight cultures were diluted in fresh medium and were incubated for 1 hour at 37° C prior to investigation on the SMR; antibiotic-treated samples were supplemented with 100 μg/mL ampicillin. Osmotic shocks are induced by the addition of a Histodenz solution (40% Histodenz (Sigma-Aldrich) in 1X PBS (from 10X concentrate; EMD 6505)). Histodenz solution is added at room temperature to the culture samples, and samples are then maintained at room temperature for the remainder of the experiment. The addition of Histodenz solution induces an osmotic shock, but is also used to increase the density of the carrier medium to an appropriate degree that the recovery of cells makes their buoyant density less than that of the carrier medium. The ratio of Histodenz solution to cell culture required were empirically determined to be 0.9:1 and 1:1 for E. coli and C. rodentium, respectively. In general, there is a critical concentration required for the shift to a negative buoyant mass to be observed. If too little Histodenz solution is added, the carrier medium is too light, and the cells maintain a positive buoyant density. However, the experiment is relatively tolerant to the addition of higher concentrations, and a density change is still observed with as much as 20% additional Histodenz solution.
RESULTS AND DISCUSSION
Osmotic Shock Recovery in E. coli
A culture of E. coli is mixed with Histodenz solution in order to induce an osmotic shock. Figure 3a shows the buoyant masses of E. coli cells with respect to time, where t=0 indicates the time at which the Histodenz solution was added and the sample was injected into the SMR for analysis. For the first several minutes of the experiment, all cells have a positive buoyant mass. As time passes and the bacteria recover some of their lost water, the buoyant densities of the cells decrease. This is observed as a decrease in the average magnitude of the positive buoyant masses, and eventually the appearance of cells which have negative buoyant masses as the bacterial cells become less dense than the surrounding solution.
Figure 3.

The buoyant mass of E. coli cells with respect to recovery time from a hyperosmotic shock. Each data point represents a single cell or cluster transiting the cantilever. Following an osmotic shock initiated by the addition of Histodenz solution, all cells have a positive buoyant mass. As the experiment progresses, cells recover some of their lost water, decreasing in density until they have a negative buoyant mass (a). In the presence of 0.1% sodium azide (b), cells maintain a positive buoyant mass throughout the experiment.
The kinetics of the observed change in buoyant mass are consistent with the known timescales of osmotic shock response. At the outset of the experiment, all cells have a positive buoyant mass, meaning they are denser than the 1.11 g/cm3 density of the carrier fluid. Under normal conditions, the buoyant density of E. coli is expected to be much less than that of this fluid. 18 However, the hyperosmotic shock (which has been observed specifically with Histodenz15) results in a significant loss of water from within the cells. The loss of water and resulting increase in density of the cells is expected to happen in less than a second16, and is not observed in our measurements, as some time is required to mix the solutions and to load the sample into the SMR. Our measurements show that the majority of the population shifts from a positive to a negative buoyant mass in a period of ~20 minutes, which is consistent with the timescale reported for rehydration following a hyperosmotic shock16. Although this transition is occurring in each cell as it travels through the cantilever, the transit time is approximately one second. Thus, we assume that the transient change in resonant frequency represents the instantaneous buoyant mass of each cell. While most of the cells in Figure 3a are able to change their density in this way, a number of cells are observed to remain denser than the surrounding solution. These cells may either be dead or otherwise unfit to recover from the osmotic shock. For example, a cell with a compromised membrane would likely be unable to maintain water flow into the cell against equilibrium, or to exclude Histodenz molecules from the interior of the cell.
Bacterial cells are known to utilize a number of different processes to recover from osmotic stress. 16, 19 It is expected that an inactive cell would be subject to the initial loss of water brought on by the osmotic shock, but would be unable to recover. The addition of 0.1% sodium azide to a culture of E. coli just prior to the addition of the Histodenz solution prevented nearly all of the cells from changing their density (Figure 3b) suggesting that an active cell metabolism is indeed required for the change to occur. In addition to sodium azide treatment, we also observed that treatment of E. coli with ampicillin prior to the experiment was able to inhibit the recovery from osmotic shock (data not shown), which suggests the possibility of using this behavior to distinguish between resistant and susceptible strains of bacteria.
Osmotic Shock Recovery and Antibiotic Resistance in C. rodentium
We chose the mouse-pathogen Citrobacter rodentium as a model to evaluate the possibility of using osmotic shock recovery as a way to infer antibiotic resistance. A strain of C. rodentium with a natural resistance to ampicillin was obtained, and a derived strain in which the gene encoding β-lactamase (an enzyme that catalyzes the hydrolysis of the lactam ring in some penicillins) had been knocked out was used as an antibiotic-susceptible control. Cultures of each strain were grown in LB and incubated for 1 hour in medium with or without 100 μg/mL ampicillin, followed by the addition of an equal volume of Histodenz solution (t=0 in Figure 4). In the absence of ampicillin, bacteria from both the resistant and susceptible strains are able to recover some of their lost water, thus shifting their densities to less than that of the surrounding fluid, as seen in Figure 4a, b. In contrast, after being treated with ampicillin, the behaviors of the resistant and susceptible strains are quite different. Bacteria from the resistant strain (Figure 4c) are observed to shift to a negative buoyant mass, just as they would in the absence of antibiotic, while cells of the susceptible strain (Figure 4d) remain denser than the surrounding fluid.
Figure 4.

Ampicillin resistant (AmpR) and susceptible (AmpS) strains of Citrobacter rodentium are observed following an osmotic shock and the buoyant mass of bacteria in each sample is plotted versus recovery time. In the absence of ampicillin treatment, the densities of both the AmpR (a) and AmpS (b) strains decrease as they recover. When treated with ampicillin, the majority of AmpR bacteria (c) decrease in density, while the densities of the AmpS bacteria (d) remain the same.
CONCLUSIONS
In general, the method presented herein demonstrates that the SMR provides a unique method to observe small changes in the density of bacterial cells. Specifically, we have observed the recovery of bacterial cells from an osmotic shock in real time and have demonstrated that the ability of a population to recover can be correlated with antibiotic resistance. These results suggest that the ability of bacteria to recover from an osmotic shock may be of diagnostic value in determining antibiotic resistance. However, this assay is not universal. For example, no recovery was observed for a culture of Mycobacterium smegmatis. A more general approach would be to use the SMR to measure bacteria growth, since the growth rates of resistant and susceptible strains are expected to differ significantly in the absence and presence of antibiotic. While seemingly simple, this approach requires a method for trapping a cell (or cell cluster) within the mass sensitive region of the SMR and releasing the cell once the growth rate has been resolved. Given the ~1 femtogram resolution of the SMR (1 Hz bandwidth) and a suitable reference signal, it should ultimately be possible to determine the growth rate of a strain with a ten hour doubling time in about ten minutes. Like traditional culture methods used to determine antibiotic resistance, this assay would not depend on either the mechanism of drug action or on the possible mechanism of resistance. By directly observing the accumulation of mass for a small number of cells, we could observe growth in far less time than culture methods require.
Acknowledgements
We thank John Leong and Emily Mallick for providing C. rodentium strains. We acknowledge financial support from the National Institutes of Health Grant (R21-EB008217) and the Institute for Collaborative Biotechnologies from the U.S. Army Research Office. M.G.V.M. was supported by the NIH Biotechnology Training Program.
References
- (1).Carrera M, Zandomeni RO, Sagripanti JL. J Appl Microbiol. 2008;105:68–77. doi: 10.1111/j.1365-2672.2008.03758.x. [DOI] [PubMed] [Google Scholar]
- (2).Inoue K, Nishimura M, Nayak BB, Kogure K. Appl Environ Microbiol. 2007;73:1049–1053. doi: 10.1128/AEM.01158-06. [DOI] [PMC free article] [PubMed] [Google Scholar]
- (3).Adler HI, Fisher WD, Cohen A, Hardigree AA. Proc Natl Acad Sci U S A. 1967;57:321–326. doi: 10.1073/pnas.57.2.321. [DOI] [PMC free article] [PubMed] [Google Scholar]
- (4).Jinks DC, Guthrie R, Naylor EW. J Clin Microbiol. 1985;21:826–829. doi: 10.1128/jcm.21.5.826-829.1985. [DOI] [PMC free article] [PubMed] [Google Scholar]
- (5).Makinoshima H, Nishimura A, Ishihama A. Mol Microbiol. 2002;43:269–279. doi: 10.1046/j.1365-2958.2002.02746.x. [DOI] [PubMed] [Google Scholar]
- (6).Lang HP, Berger R, Battiston F, Ramseyer JP, Meyer E, Andreoli C, Brugger J, Vettiger P, Despont M, Mezzacasa T, Scandella L, Guntherodt HJ, Gerber C, Gimzewski JK. Applied Physics a-Materials Science & Processing. 1998;66:S61–S64. [Google Scholar]
- (7).Thundat T, Chen GY, Warmack RJ, Allison DP, Wachter EA. Analytical Chemistry. 1995;67:519–521. [Google Scholar]
- (8).Gfeller KY, Nugaeva N, Hegner M. Biosens Bioelectron. 2005;21:528–533. doi: 10.1016/j.bios.2004.11.018. [DOI] [PubMed] [Google Scholar]
- (9).Ilic B, Czaplewski D, Zalalutdinov M, Craighead HG, Neuzil P, Campagnolo C, Batt C. Journal of Vacuum Science & Technology B. 2001;19:2825–2828. [Google Scholar]
- (10).Gupta A, Akin D, Bashir R. Applied Physics Letters. 2004;84:1976–1978. [Google Scholar]
- (11).Li M, Tang HX, Roukes ML. Nat Nanotechnol. 2007;2:114–120. doi: 10.1038/nnano.2006.208. [DOI] [PubMed] [Google Scholar]
- (12).Burg TP, Sader JE, Manalis SR. Physical Review Letters. 2009;102:228103. doi: 10.1103/PhysRevLett.102.228103. [DOI] [PubMed] [Google Scholar]
- (13).Burg TP, Godin M, Knudsen SM, Shen W, Carlson G, Foster JS, Babcock K, Manalis SR. Nature. 2007;446:1066–1069. doi: 10.1038/nature05741. [DOI] [PubMed] [Google Scholar]
- (14).Godin M, Bryan AK, Burg TP, Babcock K, Manalis SR. Applied Physics Letters. 2007;91 [Google Scholar]
- (15).Cayley S, Record MT., Jr J Mol Recognit. 2004;17:488–496. doi: 10.1002/jmr.695. [DOI] [PubMed] [Google Scholar]
- (16).Wood JM. Microbiol Mol Biol Rev. 1999;63:230–262. doi: 10.1128/mmbr.63.1.230-262.1999. [DOI] [PMC free article] [PubMed] [Google Scholar]
- (17).Mundy R, MacDonald TT, Dougan G, Frankel G, Wiles S. Cell Microbiol. 2005;7:1697–1706. doi: 10.1111/j.1462-5822.2005.00625.x. [DOI] [PubMed] [Google Scholar]
- (18).Fukushima H, Katsube K, Hata Y, Kishi R, Fujiwara S. Appl Environ Microbiol. 2007;73:92–100. doi: 10.1128/AEM.01772-06. [DOI] [PMC free article] [PubMed] [Google Scholar]
- (19).Poolman B, Spitzer JJ, Wood JM. Biochim Biophys Acta. 2004;1666:88–104. doi: 10.1016/j.bbamem.2004.06.013. [DOI] [PubMed] [Google Scholar]