

Abstract
Introduction
In China, population-based blood pressure levels and prevalence of hypertension are increasing. Meanwhile, sodium intake, a major risk factor for hypertension, is high. In 2011, to develop intervention priorities for a salt reduction and hypertension control project in Shandong Province (population 96 million), a cross-sectional survey was conducted to collect information on sodium intake and hypertension prevalence, awareness, treatment, and control.
Methods
Complex, multistage sampling methods were used to select a provincial-representative adult sample. Blood pressure was measured and a survey conducted among all participants; condiments were weighed in the household, a 24-hour dietary recall was conducted, and urine was collected. Hypertension was determined by blood pressure measured on a single occasion and self-reported use of antihypertension medications.
Results
Overall, 23.4% (95% confidence interval [CI], 20.9%–26.0%) of adults in Shandong were estimated to have hypertension. Among those classified as having hypertension, approximately one-third (34.5%) reported having hypertension, approximately one-fourth (27.5%) reported taking medications, and one-seventh (14.9%) had their blood pressure controlled (<140/<90 mm Hg). Estimated total average daily dietary sodium intake was 5,745 mg (95% CI, 5,428 mg–6,063 mg). Most dietary sodium (80.8%) came from salt and high-salt condiments added during cooking: a sodium intake of 4,640 mg (95% CI, 4,360 mg–4,920 mg). The average daily urinary sodium excretion was 5,398 mg (95% CI, 5,112 mg–5,683 mg).
Conclusion
Hypertension and excessive sodium intake in adults are major public health problems in Shandong Province, China.
Introduction
Population-based blood pressure levels and the prevalence of hypertension estimated by using surveillance data have increased rapidly in the past 4 decades in China; the prevalence of hypertension increased from 5% in 1959 to 18% in 2002 (1,2). Dietary salt (sodium chloride) intake is high in China (3,4). Excess dietary sodium intake can cause hypertension, a leading risk factor for cardiovascular disease, which now accounts for approximately 40% of all deaths in China (5). In 2002, the China Health and Nutrition Survey found that approximately 80% of Chinese adults consumed more than the daily salt limit of 6 g recommended by the Chinese Nutrition Society (1). Reducing population-level dietary sodium intake could substantially reduce blood pressure levels and decrease risk for cardiovascular disease in China (6,7).
Shandong Province is the second most populous province (96 million) in China and is the birthplace of Shandong cuisine, famous for containing more salt and soy sauce than other Chinese cuisines. In 2002 in Shandong Province, daily intake of salt was 12.6 g, and 25% of those older than 15 years had hypertension (Z.B. et al, unpublished data). To address the prevention and control of hypertension and the reduction of dietary sodium consumption, the Chinese Ministry of Health and the Shandong government in 2011 collaboratively launched the Shandong–Ministry of Health Action on Salt Reduction and Hypertension (SMASH), 2011–2015. The goal of SMASH is to reduce daily salt intake to 10 g/d by 2015 and increase awareness and control of hypertension among adults in Shandong.
Since the 2002 China Health and Nutrition Survey, no provincial-representative study of salt intake and hypertension prevalence in Shandong has been conducted. The major objectives of the SMASH baseline survey were to assess the level and source of salt intake and to characterize the prevalence of hypertension in Shandong Province. The findings from this survey are being used to develop and target priority interventions to prevent hypertension, improve its control, and lower sodium intake in the Shandong population.
Methods
Sample size and sampling frame
Conducted during June and July 2011, the SMASH baseline survey was a population-based cross-sectional survey of residents aged 18 to 69 years. The required sample size to estimate population prevalence of hypertension was 15,153. For salt intake estimation, the required sample size was 2,088.
Participants aged 18 to 69 years living in Shandong Province, who were without disability and mental disorders, were eligible to participate in the survey. We used complex, 4-stage cluster sampling to select the participants. First, we selected 20 counties/districts from 140 counties and districts after stratification by geographic distribution and by residence status (Figure 1). Second, using proportional probability sampling, we selected 3 townships (in rural areas) or 2 streets (in urban areas) from each selected county/district. Then, also using proportional probability sampling, we selected 3 villages (in rural areas) or neighborhood communities (in urban areas) from each sampled township (rural) or street (urban). Finally, in each selected village and neighborhood community, we randomly selected 100 adults from the local residents list. A total of 15,600 participants aged 18 to 69 years were selected from 13,010 households among 156 communities and villages.
Figure 1.
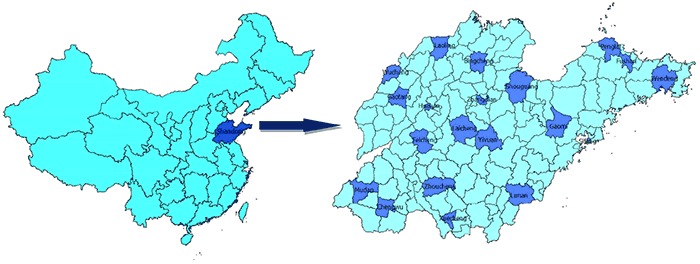
Location of the sampled countries/districts in Shandong Province, China, Shandong–Ministry of Health Action on Salt Reduction and Hypertension baseline survey, 2011.
From this larger sample, we also randomly selected a subsample for additional measures. Among each previously selected township and street, we randomly selected 1 village and 1 neighborhood community. Then, we randomly selected 42 participants from the larger sample in each selected village and neighborhood community. Overall 2,184 adult participants were selected for this subsample.
Measurements
All sampled individuals were invited to participate in the survey (Appendix) and physical examination. A close-ended questionnaire was administered face-to-face by trained public health staff. We collected information on individual sociodemographics, self-reported history of hypertension and diabetes, as well as the lifestyle habits of smoking, alcohol use, physical activity, and diet. We also collected data on their knowledge of the health outcomes of sodium intake and hypertension, perceptions of salt consumption, and attitudes and intentions toward reducing salt intake.
Height, weight, waist circumference, and blood pressure were measured by trained health staff using standardized methods (8). Blood pressure was measured 3 times every 5 minutes during a single occasion by electronic sphygmomanometer (HEM-7071, Omron Corporation, Kyoto, Japan) while participants were in the sitting position.
Among the subsample, a 24-hour dietary recall, which included a weighing of condiments in the household, was administered, and a 24-hour urine sample was collected. (At the same time the urine was collected, a fasting blood sample was also collected, but the results of these blood samples will be published elsewhere.) The 24-hour dietary recall took place during 3 consecutive days, usually Thursday, Friday, and Saturday (9). Trained health staff visited each selected household and weighed all condiments (ie, salt, low-sodium salt, soy sauce, monosodium glutamate, vinegar, chicken essential, bean sauce, sweet flour sauce, chili sauce, and shrimp sauce) directly at the start of the first 24-hour dietary recall and at the end of the last 24-hour dietary recall. Each selected household was asked to record the purchase or spillage (or other wastage) of any condiments during the survey days and report these to the health staff during their final visit. Individuals were trained to record their entire food diary every day into a standardized table and report the portion of each item consumed. The total individual dietary sodium intake was the combination of sodium estimated from condiments and the dietary recall. We used the sodium reference values from China Food Composition Table 2004 (10) to calculate the sodium content for all condiments and foods.
Participants were instructed on the collection of a standard 24-hour urine sample and then given a standardized urine-collection container (11). Trained health staff controlled the quality of urine sample collection at each survey field site. They recorded both the beginning time and ending time of urine collection for each participant and used standard questionnaires to evaluate the completeness of the 24-hour urine collection. Urinary sodium, potassium, creatinine, and microproteinurina were then assessed by using standard laboratory assays. Urinary sodium and potassium were examined by the ion-selective electrode method (12).
Data management and analysis
Data were double-entered in EpiData Entry 3.1 (The EpiData Association, Odense, Denmark); cleaning and archiving was done by using established protocols. Extreme and missing data were manually checked to the original paper records, and data entry and logical errors were corrected or updated.
Hypertension was defined according to the 2010 Chinese Guidelines for the Management of Hypertension (13). Participants were classified as hypertensive if their mean systolic blood pressure (SBP) was 140 mm Hg or greater or if their mean diastolic blood pressure (DBP) was 90 mm Hg or greater or if they self-reported currently taking antihypertension medication in the previous 2 weeks (13). Awareness of hypertension was defined as self-report of any previous diagnosis of hypertension by a health care professional. Treatment of hypertension was defined as self-reported use of antihypertension medication. Control of hypertension was defined as treatment of hypertension associated with a mean SBP of less than 140 mm Hg and DBP of less than 90 mm Hg (13).
Sample weights were developed to represent the entire population in Shandong Province. The total weight was determined by the design weight and poststratification weight (14). The design weight was calculated by accounting for cluster design, strata, and individual. The general population distribution of Shandong Province in 2009 was used for poststratification weight calculations. Taylor-series linearization was used to estimate the variance of mean and proportion and to calculate 95% confidence intervals (CIs). Two sets of weights were calculated for the overall sample and for the subsample.
We calculated the weighted SBP and DBP, the prevalence of hypertension, and the percentage of hypertensive participants who were aware of, taking medication for, and controlling their hypertension. We also estimated the weighted mean of dietary sodium intake and 24-hour urinary sodium excretion and the difference between the 2 measures. A P value less than .05 was considered significant. Statistical analyses were performed with SAS software version 9.3 (SAS Institute Inc, Cary, North Carolina).
Ethics considerations
The survey received ethical approval from the ethics committee of the Shandong Center for Disease Control and Prevention. All participants signed informed consent before participating in the survey.
Results
Among 15,600 individuals selected, 14,230 responded and participated in the survey (response rate, 91%). Of the 1,370 nonresponders, 1,120 were replaced by adults with similar profiles from the same community or village. A total of 15,350 participated in the survey; a subsample of 2,208 participated in the 24-hour dietary recall, and 2,112 participated in the 24-hour urine collection (Figure 2).
Figure 2.
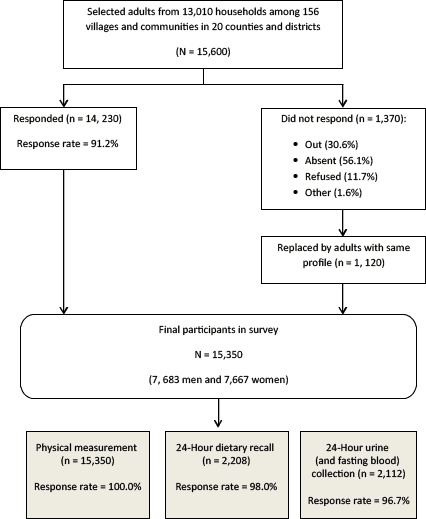
Participant flow in the Shandong–Ministry of Health Action on Salt Reduction and Hypertension baseline survey in Shandong Province, China, 2011. In the list of reasons for nonresponse, “out” is defined as not residing in hometown for an extended period because of working or education purposes; “absent” is defined as not at home on the day the survey was conducted.
Among all participants, 50% were men, 50% were women, 31% lived in urban areas, and 69% lived in rural areas. The weighted mean age was 40.7 years (95% CI, 40.2 y–41.2 y). Almost all participants (99.4%) were Han; most (92.8%) had less than a high school education (Table 1). Overall, the weighted mean (standard deviation) was 121 (18.3) mm Hg for SBP and 79 (11.7) mm Hg for DBP. Men had higher mean SBP and DBP than women (Table 2).
Table 1. Characteristics of Study Participants (N = 15,350) in Shandong Province, China, SMASH Baseline Survey, 2011.
| Characteristic | Total |
Urban |
Rural |
|||
|---|---|---|---|---|---|---|
| n | % (95% CI)a | n | % (95% CI)a | n | % (95% CI)a | |
| Sex | ||||||
| Male | 7,683 | 50.4 (49.7–51.1) | 2,391 | 50.1 (48.9–51.3) | 5,292 | 50.6 (49.6–51.6) |
| Female | 7,667 | 49.6 (48.9–50.3) | 2,413 | 49.9 (48.7–51.1) | 5,254 | 49.4 (48.4–50.4) |
| Ethnicity | ||||||
| Han | 15,262 | 99.4 (99.2–99.6) | 4,769 | 99.3 (98.9–99.7) | 10,493 | 99.5 (99.3–99.7) |
| Otherb | 88 | 0.6 (0.4–0.8) | 35 | 0.7 (0.3–1.1) | 53 | 0.5 (0.3–0.7) |
| Education, y | ||||||
| <9 | 11,782 | 77.3 (73.0–81.5) | 2,841 | 62.6 (45.5–79.7) | 8,941 | 83.5 (80.7–86.2) |
| 9–11 | 2,372 | 15.5 (13.3–17.6) | 1,099 | 21.6 (13.6–29.6) | 1,273 | 12.9 (11.0–14.7) |
| ≥12 | 1,196 | 7.3 (4.8–9.7) | 864 | 15.8 (5.9–25.7) | 332 | 3.6 (2.4–4.9) |
| Smoking statusc, by sex | ||||||
| Men | ||||||
| Never | 3,172 | 40.3 (36.3–44.3) | 1,099 | 39.5 (29.0–50.0) | 2,163 | 40.6 (36.1–45.1) |
| Former | 637 | 8.3 (7.2–9.3) | 216 | 9.2 (6.1–12.4) | 421 | 7.9 (6.9–8.9) |
| Current | 3,874 | 51.4 (48.0–54.9) | 1,166 | 51.2 (43.7–58.7) | 2,708 | 51.5 (47.1–55.9) |
| Women | ||||||
| Never | 7,417 | 96.8 (94.9–98.8) | 2,351 | 98.1 (95.9–100) | 5,066 | 96.3 (93.5–99.0) |
| Former | 63 | 0.8 (0.3–1.3) | 12 | 0.4 (0-1) | 51 | 1.0 (0.3–1.6) |
| Current | 187 | 2.4 (0.9–3.9) | 50 | 1.6 (0-3.1) | 137 | 2.7 (0.6–4.8) |
| BMId | ||||||
| Low weight | 664 | 4.5 (4.1–5.0) | 211 | 4.7 (3.9–5.5) | 453 | 4.4 (3.8–5.1) |
| Normal | 6,930 | 46.1 (43.9–48.3) | 2,023 | 43.4 (37.8–49.0) | 4,907 | 47.2 (44.6–49.8) |
| Overweight | 5,081 | 32.8 (31.5–34.1) | 1,642 | 33.2 (29.9–36.5) | 3,439 | 32.6 (31.0–34.2) |
| Obese | 2,662 | 16.6 (14.9–18.3) | 922 | 18.6 (15.2–22.1) | 1,740 | 15.7 (13.7–17.8) |
Abbreviations: SMASH, Shandong–Ministry of Health Action on Salt Reduction and Hypertension; CI, confidence interval; BMI, body mass index.
Percentages were weighted to represent the total population of Shandong adults aged 18 to 69 years poststratified by age and sex.
Other ethnicities were Zhuang, Man, Hui, Miao, Uyghur, Yi, Tujia, Mongol, Korean, and Tibetan.
Never was defined as those who had smoked fewer than 100 cigarettes in a lifetime. Those who had smoked 100 or more than 100 cigarettes in a lifetime were defined as smoker; of smokers, those who were currently smoking were classified as current and those who had quit were classified as former.
Calculated from measured height and weight. Only participants for whom height and weight data were available (n = 15,337) were included in analysis. Data on 13 people (6 urban, 7 rural) were missing. BMI was calculated as weight in kilograms (kg) divided by height in meters squared (m2). BMI < 18.5 classified as low weight; 18.5 to <24.0 as normal; 24.0 to <28.0 as overweight; and ≥28.0 as obese, according to Chinese overweight and obesity guidelines (15).
Table 2. Mean Systolic and Diastolic Blood Pressure and Hypertension Prevalence, Awareness, and Control Among Adults in Shandong Province, China (N = 15,350), SMASH Baseline Survey, 2011a .
| Measure | Total, Mean (95% CI)b | Urban, Mean (95% CI)b | Rural, Mean (95% CI)b |
|---|---|---|---|
| Systolic blood pressure, mm Hgc | |||
| Men | 124.2 (122.9–125.6) | 122.5 (120.0–125.1) | 124.9 (123.3–126.6) |
| Women | 117.9 (116.4–119.3) | 114.6 (112.2–117.0) | 119.3 (117.5–121.0) |
| Total | 121.1 (119.7–122.4) | 118.6 (116.4–120.8) | 122.1 (120.4–123.8) |
| Diastolic blood pressure, mm Hgc | |||
| Men | 80.4 (79.3–81.5) | 79.8 (77.4–82.2) | 80.6 (79.2–82.0) |
| Women | 77.3 (76.4–78.2) | 76.0 (74.2–77.7) | 77.9 (76.7–79.1) |
| Total | 78.9 (77.9–79.9) | 77.9 (75.9–79.8) | 79.3 (78.0–80.5) |
| Prevalence of hypertensiond | |||
| Men | 25.7 (22.9–28.6) | 24.1 (18.0–30.1) | 26.4 (22.8–30.0) |
| Women | 21.1 (18.6–23.7) | 17.5 (13.4–21.6) | 22.7 (19.4–26.0) |
| Total | 23.4 (20.9–26.0) | 20.8 (16.0–25.6) | 24.6 (21.3–27.8) |
| Awareness of hypertensione , f | |||
| Men | 31.5 (27.2–35.9) | 41.6 (35.4–47.7) | 27.7 (22.1–33.3) |
| Women | 38.1 (32.5–43.6) | 44.8 (36.3–53.2) | 35.9 (28.5–43.2) |
| Total | 34.5 (29.8–39.2) | 42.9 (37.2–48.7) | 31.4 (25.1–37.7) |
| Treatment of hypertensione , g | |||
| Men | 24.1 (20.5–27.7) | 32.6 (26.3–39.0) | 20.8 (16.5–25.1) |
| Women | 31.7 (27.0–36.4) | 39.7 (28.7–50.7) | 29.1 (23.4–34.8) |
| Total | 27.5 (23.6–31.4) | 35.6 (28.2–43.0) | 24.6 (19.8–29.4) |
| Control of hypertensione , h | |||
| Men | 13.7 (11.6–15.8) | 16.1 (12.5–19.7) | 12.8 (10.1–15.5) |
| Women | 16.4 (14.1–18.6) | 19.9 (11.9–27.8) | 15.2 (13.2–17.3) |
| Total | 14.9 (13.0–16.8) | 17.7 (12.6–22.7) | 13.9 (11.7–16.1) |
Abbreviations: SMASH, Shandong–Ministry of Health Action on Salt Reduction and Hypertension; CI, confidence interval.
Values are percentage (95% CI), unless otherwise indicated.
Means and percentages were weighted to represent the total population of Shandong adults aged 18 to 69 years poststratified by age and sex.
The average of 3 blood pressure measurements on a single occasion.
Hypertension was determined by blood pressure measured on a single occasion and self-reported use of antihypertension medications. Participants were designated as having hypertension if mean systolic blood pressure was ≥140 mm Hg or diastolic blood pressure was ≥90 mm Hg or if they self-reported currently taking antihypertension medication in the previous 2 weeks. This definition differs from the definition applicable in clinical settings, which requires readings averaged during 2 or more occasions.
Calculated among participants classified as having hypertension as defined in the previous footnote.
Awareness of hypertension was defined as self-report of any previous diagnosis of hypertension by a health care professional.
Treatment of hypertension was defined as self-reported use of antihypertension medication.
Control of hypertension was defined as treatment of hypertension associated with a mean systolic blood pressure of less than 140 mm Hg and diastolic blood pressure of less than 90 mm Hg (13).
The weighted prevalence of hypertension was 23.4% (95% CI, 20.9%–26.0%). Among those classified as having hypertension, only one-third (34.5%; 95% CI, 29.8%–39.2%) were aware of their condition; about one-fourth (27.5%; 95% CI, 23.6%–31.4%) reported taking antihypertension medications, and one-seventh (14.9%; 95% CI, 13.0%–16.8%) had their blood pressure controlled (Table 2). The prevalence of hypertension was not different between rural and urban areas (P = .12). Among those with hypertension, awareness (P = .001) and treatment (P = .002) of hypertension were significantly lower in rural areas than in urban areas. However, we found no difference in hypertension control between rural and urban areas (P = .07).
The total average daily dietary sodium intake estimated by 24-hour dietary recall was 5,745 mg (95% CI, 5,428 mg–6,063 mg) (Table 3). Rural participants consumed greater amounts of sodium than urban participants (P = .03), and men consumed greater amounts of sodium than women (P< .001). Dietary sodium intake increased by age among participants younger than 60 years, peaked in the group aged 50 to 59, and then decreased (Figure 3). The trend of sodium intake across age groups was similar among men and women.
Table 3. Differences in Daily Dietary Sodium Intake and Urinary Sodium Excretion Among Adults in Shandong Province, China, SMASH Baseline Survey, 2011a .
| Measure | Total | Residence |
Sex |
||
|---|---|---|---|---|---|
| Urban | Rural | Male | Female | ||
| Daily dietary sodium intakeb , c (n = 2, 140) | |||||
| Total | 5,745 (5,428–6,063) | 5,342 (5,007–5,676)d | 5,910 (5,449–6,371)d | 6,147 (5,824–6,471)e | 5,339 (5,006–5,673)e |
| Condiments added at cooking | 4,640 (4,360–4,920) | 4,236 (3,986–4,487) | 4,805 (4,398–5,213) | 4,861 (4,564–5,159) | 4,417 (4,144–4,690) |
| Salt added at cooking | 3,638 (3,397–3,878) | 3,376 (2,852–3,899) | 3,745 (3,429–4,060) | 3,790 (3,540–4,041) | 3,484 (3,246–3,721) |
| Other condiments added at cooking | 1,003 (808–1,197) | 861 (439–1,282) | 1,061 (822–1,299) | 1,071 (870–1,272) | 934 (738–1,129) |
| Processed food | 582 (498–666) | 550 (412–689) | 595 (480–710) | 674 (573–776) | 489 (409–568) |
| Other | 523 (458–588) | 555 (438–671) | 510 (425–595) | 611 (528–695) | 433 (380–487) |
| Urinary sodium excretion (n = 2,024)b | |||||
| Total, mg | 5,398 (5,112–5,683) | 5,352 (4,379–6,327) | 5,419 (5,014–5,824) | 5,598 (5,269–5,925)e | 5,184 (4,904–5,465)e |
| Difference between dietary sodium intake and urinary sodium excretion (n = 1,914)b , f | |||||
| Total, mg | 352 (−30 to 733) | −47 (−716 to 622) | 528 (30 to 1,025) | 551 (173 to 929) | 140 (−294 to 574) |
Abbreviations: CI, confidence interval; SMASH, Shandong–Ministry of Health Action on Salt Reduction and Hypertension.
All values are mean (95% CI), mg/d, unless otherwise indicated. Means were weighted to represent the total population of Shandong adults aged 18 to 69 years poststratified by age and sex.
Salt and sodium are converted by the following equation: 1 g salt = 390 mg sodium; 1 mmol sodium = 23 mg sodium.
The total sources of dietary sodium included 3 broad categories: condiments added at cooking, sodium from processed food, and other sources (unclassified). The broad category “condiments added at cooking” includes 2 subcategories: “salt added at cooking” and “other condiments added at cooking.”
Difference between rural and urban residents, P < .05.
Difference between male and the female residents, P < .05.
Only participants with records of both 24-h dietary recall and 24-h urine collection were included in analysis.
Figure 3.
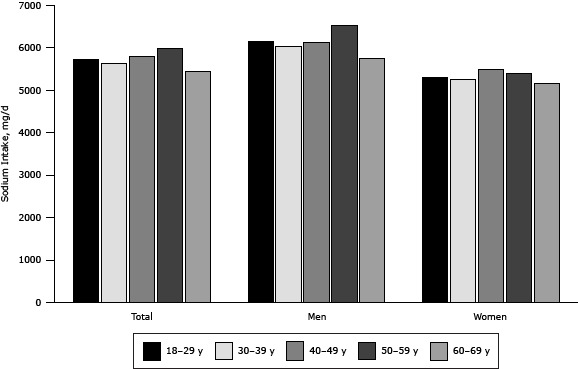
Age- and sex-specific daily dietary sodium intake of adults participating in the Shandong–Ministry of Health Action on Salt Reduction and Hypertension baseline survey in Shandong Province, China, 2011.
| Age group, y | Sodium Intake, mg/d |
||
|---|---|---|---|
| Total | Men | Women | |
| 18–29 | 5,737 | 6,159 | 5,301 |
| 30–39 | 5,633 | 6,023 | 5,247 |
| 40–49 | 5,801 | 6,118 | 5,488 |
| 50–59 | 5,980 | 6,532 | 5,408 |
| 60–69 | 5,454 | 5,747 | 5,167 |
Overall, most dietary sodium (80.8%; 95% CI, 79.9%–81.6%) came from condiments, including salt, added during the cooking process. The mean daily sodium intake from condiments added at cooking was 4,640 mg (95% CI, 4,360 mg–4,920 mg). Among condiments added at cooking, salt was the leading source (78.4%; 95% CI, 74.7%–82.1%) of sodium. The daily average sodium consumption from processed food was 582 mg (95% CI, 498 mg–666 mg) and accounted for 10.1% (95% CI, 9.0%–11.3%) of the total sodium intake (Table 3).
The mean 24-hour urinary sodium excretion was 5,398 mg (95% CI, 5,112 mg–5,683 mg) (Table 3). We found no difference between rural and urban residents in 24-hour urinary sodium excretion (P = .08); men excreted more sodium than women (P = .002) (Table 3). Overall, the sodium intake estimated by dietary recall was significantly correlated with urinary sodium excretion (r = 0.16; P< .001); the mean difference was 352 mg (95% CI, −30 mg to 733 mg) (Table 3).
Discussion
Hypertension has become a nationwide epidemic in China (1,2,16). Our study found that 1 in 4 adults in Shandong Province had hypertension in 2011 — an estimated 16 million people. Other surveys, using different methods of sampling and analysis, found that hypertension is becoming common in Shandong Province (17,18). The prevalence of hypertension in Shandong in our study was lower than the pooled prevalence in the northern region (25.8%) and higher than that in the southern region of China (20.4%) (19).
We found that hypertension was more common in rural areas than in urban areas of Shandong. A study of the rural population in Shandong suggested that the prevalence of hypertension increased by 50% from 1991 to 2007 (18). A corresponding trend analysis for urban areas is not available for comparison. At the national level, hypertension among rural populations has also increased faster than that among urban populations. In 1959, the national prevalence of hypertension among urban residents was 1.5 times the prevalence among rural residents (2). By 2002, the urban–rural disparity was much diminished (urban-to-rural ratio = 1.2) (16), and by 2010, the disparity had further diminished (urban-to-rural ratio = 1.05) (20). Therefore, it is not surprising that the burden of hypertension is larger in the rural than the urban population in Shandong now. Economic development in China has led to greater availability of blood pressure measurements than before in rural areas; such availability has allowed the detection and diagnosis of hypertension among those with previously undetected hypertension. In addition, the prevalence of obesity, a major risk factor for hypertension, increased faster in rural areas than in urban areas (21).
Hypertension control in Shandong Province improved since the 2002 national survey (15% in 2011 vs 5% in 2002) (16). However, hypertension control was much lower than that found in the United States and other countries (22,23). The low awareness of blood pressure levels is a crucial factor in hypertension control. Campaigns to increase blood pressure screening and detection should be emphasized in SMASH interventions. In addition, our study showed that among those aware of their hypertension, less than half (43.2%) had their blood pressure controlled. The lower control rate might be related to poor adherence to medication use (24). Health education on adherence to using antihypertension medication should be promoted by primary health service centers in the SMASH program. In addition, salt substitute, a salt with reduced sodium and increased potassium, is now being used in the China Rural Health Initiative in 5 northern Chinese provinces; if proved effective, using salt substitute might be a strategy to reduce sodium consumption and control hypertension (25).
We found dietary salt intake among Shandong adults was high and changed little during the past 10 years. Reducing the population levels of salt intake is challenging. One major barrier is changing the salty taste preference and appetite for current salt content typified by traditional Shandong cuisine. Lowering salt content in foods may lead to loss of palatability and may be unacceptable for individual taste preferences (26). However, gradual sodium reduction (10%–15% over multiple years) can be implemented and might lead to adjustment of the salt taste. This strategy was adopted by salt reduction programs in England and other countries (27,28). The Food Standards Agency in England is working with the food industry progressively toward the 6-g-per-day salt intake target. We have adopted the same strategy in SMASH and plan to achieve salt-reduction goals by moderately and gradually reducing levels of salt from high-sodium food.
Condiments added during food preparation are the major source of sodium intake; processed foods accounted for the minority of sodium intake in Shandong. This finding is consistent with the findings of other studies in China (1,3,4), and it suggests that salt reduction in food preparation in households, restaurants, and canteens should be set as high priority for SMASH interventions and that household food preparers and restaurant chefs should be the key target audience for the message.
Sodium consumption can be measured by dietary sodium intake recalls and 24-hour urinary sodium excretion measurement. However, methodological challenges limit the accurate measurement of sodium intake in both methods (29). Dietary surveys are inaccurate when respondents do not report their food intake accurately. In addition, accounting for the waste and spillage of condiments is challenging, particularly in a field study that includes a large sample of households. Twenty-four-hour urine collection misses approximately 10% of sodium intake excreted in sweat and feces. Validation of urine collection completeness is also difficult. The p-aminobenzoic acid (PABA) test is recommended for 24-hour urine collection, but the utility and the safety of PABA tests for population surveys have not been established (11). The alternative biomarker creatinine has moderate sensitivity in detecting urine incompleteness (30).
Our study has many strengths. First, it was conducted in a large representative sample of the general population in Shandong Province. Second, we used a combination of methods to estimate sodium intake: 24-hour dietary recall, weighing of condiments, and 24-hour urine collection. Third, we had a strict quality-control process in all phases of the study to ensure that data were reliable.
Our study also has several limitations. First, we used the surveillance definition of hypertension, and we took blood pressure measurements on a single occasion (although 3 measurements were taken on that 1 occasion). Blood pressure varies over time in individuals, and 2 or more blood pressure readings on 2 or more occasions are required for a clinical diagnosis of hypertension (31). Second, data on wastage of condiments were collected by self-report, which may have led to an overestimation or underestimation of the sodium intake derived from this source. Third, we didn’t use PABA as the biomarker to validate 24-hour urine completeness. We used creatinine as an alternative biomarker; doing so may have resulted in the inclusion of noneligible samples or the exclusion of eligible samples. Fourth, approximately 7% of the nonresponding participants were substituted by nonrandomly selected individuals. However, after we removed those substituted participants and repeated all analyses, we found similar results, which suggest that the substitution had little effect on our study results.
In conclusion, we found significant levels of hypertension in Shandong Province, particularly in rural areas. Control of hypertension has improved but is very low. Sodium intake is high, and condiments added during home food preparation accounts for most of the sodium intake. Opportunities have been identified for strategic efforts in targeting hypertension prevention and control and reducing sodium intake.
Acknowledgments
The survey was supported by funds from Chinese Center for Disease Control and Prevention (CDC), National Center for Non-communicable and Chronic Disease Control and Prevention, the Technical Development Plan in Shandong (implemented by Shandong CDC, grant no. 2012GSF11828). We thank all investigators from the national, provincial, and county-level CDC and all participants of the survey. We also acknowledge Ying Cai and Sonia Angell for their review of the study design and advice on implementation of the field intervention. The findings and conclusions in this report are those of the authors and do not necessarily represent the official position of the US Centers for Disease Control and Prevention. There are no conflicts of interest relevant to this article.
Appendix. Text of Questionnaire on Salt and Hypertension-Associated Knowledge, Attitude, and Practice in Shandong–Ministry of Health Action on Salt Reduction and Hypertension (SMASH) Project Baseline Survey Among Adults in Shandong, China, 2011
Question 1: Do you know the diagnosis criteria of hypertension?
≥140/90 mm Hg
≥130/80 mm Hg
≥120/80 mm Hg
Don’t know
Question 2: Do you know the consequences caused by hypertension [multiple choices]?
Stroke
Coronary heart disease
Kidney disease
Eye disease
Don’t know
Question 3: Do you know the risk factors that could lead to hypertension?
Overweight or obese
Habitual excessive alcohol drink
Habitual high-sodium diet
Hypertension family history
Hyperglycaemia and hyperlipidemia
Aging
Mental stress
Don’t know
Question 4: Do you think any of the following statements are correct [multiple choices]?
It would be out of strength if we intake less salt
Too much salt could increase blood pressure
Whenever we are healthy, we do not need to reduce salt intake
Too much salt could lead to osteoporosis
Don’t know
Question 5: Do you know the daily salt intake recommendation in China?
<2 g
<6 g
<9 g
<12 g
Don’t know
Question 6: Do you know that reducing salt intake could decrease blood pressure?
Yes, I know
No, I don’t know
Question 7: Do you know excessive salt intake could cause what disease [multiple choices]?
Hypertension
Stroke
Myocardial infarction
Kidney disease
Stomach cancer
Osteoporosis
Don’t know
Question 8: How do you assess your salt intake?
Too little
Moderate
Too much
Question 9: After you have known the unfavorable consequence of excessive salt intake, do you have intention to reduce salt intake?
Yes, I have salt reduction intention (Please go to Question 11)
No, I don’t (Please go to Question 10)
Don’t know (Please go to Question 11)
Question 10: Could you please tell us the reason why you don’t plan to reduce salt?
Unfavorable food taste of decreased salt added
It would be out of strength once we decrease salt intake
There are no adverse outcomes by taking too much salt
I don’t know
Question 11: Have you used a scaled salt spoon to control your salt added in cooking in your household?
Yes, I have (Please go to Question 12)
No, I haven’t (Please go to Question 16)
I don’t know (Please go to Question 16)
Question 12: Where did your family get the scaled salt spoon?
From the health service centers
It was a gift of purchasing other products
I bought it myself
Other, please clarify___________
Question 13: Do you know the method of using the scaled salt spoon?
Yes, I know
No, I don’t
Question 14: Could your family use the scaled salt spoon correctly?
Yes, we could
No, we couldn’t
Don’t know
Question 15: Which type of scaled salt spoon did your family use?
2-gram-scaled salt spoon
3-gram-scaled salt spoon
6-gram-scaled salt spoon
Other, please clarify.___________
Question 16: Do you think the CDC should advocate the low-sodium diet in the mass media?
Yes, I agree
No, I don’t
Don’t know
Question 17: Have you received health education on the low-sodium diet?
Yes, I have (Please go to Question 18)
No, I haven’t (Please go to Question 19)
Don’t know (Please go to Question 19)
Question 18: We will read some health education channels to you. Please select the major 3 channels that you have used to receive health education on the low-sodium diet.
Brochures or folding
Broadcast, television
Newspaper, magazine
Column
Health professionals
Family member
Colleagues or friends
Slogans
Other, please clarify_____________
Question 19: Have you advocated the low-sodium diet to your friends or colleagues?
Yes, I have
No, I haven’t
Question 20: Do you think that low-sodium diet could affect food taste?
Yes, it will have great effect
Yes, it will have moderate effect, but quite acceptable
No, I don’t think it could affect it
Don’t know
Question 21: Which population do you think population should adhere to the low-sodium diet (multiple choices)?
Patients with hypertension
Patients with stroke
Patients with coronary heart disease
Don’t know
Question 22: Have you noticed food labeling when you buy processed food?
Yes, I have
No, I haven’t
Don’t know
Question 23: What is your attitude on listing the sodium content in the food label on the processed food?
Positive
Negative
Don’t know
Question 24: Do you think that food labeling on sodium content on processed foods have played a role in your choice of low-sodium food?
Yes, it has
No, it hasn’t
Don’t know
Question 25: What is your attitude toward the low-sodium diet?
Support
Oppose
Neutral
Question 26: Have you taken actions on salt reduction?
Yes, I have (Please go to Question 27)
No, I haven’t (Please go to Question 28)
Don’t know (Please go to Question 28)
Question 27: Which salt reduction measurements have you taken [multiple choices]?
Reduce added salt in cooking
Update salt-adding procedure in food cooking, ie, postpone salt adding once food is ready
Reduce high-sodium condiments use
Reduce the consumption of pickles (high-sodium food)
Choose low-sodium processed food
Replace the salt with condiments that were low sodium, ie, vinegar
Use onion, ginger, garlic to increase the taste and reduce the salt adding
Other, please clarify
Don’t know
Question 28: Have you heard of low-sodium salt (salt substitute)?
Yes, I have (Please go to Question 29)
No, I haven’t (End)
Question 29: Do you know that low-sodium salt(salt substitute) has better effects on blood pressure control than regular salt?
Yes, I know
No, I don’t
Question 30: Have you used low-sodium salt?
Yes, I have (End)
No, I haven’t (End)
Footnotes
The opinions expressed by authors contributing to this journal do not necessarily reflect the opinions of the U.S. Department of Health and Human Services, the Public Health Service, the Centers for Disease Control and Prevention, or the authors' affiliated institutions.
Suggested citation for this article: Bi Z, Liang X, Xu A, Wang L, Shi X, Zhao W, et al. Hypertension Prevalence, Awareness, Treatment, and Control and Sodium Intake in Shandong Province, China: Baseline Results From Shandong–Ministry of Health Action on Salt Reduction and Hypertension (SMASH), 2011. Prev Chronic Dis 2014;11:130423. DOI: http://dx.doi.org/10.5888/pcd11.130423.
References
- 1. Wang LD. Nutrition and health status in Chinese people. Beijing (CN): People’s Publishing House; 2005. [Google Scholar]
- 2. Huang JS. The summary report of the National Symposium on Heart and Vascular Diseases. The collection of scientific reports on the National Symposium on Heart and Vascular Diseases. Beijing (CN): People’s Publishing House; 1960. [Google Scholar]
- 3. Anderson CA, Appel LJ, Okuda N, Brown IJ, Chan Q, Zhao L, et al. Dietary sources of sodium in China, Japan, the United Kingdom, and the United States, women and men aged 40 to 59 years: the INTERMAP study. J Am Diet Assoc 2010;110(5):736–45. 10.1016/j.jada.2010.02.007 [DOI] [PMC free article] [PubMed] [Google Scholar]
- 4. Du S, Neiman A, Batis C, Wang H, Zhang B, Zhang J, et al. Understanding the patterns and trends of sodium intake, potassium intake, and sodium to potassium ratio and their effect on hypertension in China. Am J Clin Nutr 2014;99(2):334–43. 10.3945/ajcn.113.059121 [DOI] [PMC free article] [PubMed] [Google Scholar]
- 5.China’s Bureau of Disease Control and Prevention Ministry of Health and China CDC [brochure]. China NCD Report 2011. Beijing (CN); 2011.
- 6. Bibbins-Domingo K, Chertow GM, Coxson PG, Moran A, Lightwood JM, Pletcher MJ, et al. Projected effect of dietary salt reductions on future cardiovascular disease. N Engl J Med 2010;362(7):590–9. 10.1056/NEJMoa0907355 [DOI] [PMC free article] [PubMed] [Google Scholar]
- 7. Tuomilehto J, Jousilahti P, Rastenyte D, Moltchanov V, Tanskanen A, Pietinen P, et al. Urinary sodium excretion and cardiovascular mortality in Finland: a prospective study. Lancet 2001;357(9259):848–51. 10.1016/S0140-6736(00)04199-4 [DOI] [PubMed] [Google Scholar]
- 8. Chinese Center for Disease Control and Prevention. Overall protocols of Chinese Behavioral Risk Factor Surveillance in 2010. http://www.chinacdc.cn/n272442/n272530/n3479265/n3479306/appendix/attach.pdf. Accessed November 27, 2013.
- 9. Zhai F, Guo X, Popkin BM, Ma L, Wang Q, Yu W, et al. Evaluation of the 24-hour individual recall method in China. Food Nutr Bull 1996;17(2):154–61. [Google Scholar]
- 10. Institution of Nutrition and Food Safety, Chinese Center for Disease Control and Prevention. China food composition 2004 book 2. Beijing (CN): Beijing Medical University Press; 2005. [Google Scholar]
- 11. Elliott P, Brown I. Sodium intakes around the world. http://www.who.int/dietphysicalactivity/Elliot-brown-2007.pdf. Accessed November 27, 2013.
- 12. Medical Administration Department of Ministry of Public Health. People’s Republic of China. National guide on clinical laboratory procedures, 3rd edition. Nanjing (CN): Southeast University Publishing House; 2009. [Google Scholar]
- 13. Liu LS, Writing Group of 2010 Chinese Guidelines for the Management of Hypertension. 2010 Chinese guidelines for the management of hypertension. Chin J Cardiol 2011;39(7):579–615. [PubMed] [Google Scholar]
- 14. Ciol MA, Hoffman JM, Dudgeon BJ, Shumway-Cook A, Yorkston KM, Chan L. Understanding the use of weights in the analysis of data from multistage surveys. Arch Phys Med Rehabil 2006;87(2):299–303. 10.1016/j.apmr.2005.09.021 [DOI] [PubMed] [Google Scholar]
- 15. China’s Bureau of Disease Control and Prevention Ministry of Health. Guideline on overweight and obesity control and prevention in China. Beijing (CN): People’s Medical Publishing House; 2006. [Google Scholar]
- 16. Wu Y, Huxley R, Li L, Anna V, Xie G, Yao C, et al. Prevalence, awareness, treatment, and control of hypertension in China: data from the China National Nutrition and Health Survey 2002. Circulation 2008;118(25):2679–86. 10.1161/CIRCULATIONAHA.108.788166 [DOI] [PubMed] [Google Scholar]
- 17. Zhao Y, Lu F, Sun H, Liu Z, Zhao Y, Sun S, et al. Trends in hypertension prevalence, awareness, treatment, and control rates in Shandong Province of China. J Clin Hypertens (Greenwich) 2012;14(9):637–43. 10.1111/j.1751-7176.2012.00670.x [DOI] [PMC free article] [PubMed] [Google Scholar]
- 18. Yang J, Lu F, Zhang C, Liu Z, Zhao Y, Gao F, et al. Prevalence of prehypertension and hypertension in a Chinese rural area from 1991 to 2007. Hypertens Res 2010;33(4):331–7. 10.1038/hr.2009.235 [DOI] [PubMed] [Google Scholar]
- 19. Ma YQ, Mei WH, Yin P, Yang XH, Rastegar SK, Yan JD. Prevalence of hypertension in Chinese cities: a meta-analysis of published studies. PLoS ONE 2013;8(3):e58302. 10.1371/journal.pone.0058302 [DOI] [PMC free article] [PubMed] [Google Scholar]
- 20. Li YC, Wang LM, Jiang Y, Li XY, Zhang M, Hu N. Prevalence of hypertension among Chinese adults in 2010. Chin J Prev Med 2012;46(5):409–13. [PubMed] [Google Scholar]
- 21. Ma GS, Li YP, Wu YF, Zhai FY, Cui ZH, Hu XQ, et al. The prevalence of body overweight and obesity and its changes among Chinese people during 1992 to 2002. Chin J Prev Med 2005;39(5):311–5. [PubMed] [Google Scholar]
- 22. Olives C, Myerson R, Mokdad AH, Murray CJ, Lim SS. Prevalence, awareness, treatment, and control of hypertension in United States counties, 2001–2009. PLoS ONE 2013;8(4):e60308. 10.1371/journal.pone.0060308 [DOI] [PMC free article] [PubMed] [Google Scholar]
- 23. Prince MJ, Ebrahim S, Acosta D, Ferri CP, Guerra M, Huang Y, et al. Hypertension prevalence, awareness, treatment and control among older people in Latin America, India and China: a 10/66 cross-sectional population-based survey. J Hypertens 2012;30(1):177–87. 10.1097/HJH.0b013e32834d9eda [DOI] [PubMed] [Google Scholar]
- 24. Xia H, Li H, Wang WF, Zheng WG, Meng QY. Studying the rate of awareness, treatment and control of hypertension and its influential factors among rural residents in Shandong Province. Chin Health Serv Manage 2008;25(9):614–6. [Google Scholar]
- 25. Li N, Yan LL, Niu W, Labarthe D, Feng X, Shi J, et al. A large-scale cluster randomized trial to determine the effects of community-based dietary sodium reduction — the China Rural Health Initiative Sodium Reduction Study. Am Heart J 2013;166(5):815–22. 10.1016/j.ahj.2013.07.009 [DOI] [PMC free article] [PubMed] [Google Scholar]
- 26. Liem DG, Miremadi F, Keast RSJ. Reducing sodium in foods: the effect on flavor. Nutrients 2011;3(6):694–711. 10.3390/nu3060694 [DOI] [PMC free article] [PubMed] [Google Scholar]
- 27. Girgis S, Neal B, Prescott J, Prendergast J, Dumbrell S, Turner C, et al. A one-quarter reduction in the salt content of bread can be made without detection. Eur J Clin Nutr 2003;57(4):616–20. 10.1038/sj.ejcn.1601583 [DOI] [PubMed] [Google Scholar]
- 28. He FJ, Brinsden HC, Macgregor GA. Salt reduction in the United Kingdom: a successful experiment in public health. J Hum Hypertens 2013. 10.1038/jhh.2013.105 [DOI] [PubMed] [Google Scholar]
- 29. Bentley B. A review of methods to measure dietary sodium intake. J Cardiovasc Nurs 2006;21(1):63–7. 10.1097/00005082-200601000-00012 [DOI] [PubMed] [Google Scholar]
- 30. Murakami K, Sasaki S, Takahashi Y, Uenishi K, Watanabe T, Kohri T, et al. Sensitivity and specificity of published strategies using urinary creatinine to identify incomplete 24-h urine collection. Nutrition 2008;24(1):16–22. 10.1016/j.nut.2007.09.001 [DOI] [PubMed] [Google Scholar]
- 31. The Seventh Report of the Joint National Committee on Prevention. Detection, evaluation, and treatment of high blood pressure. http://www.nhlbi.nih.gov/guidelines/hypertension/jnc7full.pdf. Accessed March 3, 2014. [DOI] [PubMed]