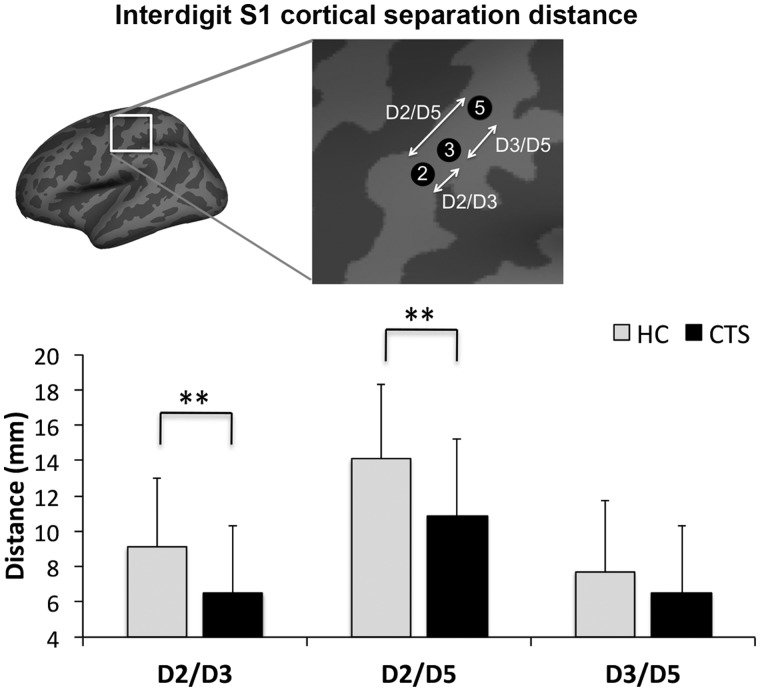
Figure 6.
Subject-level evaluation of somatotopy in contralateral S1. Cortical separation distance was significantly lower in CTS compared to healthy control subjects (HC) for D2/D3 (CTS: 6.5 ± 3.8 mm, healthy control subjects: 9.1 ± 3.9 mm, mean ± SD P < 0.01) and D2/D5 (CTS: 10.9 ± 4.3 mm, healthy control subjects: 14.1 ± 4.2 mm, mean ± SD P < 0.01). However, the D3/D5 separation distance was not significantly different between groups (CTS: 6.5 ± 3.8 mm, healthy control subjects: 7.7 ± 4.0 mm, mean ± SD).

