

Abstract
Objectives:
Among antiretroviral therapy (ART)-naive individuals, viral load levels tend to increase and CD4+ cell counts decline over time. We sought to explore the rate of change and influence of other factors associated with these markers of HIV progression.
Design:
An observational cohort collaboration study.
Methods:
A total of 158 385 pairs of consecutive viral load and CD4+ cell count simultaneously measured from 34 384 ART-naive individuals in the COHERE database were analysed. Annual changes and factors associated with these changes were estimated using generalized estimating equations.
Results:
Viral load continued to rise at a mean [95% confidence interval (CI)] rate of 0.091 (0.086–0.096) log10 copies/ml per year. A faster rise in viral load was significantly associated with older age, such that for every 10 years older, it was a mean 0.022 log10 copies/ml per year greater. The mean (95% CI) CD4+ cell count change was −78.0 (−80.1 to −76.0) cell/μl per year and it was strongly associated with a higher current viral load: for every 1 log10 copies/ml higher, CD4+ cell count declined by an additional 37.6 cells/μl per year (P < 0.001). Current viral load was a stronger predictor of CD4+ cell count depletion than baseline viral load. Neither sex, race nor transmission by injecting drug use was associated with change in either the viral load or CD4+ cell count.
Discussion:
We found that in ART-naive individuals, viral load continues to increase over time and more sharply in those who are older. Our results also suggest that higher current viral load is strongly associated with ongoing rate of CD4+ cell count depletion.
Keywords: antiretroviral-naive, CD4+ lymphocyte count, HIV, HIV viral load
Introduction
HIV infection in antiretroviral therapy (ART)-naive individuals is typically characterized by a rise in plasma HIV RNA (viral load) and a decline in CD4+ cell count. If left untreated, this eventually leads to opportunistic infections, development of AIDS and AIDS-related deaths [1–4]. Although viral load and CD4+ cell count are well established prognostic markers of HIV disease progression [2,5,6], some uncertainties remain over the rate of change of viral load prior to starting ART and the relationship with change in CD4+ cell count [7]. A full description of HIV natural history in terms of these markers is important because these are used to guide clinical decisions such as timing of ART initiation [7]. Furthermore, comprehensive data on viral load and CD4+ cell count changes are necessary to inform the structure and parameterization of mathematical models of HIV [8,9]. Here, we generate more precise estimates relating to factors associated with short-term pre-ART changes in viral load and CD4+ cell count in a large cohort collaboration.
Methods
Study population
The Collaboration of Observational HIV Epidemiological Research Europe (COHERE) is a collaboration of 36 HIV cohorts within the EuroCoord (www.EuroCoord.net) network [10].
Statistical methods
All available viral load and CD4+ cell count measurements from HIV-positive adults (aged >16 years) participating in the COHERE study measured prior to ART initiation were considered. We included pairs of consecutive viral load and CD4+ cell count values measured between 60 and 365 days apart. The time of the first measurement of the pair is termed t0 and the second, t1. Viral load measurements were required to be measured within 1 week of each of the two CD4+ cell count measurements. Three consecutive viral load and CD4+ cell count measurements were required per individual for study inclusion, so that the measurement taken prior to the pair (at time t-1) could be included as an additional covariate in the model to minimize biases due to regression to the mean. Pairs were excluded if the difference between consecutive viral load measurements was greater than 0.8 log10 copies/ml (due to suspected data errors related to unrecorded ART-use) or if CD4+ cell count at t0 was less than 100 cells/μl (because there is less scope for decline).
Factors associated with short-term viral load and CD4+ cell count changes were evaluated using linear regression with an autoregressive correlation structure and generalized estimating equations to take into account repeated measures per individual. The response variable was the annualized change in measurement, that is, [(measurement at t1 – measurement at t0) × 365]/(t1 – t0). Covariates of interest were current viral load (only in CD4+ cell count change analysis), current CD4+ cell count (only in viral load change analysis), current age, sex, race and whether likely route of HIV transmission was injection drug use (IDU-transmission). ‘Current’ was defined as at t0.
In a subanalysis, we investigated the effect of baseline viral load and current viral load on CD4+ cell count changes. Baseline for each patient was defined as the first date on which both viral load and CD4+ cell count were available. In this subanalysis, pairs of CD4+ cell counts were included only if viral load at t0 was measured at least 1 year from baseline.
The sensitivity of results was first assessed by fitting mixed models. In another sensitivity analysis, calendar year (linearly and using 5-year categories) was included as an additional covariate. The CD4+ cell count models used the absolute scale for CD4+ cell count for ease of interpretation, but we also considered CD4+ cell count transformed to the square root scale (wherein the assumption of normality is more likely to hold). As the inclusion criteria would result in inclusion of fewer pairs from individuals started on ART earlier (i.e. fast progressors), we carried out a further sensitivity analysis in which only the first pair per person was included. Finally, we excluded pairs of observations in which the difference between consecutive viral load measurements was greater than 1.5 log10 copies/ml (as opposed to 0.8 log10 copies/ml in the main analysis).
All analyses were performed using SAS software, Version 9.3 (SAS Institute Inc., Cary, North Carolina, USA).
Results
Descriptive analyses
We included 34 384 individuals who contributed 158 385 pairs of viral load and corresponding CD4+ cell count measurements between 1984 and 2011. The median number of pairs of observations per person was three (interquartile range, IQR: 2–7). The median time between consecutive viral load and CD4+ cell count measurements was 4 (3–5) months. At baseline, median age, viral load and CD4+ cell count were 34 (28–40) years, 4.0 (2.7–4.7) log10 copies/ml and 477 (362–625) cells/μl, respectively. Demographic characteristics of individuals were as follows: 73% male, HIV transmission route: MSM (47%), heterosexual (34%), IDU (12%), other/unknown (7%) and race: black (5%), white (34%) and other/unknown (61%).
Mean (95% confidence interval, 95% CI) change in viral load was 0.091 (0.086–0.096) log10 copies/ml per year (median: 0; IQR: −0.41 to +0.64) and mean change in CD4+ cell count was −78.0 (−80.1 to −76.0) cells/μl per year (median: −73.1; IQR: −273 to +114). Both changes were non-zero (P < 0.001). Median viral load and CD4+ cell count at t0 across all pairs were 4.1 log10 copies/ml and 463 cells/μl, respectively.
Rise in viral load
Estimated increases in viral load were significantly greater in older people (P < 0.001) at an additional 0.022 (95% CI, 0.017–0.027) log10 copies/ml per year greater per 10 years older (Table 1). In contrast, viral load change was 0.026 (95% CI, −0.031 to −0.021) log10 copies/ml per year smaller for every 1 log10 copies/ml higher the viral load at t-1. There was no evidence of an association with sex, race or IDU-transmission. However, we did find some evidence of an age–sex interaction (P = 0.03). For example, mean viral load increase was 0.16 (95% CI, 0.12–0.20) log10 copies/ml per year in women aged greater than 55 years, but 0.11 (95% CI, 0.09–0.14) in men aged greater than 55 years.
Table 1.
Factors associated with the annualised change in viral load and CD4+ cell count.
| Model parameter | Estimate | 95% CI | P | |
| Viral load model | Intercepta | 0.093 | 0.086–0.10 | <0.001 |
| Viral load at t−1 (per 1 log10 copies/ml higher) | −0.026 | −0.031 to −0.021 | <0.001 | |
| CD4+ cell count at t0 (per 100 cells/μl higher) | −0.004 | −0.007 to −0.002 | <0.001 | |
| Age at t0 (per 10 years higher) | 0.022 | 0.017–0.027 | <0.001 | |
| Female | 0.004 | −0.006 to 0.014 | 0.42 | |
| Black race | −0.019 | −0.04–0.002 | 0.07 | |
| Transmission by IDU | −0.011 | −0.024 to 0.003 | 0.12 | |
| CD4+ cell count model | Interceptb | −69.0 | −71.8 to −66.2 | <0.001 |
| CD4+ cell count at t−1 (per 100 cells/μl higher) | −17.0 | −18.1 to −15.9 | <0.001 | |
| Viral load at t0 (per 1 log10 copies/ml higher) | −37.6 | −39.6 to −35.7 | <0.001 | |
| Age at t0 (per 10 years higher) | −1.7 | −3.3 to −0.03 | 0.046 | |
| Female | −0.8 | −4.2 to 2.7 | 0.67 | |
| Black race | 2.3 | −3.8 to 8.3 | 0.48 | |
| Transmission by IDU | 0.7 | −4.6 to 6.0 | 0.80 |
Annualized change in viral load (copies/ml, log10 scale) and CD4+ cell count (cells/μl, absolute scale) was defined as [(measurement at t1 – measurement at t0) × 365]/(t1 – t0). All continuous variables were centred, see a,bbelow), estimate sizes and 95% confidence intervals (CI) from a multivariable linear regression model. IDU, injecting drug use.
aThe intercept in the viral load model is the annual change in viral load for an individual with viral load at t−1 = 4 log10 copies/ml, CD4+ cell count at t0 = 500 cells/μl, age at t0 = 35 years, male, white race and transmission mode other than by IDU.
bThe intercept in the CD4+ cell count model is the annual change in CD4+ cell count for an individual with viral load at t0 = 4 log10 copies/ml, CD4+ cell count at t-1 = 500 cells/μl, age at t0 = 35 years, male, white race and transmission mode other than by IDU.
Other comments: The reference race group is white race. All other people who were not classified as black or white race were also included in the model but in a separate category (not shown).
Decline in CD4+ cell count
Current viral load (at t0) was the strongest predictor of CD4+ cell count decline (P < 0.001); for every 1 log10 copies/ml increase in viral load, CD4+ cell count declined on average by a further −37.6 (95% CI, −39.6 to −35.7) cells/μl per year (Table 1). The shape of this association was considered in detail by plotting mean CD4+ cell count change according to current viral load (Fig. 1). The mean (95% CI) change in CD4+ cell count varied from −5 (−23 to 13) cells/μl per year if viral load was less than 200 copies/ml, to −225 (−301 to −150) cells/μl per year if viral load was more than 1 000 000 copies/ml.
Fig. 1.
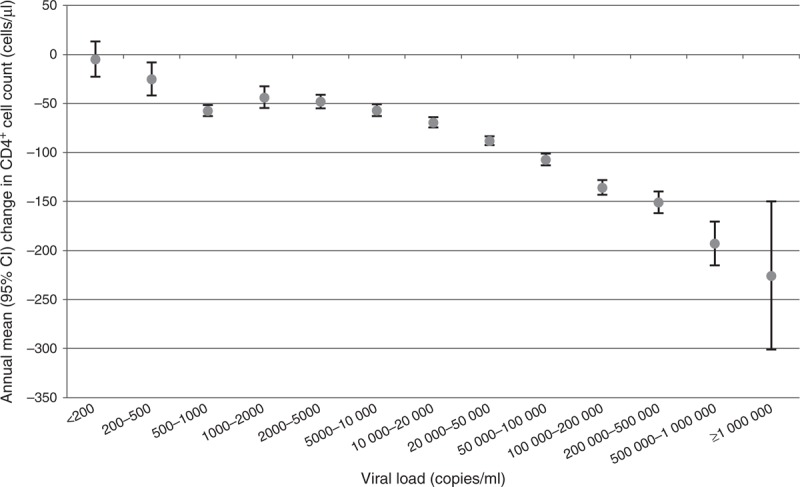
Estimated CD4+ cell count decline per year by viral load category at t0.
There was some evidence of a small age effect; CD4+ cell count declined by an additional 1.7 cells/μl per year (P = 0.05) per 10-year increase. This effect was found to be even stronger (3.3 cells/μl per year decline per 10-year increase, P < 0.001) if viral load was removed from the statistical model. Sex, race and IDU-transmission were not associated with CD4+ cell count decline, nor was there any evidence of an interaction.
For pairs in which t0 was more than 1 year from baseline, we also assessed the effects of adjusting for baseline viral load additionally to current viral load. Median (IQR) time from baseline to t0 was 2.6 (1.7–4.2) years. When the model included only baseline viral load, we found that every 1 log10 copies/ml increase in baseline viral load was associated with an estimated −14 cells/μl per year greater CD4+ cell count decline (P < 0.001). However, when including both baseline and current viral load, baseline viral load was not as influential as current viral load, which had a higher statistical significance (results not shown).
Sensitivity analyses
Similar estimates were obtained for both the viral load change and CD4+ cell count change models when using a mixed-model approach and also when adjusting for calendar year (results not shown).
We also fitted a model in which all CD4+ cell count measurements were square root-transformed. This model (which had quasi-AIC, a goodness-of-fit statistic, 0.01 smaller) estimated the annual CD4+ cell count change (square root scale) to be −1.83 (95% CI, −1.76 to −1.89). We found that higher viral load at t0 (P < 0.001) and white race (P = 0.01) were associated with a steeper CD4+ cell count decline. There was no evidence of an effect of age (P = 0.1) or sex (P = 0.8).
In another sensitivity analysis in which only the first measured pair per person was included, estimated CD4+ cell count depletion was −76.1 cells/μl per year. This was a steeper decline than in the main analysis, in which faster progressors were probably under-represented and therefore the decline was potentially underestimated. Viral load rise was now estimated to be 0.064 log10 copies/ml per year (instead of 0.093).
In the main analysis, 11.0% of pairs were excluded as the difference between consecutive viral load measurements was greater than 0.8 log10 copies/ml. In a further analysis using 1.5 log10 copies/ml as the cut-off, 4.0% of pairs were excluded. Results did not change considerably: mean CD4+ cell count and viral load change were −77.6 cells/μl per year and 0.130 log10 copies/ml per year, respectively.
Discussion
Our analyses have provided precise estimates of short-term viral load and CD4+ cell count changes in people who have not yet started ART and of the relationship, or lack thereof, with age, sex, race and transmission by IDU.
The current viral load, to a much greater degree than any previous measure, determines the ongoing rate of CD4+ cell count depletion. On average, the viral load continues to rise gradually in ART-naive individuals and our findings do not support the concept of a single ‘set-point’. Although the ‘set-point’ is a useful concept to describe the level at which viral load settles down to after primary infection, the fact that levels tend to gradually increase over time should not be overlooked [11]. Our estimate of a mean 0.091 log10 copies/ml per year rise in viral load is consistent with previous findings [1,11–13]. Although this increase may seem small, the clinical relevance is clearer on the untransformed scale: for example, an untreated individual with a viral load of 10 000 copies/ml who remains untreated will on average reach 12 300 and 28 500 copies/ml after 1 and 5 years, respectively.
Age was significantly associated with the change in viral load. Faster rises were observed in older people, although the effect size was rather small. However, there may be potential implications for the infectiousness of older people, who even after primary infection have higher viral load than younger people. In this analysis, we also found that the effect of age on CD4+ cell count depletion seemed to be moderated by the effect of age on viral load. Studies have previously found older age to be strongly associated with faster CD4+ cell count decline [5,7,14].
Our study has the advantage that, notwithstanding the limitations mentioned below, the results should be fairly generalizable due to the large size of the COHERE dataset. Despite this, we did not observe any evidence of an association between changes in the viral load and CD4+ cell count with either sex, race or transmission by IDU.
Limitations include that the rate of CD4+ cell count decline was estimated in people with CD4+ cell count at t0 greater than 100 cells/μl (although this excluded only 0.7% of pairs). In addition, CD4+ cell count depletion could have been underestimated if measurements taken once individuals had actually started ART were included, although no data indicated so (as suggested by the lowest viral load category in Fig. 1). There may also be selection bias due to loss to follow-up and less follow-up in people likely to start ART earlier (e.g. people with faster CD4+ cell count decline), although large differences in results seem unlikely. Residual confounding of factors including viral tropism or subtype cannot be excluded [7]. Finally, CD4+ cell count measurements can vary appreciably [15] and some bias due to regression to the mean may still remain.
In this study, we found that in ART-naive individuals, faster viral load rise was strongly associated with older age and faster CD4+ cell count depletion was strongly associated with a higher current viral load. These estimates, which largely confirm previous observations [2,11,13,14], also provide further data on factors associated with the natural course of HIV infection and, in particular, allow precise characterization of the mean rate of CD4+ cell count decline to be expected according to current viral load level.
Acknowledgements
The Natural History Project Working Group included Fumiyo Nakagawa, Rebecca Lodwick, Colette Smith, Dominique Costagliola, Ard van Sighem, Bruno Ledergerber, Antonella d’Arminio Monforte, Maria Dorrucci, Carlo Torti, Ignacio Suarez-Lozano, Niels Obel, Norbert Brockmeyer, Rodolphe Thiebaut, Jens Lundgren, Antonella Castagna, Belén Alejos, Stéphane De Wit, Robert Zangerle, Nikos Pantazis, Kathrin Ehren, Jordi Casabona, Jesper Grarup, Geneviève Chêne, Andrew Phillips.
COHERE Steering Committee: Contributing Cohorts included Robert Zangerle (AHIVCOS), Giota Touloumi (AMACS), Josiane Warszawski (ANRS CO1 EPF/ANRS CO11 OBSERVATOIRE EPF), Laurence Meyer (ANRS CO2 SEROCO), François Dabis (ANRS CO3 AQUITAINE), Murielle Mary Krause (ANRS CO4 FHDH), Jade Ghosn (ANRS CO6 PRIMO), Catherine Leport (ANRS CO8 COPILOTE), Peter Reiss (ATHENA), Ferdinand Wit (ATHENA), Maria Prins (CASCADE), Heiner C Bucher (CASCADE), Caroline Sabin (CHIC), Diana Gibb (CHIPS), Gerd Fätkenheuer (Cologne Bonn), Julia Del Amo (CoRIS), Niels Obel (Danish HIV Cohort), Claire Thorne (ECS), Amanda Mocroft (EuroSIDA), Ole Kirk (EuroSIDA), Christoph Stephan (Frankfurt), Santiago Pérez-Hoyos (GEMES-Haemo), Osamah Hamouda (German ClinSurv), Barbara Gussenheimer-Bartmeyer (German ClinSurv), Antoni Noguera-Julian (NENEXP and CORISPE-cat), Andrea Antinori (ICC), Antonella d’Arminio Monforte (ICONA), Norbert Brockmeyer (KOMPNET), José Ramos (Madrid Cohort), Manuel Battegay (MoCHIV and SHCS), Andri Rauch (SHCS), Cristina Mussini (Modena Cohort), Pat Tookey (NSHPC), Jordi Casabona (PISCIS), Jose M. Miró (PISCIS), Antonella Castagna (San Raffaele), Stephane de Wit (St. Pierre Cohort), Tessa Goetghebuer (St. Pierre Paediatric Cohort), Carlo Torti (Italian Master Cohort), Ramon Teira (VACH), Myriam Garrido (VACH). Paediatric cohort representatives: Ali Judd, Josiane Warszawski. European AIDS Treatment Group: David Haerry.
COHERE Executive Committee included Ian Weller (Chair, COHERE), Jordi Casabona (PISCIS), Dominique Costagliola (FHDH), Antonella d’Arminio-Monforte (ICONA), Manuel Battegay (MoCHIV and SHCS), Stephane de Wit (St. Pierre Cohort), Julia Del Amo (CoRIS), Jesper Grarup (Head, Copenhagen Regional Coordinating Centre), Geneviève Chêne (Head, Bordeaux Regional Coordinating Centre).
COHERE Regional Coordinating Centres (RCC) included Bordeaux RCC: Céline Colin, Christine Schwimmer, Monique Termote, Diana Barger; Copenhagen RCC: Jesper Kjaer, Maria Campbell, Dorthe Raben.
Project leaders and statistical analysis included Manuel Battegay, Julia Bohlius, Vincent Bouteloup, Heiner Bucher, Alessandro Cozzi-Lepri, François Dabis, Antonella d’Arminio Monforte, Julia del Amo, Maria Dorrucci, Matthias Egger, Frederik Engsig, Hansjakob Furrer, Ali Judd, Ole Kirk, Olivier Lambotte, Charlotte Lewden, Sara Lodi, Rebecca Lodwick, Sophie Matheron, Laurence Meyer, Jose Miro, Amanda Mocroft, Susana Monge, Fumiyo Nakagawa, Niels Obel, Roger Paredes, Andrew Phillips, Massimo Puoti, Joanne Reekie, Caroline Sabin, Alexandra Scherrer, Colette Smit, Jonathan Sterne, Rodolphe Thiebaut, Claire Thorne, Carlo Torti, Giota Touloumi, Linda Wittkop.
The COHERE study group has received generic funding from Agence Nationale de Recherches sur le SIDA et les Hépatites Virales (ANRS), France; HIV Monitoring Foundation, the Netherlands; and the Augustinus Foundation, Denmark. The research leading to these results has received funding from the European Union Seventh Framework Programme (FP7/2007–2013) under EuroCoord grant agreement no. 260694. The EuroCoord acknowledgment appendix may be found at http://www.cphiv.dk/COHERE/StudyDocuments/tabid/298/Default.aspx. A list of the funders of the participating cohorts can be found on the COHERE website at http://www.cohere.org.
Conflicts of interest
All authors report no conflicts of interest.
Contributor Information
Collaborators: The Natural History Project Working Group∗ for the Collaboration of Observational HIV Epidemiological Research Europe (COHERE)∗ in EuroCoord
References
- 1.Sabin CA, Devereux H, Phillips AN, Hill A, Janossy G, Lee CA, et al. Course of viral load throughout HIV-1 infection. J Acquir Immune Defic Syndr 2000; 23:172–177 [DOI] [PubMed] [Google Scholar]
- 2.Mellors JW, Munoz A, Giorgi JV, Margolick JB, Tassoni CJ, Gupta P, et al. Plasma viral load and CD4+ lymphocytes as prognostic markers of HIV-1 infection. Ann Intern Med 1997; 126:946–954 [DOI] [PubMed] [Google Scholar]
- 3.Lyles RH, Munoz A, Yamashita TE, Bazmi H, Detels R, Rinaldo CR, et al. Natural history of human immunodeficiency virus type 1 viremia after seroconversion and proximal to AIDS in a large cohort of homosexual men. J Infect Dis 2000; 181:872–880 [DOI] [PubMed] [Google Scholar]
- 4.Phillips AN, Lee CA, Elford J, Janossy G, Timms A, Bofill M, et al. Serial lymphocyte CD4 counts and development of AIDS. Lancet 1991; 337:389–392 [DOI] [PubMed] [Google Scholar]
- 5.CASCADE Collaboration Short-term risk of AIDS according to current CD4 cell count and viral load in antiretroviral drug-naive individuals and those treated in the monotherapy era. AIDS 2004; 18:51–58 [DOI] [PubMed] [Google Scholar]
- 6.Goujard C, Bonarek M, Meyer L, Bonnet F, Chaix ML, Deveau C, et al. CD4 cell count and HIV DNA level are independent predictors of disease progression after primary HIV type 1 infection in untreated patients. Clin Infect Dis 2006; 42:709–715 [DOI] [PubMed] [Google Scholar]
- 7.Langford S, Ananworanich J, Cooper D. Predictors of disease progression in HIV infection: a review. AIDS Res Ther 2007; 4:11. [DOI] [PMC free article] [PubMed] [Google Scholar]
- 8.Cambiano V, Phillips AN. Modelling the impact of treatment with individual antiretrovirals. Curr Opin HIV AIDS 2011; 6:124–130 [DOI] [PubMed] [Google Scholar]
- 9.Phillips AN, Sabin C, Pillay D, Lundgren JD. HIV in the UK 1980–2006: reconstruction using a model of HIV infection and the effect of antiretroviral therapy. HIV Med 2007; 8:536–546 [DOI] [PubMed] [Google Scholar]
- 10.The Collaboration of Observational HIV Epidemiological Research Europe (COHERE) study group Response to combination antiretroviral therapy: variation by age. AIDS 2008; 22:1463–1473 [DOI] [PubMed] [Google Scholar]
- 11.Phillips AN, Lampe FC, Smith CJ, Geretti AM, Rodger A, Lodwick RK, et al. Ongoing changes in HIV RNA levels during untreated HIV infection: implications for CD4 cell count depletion. AIDS 2010; 24:1561–1567 [DOI] [PubMed] [Google Scholar]
- 12.Touloumi G, Pantazis N, Babiker AG, Walker SA, Katsarou O, Karafoulidou A, et al. Differences in HIV RNA levels before the initiation of antiretroviral therapy among 1864 individuals with known HIV-1 seroconversion dates. AIDS 2004; 18:1697–1705 [DOI] [PubMed] [Google Scholar]
- 13.Rodriguez B, Sethi AK, Cheruvu VK, Mackay W, Bosch RJ, Kitahata M, et al. Predictive value of plasma HIV RNA level on rate of CD4 T-cell decline in untreated HIV infection. JAMA 2006; 296:1498–1506 [DOI] [PubMed] [Google Scholar]
- 14.Touloumi G, Hatzakis A, Rosenberg PS, O’Brien TR, Goedert JJ. Effects of age at seroconversion and baseline HIV RNA level on the loss of CD4+ cells among persons with hemophilia. AIDS 1998; 12:1691–1697 [DOI] [PubMed] [Google Scholar]
- 15.Malone JL, Simms TE, Gray GC, Wagner KF, Burge JR, Burke DS. Sources of variability in repeated T-helper lymphocyte counts from human immunodeficiency virus type 1-infected patients - total lymphocyte count fluctuations and diurnal cycle are important. J Acquir Immune Defic Syndr Hum Retrovirol 1990; 3:144–151 [PubMed] [Google Scholar]