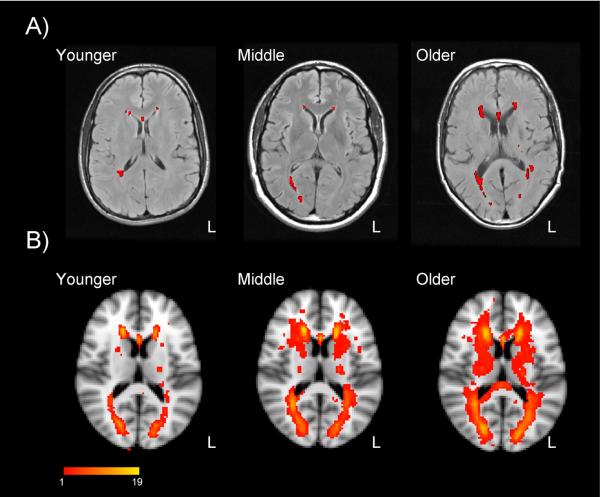
Figure 9.
White matter lesion volume. Panel A: White matter lesions for individual adults 20, 48, and 65 years of age, in T2-weighted FLAIR images. Participants were healthy, community-dwelling individuals without any sign of cognitive impairment on neuropsychological testing or history of cardiovascular disease (other than hypertension). Lesions, as identified from a semi-automated program separating lesions from normal white matter appear in red. Panel B: Composite lesion maps for 23 younger adults (19–39 years of age), 19 middle-aged adults (40–59 years of age), and 16 older adults (60–79 years of age), overlaid on a T1-weighted template. Images are in radiological orientation (left = right). Color scale represents the number of individuals within each group exhibiting a lesion, per voxel. Authors' unpublished data.

