Abstract
Purpose: The use of contrast agents in breast imaging has the capability of enhancing nodule detectability and providing physiological information. Accordingly, there has been a growing trend toward using iodine as a contrast medium in digital mammography (DM) and digital breast tomosynthesis (DBT). Widespread use raises concerns about the best way to use iodine in DM and DBT, and thus a comparison is necessary to evaluate typical iodine-enhanced imaging methods. This study used a task-based observer model to determine the optimal imaging approach by analyzing six imaging paradigms in terms of their ability to resolve iodine at a given dose: unsubtracted mammography and tomosynthesis, temporal subtraction mammography and tomosynthesis, and dual energy subtraction mammography and tomosynthesis.
Methods: Imaging performance was characterized using a detectability index d′, derived from the system task transfer function (TTF), an imaging task, iodine signal difference, and the noise power spectrum (NPS). The task modeled a 10 mm diameter lesion containing iodine concentrations between 2.1 mg/cc and 8.6 mg/cc. TTF was obtained using an edge phantom, and the NPS was measured over several exposure levels, energies, and target-filter combinations. Using a structured CIRS phantom, d′ was generated as a function of dose and iodine concentration.
Results: For all iodine concentrations and dose, temporal subtraction techniques for mammography and tomosynthesis yielded the highest d′, while dual energy techniques for both modalities demonstrated the next best performance. Unsubtracted imaging resulted in the lowest d′ values for both modalities, with unsubtracted mammography performing the worst out of all six paradigms.
Conclusions: At any dose, temporal subtraction imaging provides the greatest detectability, with temporally subtracted DBT performing the highest. The authors attribute the successful performance to excellent cancellation of inplane structures and improved signal difference in the lesion.
Keywords: iodine, tomosynthesis, dual energy, temporal, detectability index
INTRODUCTION
Digital Mammography (DM) is currently one of the most widely accepted modalities for breast cancer screening. However, it has historically demonstrated poor sensitivity1, 2, 3, 4, 5 and specificity.1, 4 In particular, mammography has worse positive predictive value for patients with denser breasts.4 Because a single radiographic projection is taken of the breast, mammograms comprise a superposition of tissue architecture, resulting in an image where healthy and abnormal tissues are difficult to distinguish. In comparison, digital breast tomosynthesis (DBT) is a new imaging technique that provides 3D structural information of the breast. As a form of limited-angle cone-beam CT, DBT acquires multiple projections that are reconstructed into a tomographic volume, enabling slice by slice positioning through the breast. The elimination of overlapping structures has the potential to improve lesion detectability and reduce unnecessary recalls.3, 4, 6, 7, 8
Breast imaging with iodine as a contrast-enhancing medium may improve lesion conspicuity since signal in the nodule enhances much more than the background. Another benefit of using a contrast agent is potential functional information of the vessels surrounding the tumor. The angiogenesis of tumor cells not only increases the number of blood vessels feeding the tumor, but the distinctly leaky neovasculature9 releases contrast outside the vessels. The result is a pooling of fluid, which provides tumor kinetics when monitored over time. This information may be used to differentiate benign versus malignant tissues, as studies have shown that malignant lesions enhance to a greater extent and with different kinetic patterns compared to benign lesions.10 Although iodine enhanced imaging may be interpreted without any subtraction for DM and DBT, in practice image subtraction schemes are usually employed in order to maximize nodule visibility by eliminating the parenchymal clutter.
For temporal subtraction (TS), the iodine-only image is produced by subtraction of a preinjection and postinjection image. Dual energy (DE) subtraction involves subtraction of low and high energy images, both taken after contrast injection. The purpose of this study is to quantitatively determine which imaging method provides the highest detectability for a given mean glandular dose (MGD) and iodine concentration within a lesion.
Previous reports assessed tomosynthesis and mammography, but those studies were often limited by relatively few modalities, varying doses, and different figures of merit. In tomosynthesis, imaging components have been described through mathematical models and cascaded systems analysis,11, 12, 13 while other studies have used a task-based approach to quantifying the imaging capabilities. In particular, focus has been placed on how reconstruction and noise properties are affected by acquisition parameters, such as timing of high energy/low energy acquisition,14, 15 total tube rotation, number of projections, and how these properties determine lesion detectability16, 17, 18 and “estimability.”11, 19 In addition, clinical trials have been performed to evaluate the viability of iodine-enhanced imaging. For example, Lewin and associates looked exclusively at the clinical feasibility of dual energy subtraction in mammography;20 however, no DE optimization was reported. Diekman et al. not only explored enhancement of nodule visibility in unsubtracted and temporally subtracted mammography,21 but also improvement of image quality when tomosynthesis was used in comparison to unsubtracted, temporally subtracted, and dual energy subtracted mammography.22 In addition, Carton et al.23 compared temporal and dual energy subtraction in tomosynthesis with patient data, and Dromain and associates2, 24 made similar comparison for mammography. An observer study by Gavenonis and associates compared the visibility of breast cancer morphology features across DE-DBT, TS-DBT, DM, and MRI.25 The study confirmed the superiority of iodine enhanced DBT in accurately representing tissue morphology. However, the visibility of anatomy was described qualitatively, resulting in the need to assess the extent of conspicuity. These trials provide important information about clinical performance, but it is not practicable to control every detail of the imaging process in the way that physical analysis can. Our study is the first to assess unsubtracted, temporal subtraction, and dual energy subtraction DM and DBT together across consistent MGD values and using a single figure of merit.
METHODS
Theory for task-based optimization
The ICRU Report #54 on image quality emphasizes measuring the performance of an imaging system with metrics that place into context the intended task.26 A basic approach involves measuring or modeling the resolution (modulation transfer function) and noise (noise power spectrum) components to arrive at a description of detective quantum efficiency (DQE) or noise equivalent quanta (NEQ). NEQ on its own provides an objective measurement of signal degradation due to finite spatial sampling as well as quantum and electronic noise; however, it fails to account for system response to a specific classification task. Inclusion of a task function in the figure of merit can relate image quality to actual observer performance through the detectability index d′, which weights the NEQ with respect to the desired task
| (1) |
where W(f) is the detection task. In addition, d′ has been shown to correlate with human observer performance16, 27 and has been generalized to include anatomical background in evaluating three dimensional and dual energy image quality for a number of imaging objectives.19, 28, 29, 30, 31 For our purposes, the figure of merit employed was similar to the Hotelling observer model described by Burgess et al.,32 but defined as
| (2) |
where TTF(f) is the task transfer function; S is the signal difference (SD) between the lesion and background; NPSA(f), NPSE(f), and NPSQ(f) denote the anatomical, electronic, and quantum noise power spectra, respectively; and f is the spatial frequency variable. The images used in this study represent a confluence of all three noise sources, and a single NPS measurement may be obtained that is their sum. Thus, the equation may be rewritten as the following:
| (3) |
Fourier analysis of the image quality metrics, from an unprocessed projection in mammography and the central slice in tomosynthesis, allowed assessment of a signal known exactly (SKE), background known exactly (BKE) lesion detection task.33
The following further explains the terms used to determine d′. The TTF describes the fidelity of a modality in terms of how well the imaging system can output the frequencies contained in the input object. It is described as the TTF instead of the modulation transfer function since the frequencies contained in the object of interest are task specific. The term W(f) is the Fourier transform of the task, or the decision we wish to model.11 The signal difference is simply the contrast of the lesion relative to the immediate background. It is a scalar quantity that determines the magnitude of the task. Finally, noise in an image can be considered anything that diminishes detectability of an object of interest. In radiographic images, noise comprises electronic noise, quantum noise, and anatomical structure. The electronic noise is a constant factor in both DBT and DM, but the effect of quantum noise may be reduced by increasing the detector exposure. The anatomical background is present in unsubtracted DBT and DM, but may be suppressed to differing degrees using TS or DE subtraction techniques. For a given dose (or quantum noise level), the NPS is a measurement of the total frequency variance in the image. The detectability indices were computed at clinically relevant MGDs for each modality by physical measurement of the d′ parameters.
Clinical imaging system
The system used to acquire all images is a prototype Siemens MAMMOMAT Inspiration system.34 (The use of this system for tomosynthesis and contrast enhanced imaging are investigational and are not currently commercially available in the United States. The information presented below about the device is preliminary, and future availability cannot be ensured.) The machine uses direct detection with amorphous selenium with a pixel pitch of 85 μm with 2816 × 3584 pixels at 660 mm source to image distance. No pixel binning was performed for DM or DBT. Signal from the detector was linear with exposure. The target and filter combination used for low energy images was tungsten and 50 μm thick rhodium, while those of high energy images were tungsten anode and two options for filters: 300 μm copper and 1200 μm titanium. The system was capable of generating energies between 23 and 49 kVp. For mammograms, the x-ray tube produced a single, unprocessed image at normal incidence. For DBT, 25 projections were generated every 2° over 46°, then reconstructed using a filtered backprojection method.35, 36 Both mammograms and DBT projection images underwent logarithmic transformation such that pixel values corresponded to attenuation.
Physical breast phantoms
Two physical breast phantoms were used for characterizing each imaging paradigm. In order to measure the spatial resolution and lesion contrast in conditions typical of the breast, we constructed a 1-cm oil bath phantom with vegetable oil and sandwiched it between two uniform, 2-cm slabs of BR12 material equivalent to 30% glandular fraction (CIRS Inc., Norfolk, VA). Objects were inserted within the 1-cm oil layer for imaging. For the noise power spectrum measurements, a heterogeneous plastic phantom (model 020 BR3D, CIRS Inc., Norfolk, VA) was used which swirled glandular-equivalent and adipose-equivalent material into a marbled pattern similar to the appearance of breast anatomy in radiographic images. The phantom consisted of five 10 mm thick slabs stacked to form a 50 mm compressed breast.
TTF
The TTF assessed signal transfer fidelity using an edge test device. The TTF is used instead of the MTF because the task-specific signal transfer capabilities are desired. The measurement should include scatter and focal spot blur, as they would typically be presented at a given location within the breast. It was assumed that the TTF at high and low energy are equal.30 For this reason the TTF was measured for DM and DBT using only the single low energy, preiodine image. Figure 1 displays the wafer ROIs and resultant functions.
Figure 1.
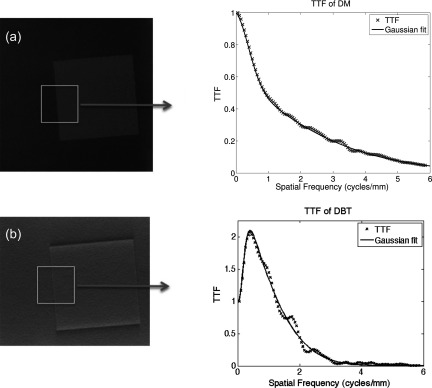
TTF calculation. An iodine-doped wafer was placed in an oil bath phantom and imaged with conventional mammography and tomosynthesis. The edge of the wafer was segmented and used to determine the TTF.
The TTF was determined from the edge of an iodine-doped wafer inserted in the oil bath phantom. Measurements were made using a 100 × 100 × 5 mm (Ref. 3) wafer of 50% glandular breast equivalent material, doped with 8.6 mg/cc iodine (CIRS Inc., Norfolk, VA). The edge was positioned 5 cm from the chest wall and angled between 1° and 3°. For each modality, multiple radiographs were acquired at high exposure to minimize the presence of quantum noise on the edge. In each radiograph, an ROI was circumscribed around the wafer's edge, from which the edge spread function (ESF) was generated. The ESF was differentiated to produce the line-spread function (LSF), which was then smoothed and Fourier transformed to determine the TTF. A detailed methodology for the calculation of the TTF may be found in previous work from our group.37, 38, 39, 40, 41 Typically, the TTF is normalized to unity at the zero frequency since that is where the function peaks. In tomosynthesis images, however, the TTF had a nonmonotonic behavior that peaked at a nonzero frequency of 0.4 cycles/mm. This is due to the limited angle sampling of the projection data and filtering with a ramp-like filter, as well as additional harmonics introduced from edge enhancement features. Previous studies have normalized the TTF to the peak value such that the magnitude is capped at one.13, 42, 43 Normalizing to the TTF value at any frequency other than zero would actually decrease the signal power relative to that peak value, an effect that would be problematic when different modalities and reconstructions are compared. Setting the DC term to unity properly accounts for signal enhanced properties of the system, which can then be accurately multiplied by the zero-frequency contrast enhancement term and a properly normalized task function in the detectability estimation. Multiple TTFs were averaged and fitted with mathematical functions: a second order Gaussian for DM and a Weibull for DBT. The smoothed fits provided a noise-free representation of the transfer function and were used in the subsequent d′ calculations.
NPS
The noise power spectrum was measured using a CIRS 020 phantom, with nothing else in the beam path but the compression paddle. Note that unsubtracted techniques require only a single acquisition (either DM or DBT), while TS and DE subtractions require two acquisitions. The NPS images were acquired at discrete exposure levels to allow for standard comparisons at fixed total glandular doses for the required one or two acquisitions. For unsubtracted DM and DBT, low energy (LE) images were acquired using W/Rh at 28 kVp at discrete exposures between 56 mAs and 240 mAs, corresponding to approximately 0.6 mGy and 3.0 mGy dose, respectively. Spectra were simulated with XSPECT version 4 (Michael Flynn, University of Michigan) and doses were calculated using Boone et al.44 To evaluate DE subtraction, the high energy (HE) radiographs were acquired separately using W/Ti and W/Cu, so the efficacy of DE may be assessed with respect to these two different filtration materials. These high energy DM and DBT images were obtained at 49 kVp with exposures between 56 mAs and 140 mAs, producing doses between 0.6 and 1.4 mGy for W/Cu and 0.9–2.3 mGy for W/Ti. In this study, the dose range was defined on the low end by the minimum exposure setting in the system and on the high end by the MQSA limit of 3.0 mGy. At each dose level, six images were acquired in order to exceed the IEC specification45 of 4 × 10⁶ individual pixels analyzed. To prevent signal lagging, each image was captured with at least a 2 min wait between acquisitions, in order of lowest to highest exposure and from low to high kVp.46
Prior to computation of the NPS for subtraction schemes, it was crucial to ensure proper image registration between the pre- and postiodine images. For TS, a total of seven images were acquired at each of the 4 LE dose levels and used such that one acquisition was the mask from which the other six images were subtracted. Due to slight angular misalignments of the tube in tomosynthesis, the slices of the reconstructed volume are not necessarily identical from one acquisition to another. As a result, any anatomical differences present in the mask or secondary image will be reinforced and cause an increase in the NPS. To prevent this, Elastix47 was used for rigid registration. All pairwise combinations were considered, without repetition, in a round-robin method resulting in 21 subtraction images. Naturally, the subtraction of two input images with the highest correlation results in an output image with low variance. Thus, the six TS images with the lowest variance out of all 21 combinations were selected for NPS calculation. The total dose for each TS image is then twice that of an unsubtracted image. The TS analysis therefore evaluated a total of 6 sets × 4 doses = 24 images.
For DE, the low energy shots taken at 4 dose levels were combined with high energy images at 5 dose levels, resulting in a total of 20 dual energy combinations. Moreover, for each dose level of LE or HE, six acquisitions were performed. For each DE combination, optimal registration was performed in the same round-robin fashion as described for TS, and the six image pairs with highest correlation were selected. The registered pair of images was then log transformed and subtracted as
| (4) |
where IHE is the 49 kVp image, w is the weighting factor, and ILE is the 28 kVp image. The value of w was varied from 0.01 to 1 in increments of 0.01 to find the optimal weighting. This results in six sets of 100 weighted images. This process is repeated with each of the 20 possible high-low image combinations. The DE analysis therefore evaluated a total of 6 sets × 100 weights × 20 doses = 12 000 images.
For all acquisition paradigms, the central portion of the breast in each image was divided into 12 blocks of 256 × 256 ROIs, which were processed with local exposure normalization and a 2D second-order polynomial detrending. The specifics of these methods may be obtained from previous works.37, 39, 41, 46 In the unsubtracted low energy and TS techniques, the NPS at each dose was calculated for the 12 ROIs across the 6 sets of images, and finally results from all 72 ROIs were averaged together. The NPS of the DE paradigms was calculated for each DE subtracted image using the same ROIs, with six power spectra averaged across the six images for each weight. The optimal DE image for a given weighting and total dose was selected to maximize d′.
Imaging task
In lesion detectability, the detection task or decision is the ability to distinguish between two image states: lesion present versus lesion absent. This is represented mathematically as
| (5) |
where r is the radial distance from the image center, w(r) represents the lesion in image space. Accordingly, h1(r) denotes the spatial representation of the lesion function under the hypothesis that it is present in the ROI, while h0(r) represents the function under the hypothesis that the lesion is absent from the ROI.16, 27 Assuming shift invariance and equal noise under both hypotheses, the difference between the two hypotheses is equal to the shape of the lesion. This lesion was mathematically simulated as a radially symmetric nodule48 with an intensity profile as it would appear in a 2D projection. The shape of the 2D lesion followed the equation:
| (6) |
where R is the radius, set to 5 mm, and n is a parameter that determines how rapidly the signal falls off, set to 5. The 3D shape of the lesion was computed from the projection data, thus providing the idealized 3D mask for the task that is independent of any imaging process. The central slice of volume was extracted to represent the idealized slice through the lesion. The 2D and 3D planar images were then suitable to assemble the task function.
To create the tasks for both DM and DBT, a 2D discrete Fourier transform (DFT) was applied to the respective lesions. For DM, lesion had a peak value of unity, and a normalization factor was applied to the task in the frequency domain such that the total signal power corresponded to the area under the lesion profile. In DBT, the reconstructed lesion had a slightly greater radius compared to the DM profile. This increase in the signal power was properly accounted for in the detectability estimation by normalizing the signal power to that of the DM task function in Fig. 2.
Figure 2.
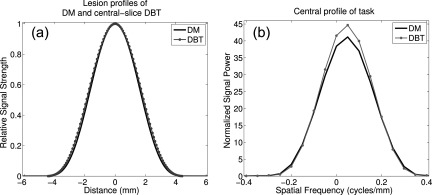
(a) and (b) Lesion profiles with DM (solid) and DBT (dotted) acquisition. Note the slightly larger radius for DBT after 3D reconstruction, and the corresponding increase in task profile.
A different task magnitude may then be created by multiplying W(f) with the observed iodine signal difference for various concentrations. In this sense, our model observer can assess the detectability of a nodule with a fixed radius but varying signal strengths. Effectively, the entire numerator of the d′ variable accounts for the task shape and magnitude, as well as any blurring caused by the transfer function. Hence, the inplane DBT distortions due to artifacts from limited angle sampling become a part of the blurring term.
Signal difference
The amplitude of the lesion, and thus of the task function, was scaled by the signal difference between the background and iodinated lesions. To simulate iodine-enhanced lesions, 50% glandular breast equivalent material was doped with iodine at a concentration of 2.1, 4.3, 6.4, and 8.6 mg/cc (CIRS Inc., Norfolk, VA). Each material was cut into a cylindrical chip, measuring 10 mm in diameter and 5 mm thick, which was placed in the oil bath phantom between the BR12 slabs. Because the log of the image is taken and the signal difference between the chip and the background is low, the small-signal approximation may be used in the Taylor expansion for the difference between natural logs. This results in small signal linearity, which allows approximating the log-transformed data as the output of a linear system. Accordingly, the signal difference is treated independent of dose, and thus the chips were imaged at high exposures (3.33 mGy for low energy, 0.63 mGy for high energy) to minimize the noise in the measurement. The images of the unsubtracted iodine chips were also log transformed prior to measuring the SD. The oil bath was imaged without the chips at the aforementioned low energy dose to emulate a preiodine mask image.
For unsubtracted iodine enhanced imaging, the signal difference was measured directly from the low energy images, using a “signal” region of interest (ROI) inside each chip versus a “background” ROI adjacent to the chip. For the TS paradigms, the preiodine images were subtracted from the postiodine shots, to produce an iodine only image. The same ROIs were used to determine SD. For the DE images, a weighting factor was applied to the low energy image, and the dual energy subtracted image was obtained using the same equation described under Sec. 2E. Again, the weighting factor was varied from 0.01 to 1 in increments of 0.01 to determine the weight that maximizes d′.
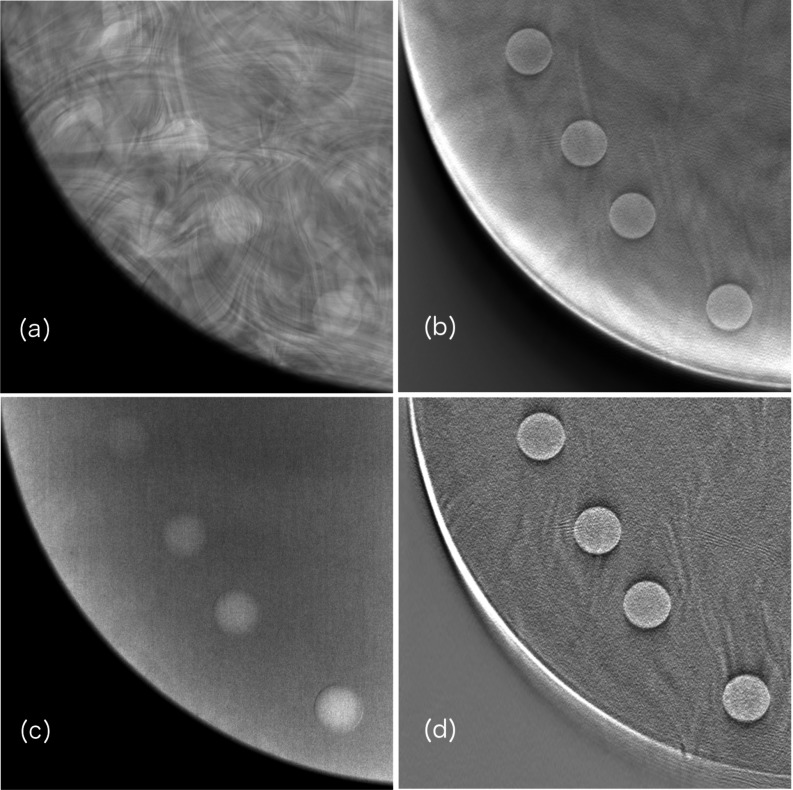
Mammography and tomosynthesis inherently have different sensitivities to subject contrast. The subtraction techniques would further highlight these differences, as TS typically enhances signal difference, while DE subtraction suppresses it. To capture the variation, each mammography and tomosynthesis mode was used to also image the iodine chips in the oil bath, but with two CIRS 020 slabs above and below the oil layer. Selected images are provided in Fig. 3.
Figure 3.
Regions of interest from breast phantom images illustrating intensity of signal difference in various imaging schemes. Shown are (a) unsubtracted mammography, (b) unsubtracted tomosynthesis, (c) DE tomosynthesis, and (d) TS tomosynthesis.
Detectability index
For a given task and acquisition technique, d′ was computed at discrete doses based on the NPS, then interpolated at specific points between 1 and 3 mGy. Because the dose increases in one dimension for unsubtracted and TS imaging, d′ was determined by a linear interpolation at the desired total MGD. However, for DE images, d′ is a function of not only changing LE and HE doses, but also the weighting factor. The resulting d′ is a 4 × 5 × 100 dimensional array. The most favorable d′ for each desired total dose point was found by 2D interpolation at every weight. The optimal weighting factor was selected such that it maximized d′ at the interpolated dose points. This process is briefly illustrated in Fig. 4.
Figure 4.
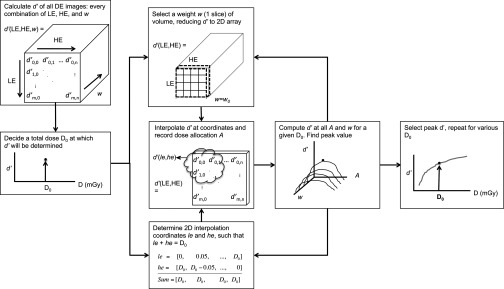
Schematic of how d′ was optimized using every LE/HE image combination and weighting factor.
Within this d′ volume a 2D plane was selected, in which all possible HE/LE image combinations are present for a single weighting. Within this plane, values of d′ were interpolated at locations corresponding to a desired total dose D0. The coordinates of searchable locations within the d′ grid are subsampled indices le and he that sum to D0. This step is necessary for finding d′ among all ways the total dose can be allocated between the two acquisitions. The dose allocation parameter A is defined as
| (7) |
where MGDHE and MGDLE are the mean glandular dose contributions from the HE and LE images, respectively. The weighting is then incremented and the next slice within the volume is selected; this process is repeated over all weighting values. Once all possible values of A and w have been exhausted, the peak value of the distribution is obtained, representing the optimal d′ value for a given dose.
After finding the optimal d′ for each dose and iodine concentration, the values were normalized to the TS-DBT value at 1.5 mGy. This was selected as a normalization point for the following reasons. Because the temporal subtraction acquisitions begin at twice the dose of unsubtracted imaging, it is not possible to calculate d′ at some of the lower doses. In fact, the first MGD at which all data are available is 1.5 mGy. In addition, TS-DBT had the greatest detectability at this dose, and as such it made a reasonable reference point by which the other detectability indices could be compared. So, with the exception of the plots showing d′ versus iodine concentration, the d′ results reported are relative values.
RESULTS
A mammogram of the CIRS 020 breast phantom was used to characterize the anatomical pattern. A power fit was applied with the equation
| (8) |
where kappa is the magnitude of the spectrum, f is the special frequency, beta is related to the fractal dimension, and c is an offset. The variable of interest is the beta term, which models frequency content of the breast. Breast tissue of clinical mammograms typically have β ∼ 3,15, 29 which is very close to our finding of β = 2.9. The image of the phantom and the corresponding fit are provided in Fig. 5.
Figure 5.
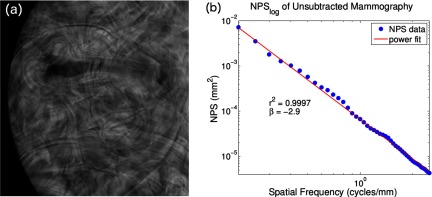
(a) Low energy mammogram of CIRS 020 breast phantom with (b) log–log NPS plot. Power fitting the NPS on a log–log plot yielded a slope of −2.9.
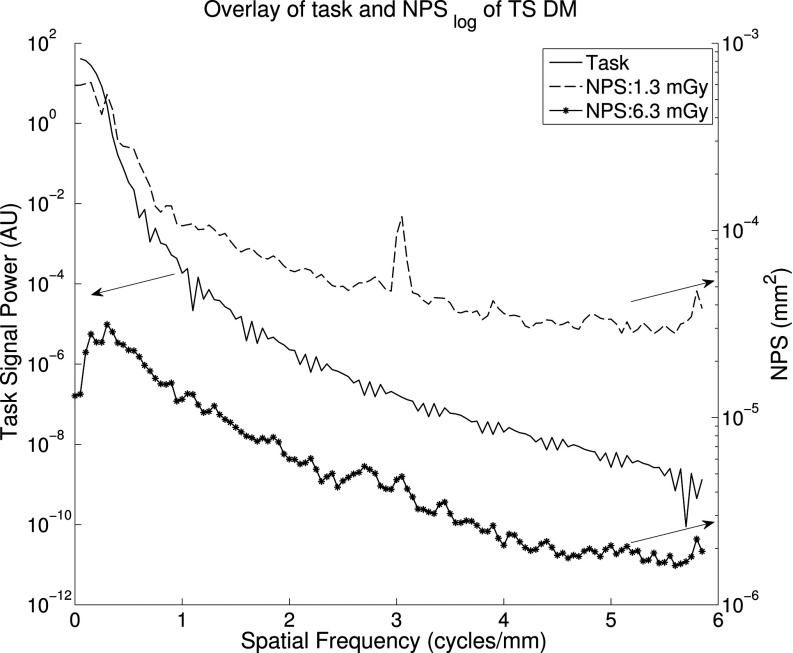
Side-by-side curves are presented in Fig. 6 for unsubtracted and TS mammography. Overall, NPS was reduced with increased dose. As indicated in Fig. 6a, although residual anatomical structure is evident in the lower frequencies at every dose, quantum noise that dominates at higher frequencies is reduced. Spikes are observed at the grid frequency. However, in Fig. 6b two things are immediately evident: (1) compared to (a) subtraction diminishes the amount of low-frequency anatomical noise by at least one order of magnitude for all observed doses, and (2) patient anatomy is reduced substantially with increasing patient dose, as does area under the curve. The integral of the unsubtracted NPS at 3.1 mGy was 3.0 E -3, while that of the subtraction NPS at the same dose was only 8.0 E -4, demonstrating a reduction of 73%. An overlay of the task and two noise power spectra is presented in Fig. 7 to appreciate where most of the signal power is with respect to the noise.
Figure 6.
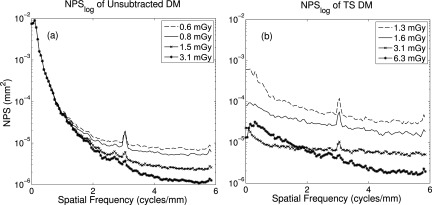
Line trace of 2D NPS from averaging seven rows about the u-axis. (a) In unsubtracted DM, large-scale structures remain similarly visible as patient dose is increased, but quantum noise is reduced. (b) In TS, anatomical structure is substantially eliminated with dose.
Figure 7.
NPS of TS mammography (right axis) compared to task function (left axis). This direct comparison useful in conveying which frequencies contribute the most to d′.
The NPS curves for unsubtracted vs TS tomosynthesis are similarly presented in Fig. 8. In Fig. 8a is the result of unsubtracted DBT across the same doses. Compared to TS, the low frequency content of the images respond poorly to increasing dose, although quantum noise is better suppressed. However, in Fig. 8b the TS schemes prove more successful overall, as well as responding more successfully with increased dose The noise amplitude at and below 1 cycle/mm is reduced by at least 1 order of magnitude compared to unsubtracted DBT, particularly in the region corresponding to anatomical structure.
Figure 8.
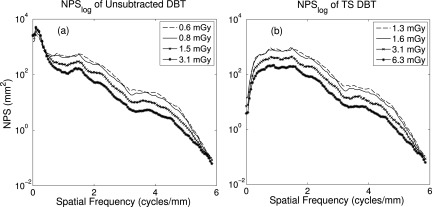
Line trace of NPS, seven rows about u-axis. (a) Unsubtracted DBT shows little reduction in low frequency anatomical noise with dose, but diminished quantum noise. (b) TS substantially reduces anatomical noise, and improvement is seen with increased dose.
Shown in Fig. 9 are NPS curves of (a) DM and (b) DBT dual energy acquisitions at 1.5 mGy (LE exposure = 0.8 mGy, HE exposure = 0.7 mGy) using W/Cu. Curves are shown for w bracketing the optimal weight. The variation in area under the curve indicates the importance of optimizing the weighing factor of the low energy image prior to subtraction. Even though the best weight results in slightly greater levels of high frequency noise, they effectively minimize the low frequency, anatomical components. Because the task consists of mainly low frequencies, suppression of noise around those frequencies will better improve the detectability index.
Figure 9.
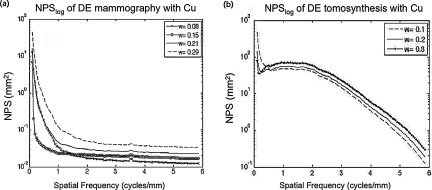
Noise power spectra of DE images. The plots illustrate the effect of weight on total noise reduction in (a) mammography and (b) tomosynthesis. Note that at optimal weight, 0.15 in (a) and 0.30 in (b), there is excellent suppression of anatomical noise at low frequencies but slightly increased quantum noise at higher frequencies.
The signal difference was found to increase monotonically with iodine concentration for unsubtracted and TS modes. For the dual energy imaging, the absolute SD decreased as a function of weight until a point where the signal was completely cancelled out. After this weight, the polarity changed as the signal difference increased again with weight.
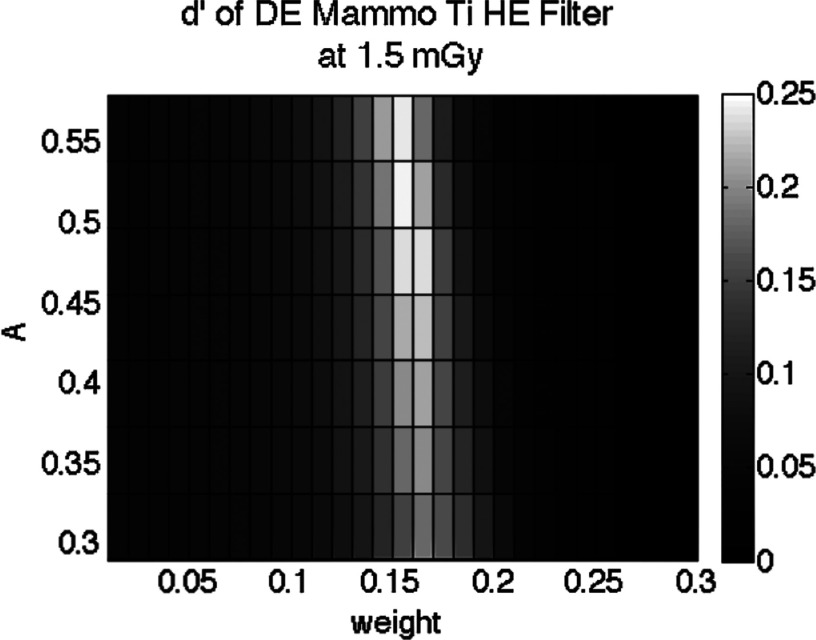
For DE subtraction, it was illustrated in Fig. 4 that detectability indices were optimized for both dose allocation (A) and weighting factor (w). The data show a moderate change with A, but a strong dependence on w. An example of this relationship is given for mammography with W/Ti in Fig. 10. The lowest dose allocation was set by the minimum flux our tube could deliver under the experimental settings, while the highest allocation was limited by the maximum detector exposure achievable without oversaturation. A sharp band is observed about the ideal weighting value, with a rapid drop off of d′ at either side. For both DM and DBT, the optimal value of A was generally found to be between 0.3 and 0.5. The optimal weight was w = 0.15 for both W/Cu and W/Ti.
Figure 10.
Relative d′ of DE-DBT across weight and dose allocation. Here, DE-DM was computed at 1.5 mGy as weighting and dose allocation are varied. d′ peaks at w = 0.15.
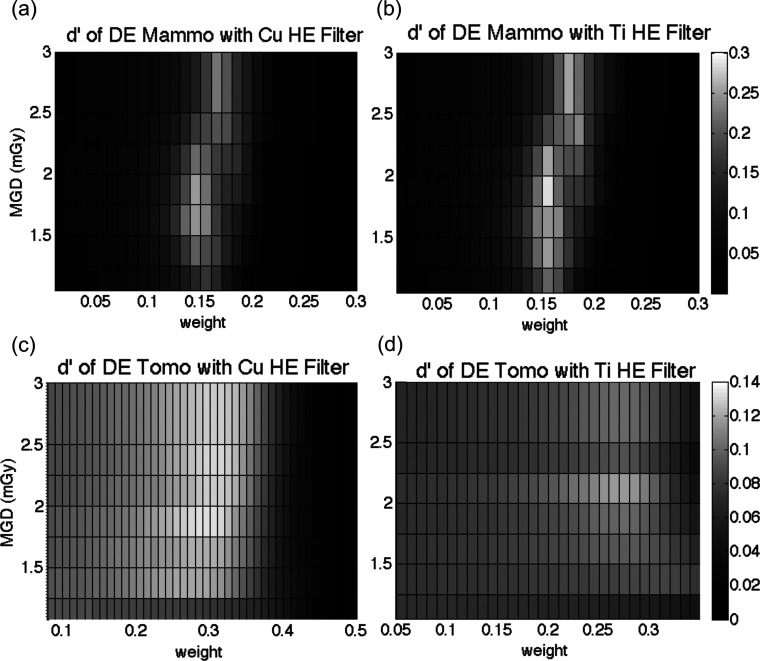
The array in Fig. 10 represents the optimization at a single dose, in this case 1.5 mGy. To visualize the performance for different doses, we collapsed this array vertically into a 1D vector comprising the maximum d′ for each weight column. In this manner, each dose results in a different 1D vector. The combination of those 1D vectors allows d′ to be visualized across different doses and weighting factors, provided in Fig. 11. The results of mammography for both HE filters are provided in Fig. 11. The optimal d′ for a given dose is thus found at the peak, which depends on the total MGD. The optimal weighting factor varied with mean glandular dose, since total dose is in part affected by dose allocation. The side-by-side comparison illustrates the efficiency of the different filters in producing a higher detectability for the same dose and image weight. These figures portray the magnitude of the suboptimal tradeoffs that may result if one were to devise simplified clinical techniques that fix one or more of the parameters of dose allocation, weight, and/or MGD.
Figure 11.
Relative d′ values with respect to total MGD and weight, obtained using different high kVp filters: (a) and (c) copper and (b) and (d) titanium. For mammography, the titanium filter yielded greater d′, while copper produced better results in tomosynthesis.
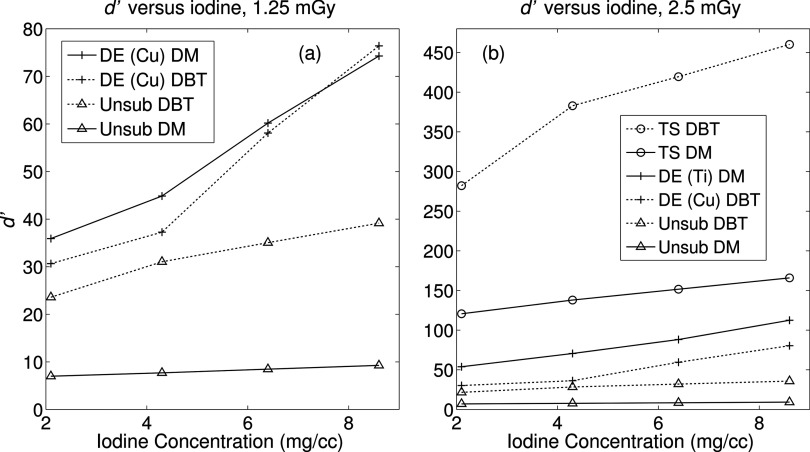
Lesion detectability was also measured as a function of iodine concentration. In Fig. 12, d′ is plotted against iodine and for select doses, providing a snapshot of how the metric varies with these two clinically relevant parameters. Figure 12a highlights the modes with the lowest detectability indices. Note that unsubtracted DBT (dotted “x”) outperforms unsubtracted DM (solid “x”), while the reverse is mostly the case for the dual energy schemes. It is only at the highest iodine concentration that d′ of dual energy DBT is greater than that of DM, but this difference is minor. At a greater dose in Fig. 12b, all the curves are shifted upward as one would expect. The temporal subtractions yielded the highest d′ values, and the largest difference is observed between TS DBT and all other modes. The temporal subtracted images still produce the highest detectability indices, followed again by dual energy subtraction and lastly the unsubtracted images. There is no crossover amongst other curves, suggesting that each method has its own distinct advantage. From all panels it appears that the use of DBT generally results in greater detectability, with the exception of dual energy subtracted images. A possible cause for this is explained in Sec. 4.
Figure 12.
Absolute d′ as a function of iodine concentration. (a) at 1.25 mGy, DE-DM yields higher detectability than other modes, with a slight crossover above 6.4 mg/cc. TS schemes are absent as the combined dose exceeded 1.25 mGy. (b) As expected, TS offers the highest d′, followed by DE and unsubtracted imaging. There is no crossover between DE-DM and DE-DBT at this dose.
The optimized d′ values were computed for all modalities at various doses and normalized to the value of TS DBT at 1.25 mGy with contrast at 2.1 mg/cc concentration. Parts (a)–(c) of Fig. 13 show normalized results under clinical conditions while part (d) shows performance at 3 mGy. d′ values from mammographic TS suffered some reduction relative to its DBT counterpart at each dose. Despite this minor difference, the study found that the trends of the other schemes over increasing dose did not change substantially. Unsubtracted imaging provides the lowest detectability index, and dual energy mammography offers higher signal detectability compared to dual energy tomosynthesis. Both TS and DE subtraction under mammography appear to be most sensitive to changes in dose, while tomosynthesis imaging provides a more robust and consistent outcome.
Figure 13.
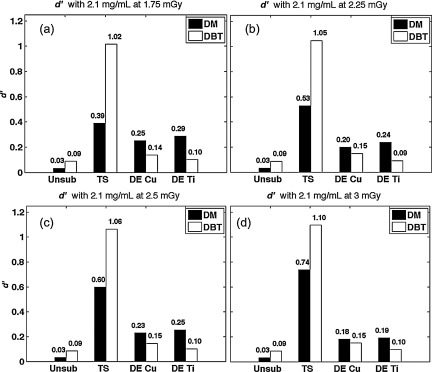
(a)–(d) Relative d′ for each mode, after normalization to TS DBT at 1.25 mGy. d′ was calculated over a range of doses from 1.75 to 3 mGy. Overall, subtraction techniques substantially improved lesion detectability.
DISCUSSION
In order to objectively compare mammography and tomosynthesis, it is crucial to acquire and analyze the data in a consistent manner. In this study, the six iodine enhanced imaging modes were assessed simultaneously on their ability to produce the highest detectability for several tasks as a function of equal MGD. In this study, since TTF of DBT and DM and the shape of the task remained fixed, the largest contributing factors to d′ are (1) the total dose, and (2) in dual energy imaging, the dose allocation and weighting factors in imaging.
While imaging at higher doses reduced the influence of quantum noise, in general the final value of d′ was most determined by the extent to which anatomical noise was reduced, indicated by the shape of the NPS at low frequencies. This explains the poor correlation of detectability to MGD in unsubtracted DBT and mammography. Because the slowly varying structure remained more or less equally visible regardless of increase in dose, the detectability index maintained a level value. Furthermore, because the low frequency content of the NPS was often orders of magnitude larger than the high frequency data, these values will dominate in the calculation of d′, leaving little difference to be seen even when high frequency noise is reduced. Finally, the size of the task is much larger than the pixel-by-pixel variations that occur at low doses, so there will be little impact on lesion detectability when such fine, grainy noise texture is reduced at high doses.
Dose allocation in the DE images may indicate how much quantum noise remains in the subtracted image. For example, values of A close to 0.5 signify that the high energy and low energy spectra equally contribute to total patient dose; however the dose to the detector will be different. If the dose to the detector is different, then noise levels in the resultant two images will be unequal. Thus, the noise due to one of the acquisitions will dominate the final subtracted image. For this reason, d′ will have greatest value when the dose allocation is such that the acquisition with the least quantum noise contributes most to the final image. It is important to note that in this experiment tube voltages were fixed, and dose was varied as mAs was increased. Furthermore, HE acquisitions bracketed a different range of doses compared to the LE exposures. Due to this experimental design, at higher doses such as 3 mGy, most of the dose will be assigned to the low energy image, resulting in excessive noise in the high energy image and thus the subtracted result. This explains the decrease in d′ for the DE mammography techniques indicated by Fig. 13.
The weighting factor also plays an important role in proper comparison of d′ values. Without optimizing this value, comparisons of improperly subtracted dual energy images to unsubtracted imaging can lead to erroneous conclusions. It is possible that the weighting values that minimize the area under the NPS function may be different from those that produce greatest signal difference between the lesion and background. For this reason, one must observe the effect of a weight value on the detectability index as a whole, instead of its constituents. In DBT, d′ peaked when weighting was set to vary between 0.21 and 0.27, agreeing with results from Carton et al.23 and Lewin et al.,20 while d′ of DM peaked when w was between 0.14 and 0.16. Similarly, DE imaging can only be properly assessed under the optimal high vs low energy dose allocation. Our study found that d′ was maximized when the high energy image contained between 30% and 60% of the total dose to the patient, which agrees with findings from other groups.30, 49, 50
Our results showed that DE-DM outperformed DE-DBT at all doses. This may be explained a few ways. Unsubtracted DBT has little tissue overlap, but also less subject contrast. In addition, FBP tomosynthesis is inherently less contrast sensitive than DM. Thus, detectability in DBT would not improve much with additional DE subtraction. Although the background is eliminated, signal difference between the lesion and background is also diminished. In unsubtracted DM, the lesion has greater signal but the tissue overlap dominates the image. Accordingly, mammography has more to gain from DE subtraction since the noise is reduced by at least 1 order of magnitude.
The results of this extensive analysis may be analyzed in terms of three aspects of image information. The first is the effect of dimensionality on improved lesion detection. That is, to what extent does the quasithree dimensionality of tomosynthesis improve detectability compared to mammography? This study suggests that the inclusion of depth information in unsubtracted imaging alone increases detectability by more than 50%. The next aspect is energy, where we compare conventional or LE imaging versus DE imaging. On average, DE imaging improved detectability by approximately 11%–55% in tomosynthesis and almost an order of magnitude in mammography. DE mammography yielded higher lesion detectability than DE tomosynthesis, and this is most likely due to the measurement of iodine signal difference. DE subtraction already suffers from diminished signal difference, and acquisition with tomosynthesis will only further reduce subject contrast. Finally, we assess the temporal aspect by comparing precontrast d′ with postcontrast TS d′. In both tomosynthesis and mammography, the temporal aspect improves d′ by more than an order of magnitude, compared to no subtraction. This can be attributed to the fact that tomosynthesis already eliminates tissue overlap to an extent, while mammography has no way of doing this. In addition, TS in tomosynthesis dominates TS in mammography at lower doses.51
While this study contains a robust scope, it is limited in some of its considerations. The filters used in the backprojection of DBT were not specifically optimized for dual energy imaging. A possible improvement of the study may be using simple backprojection if DE projections are used instead. Another limitation is that our physical phantom represents only one instance of breast thickness, density, and anatomical noise pattern. Even though the tissue pattern in the phantom is very heterogeneous and mathematically similar to that of clinical mammograms, the phantom itself is not anthropomorphic. In addition, our TS and DE imaging involved stationary phantoms, so we did not consider patient motion or registration of a nonrigid body; however, other groups have modeled and explored aggressive registration techniques in breast imaging.52, 53 Because patient motion can become a problem for long imaging studies even when compression is applied, this may account for the general preference for DE over TS imaging, since the time between high and low energy shots is shorter and limited only by the speed of the acquisition system.20, 22, 23, 24 While beyond the scope of this study, other studies have looked at patient motion with cascaded systems analysis.54, 55
The model observer in this study assessed 2D slices of 3D visualizations for DBT. To date there is no scientific consensus as to how the data should be combined. Some studies have implemented integrating the data in the depth direction, such as those of Richard11 and Gang;16 however, there as also been work33, 56 which focuses on emphasizes the differences between inplane visibility of DBT and DM. This paper seeks to further discussion on the latter comparing single slice images.
While it is possible to obtain images at the lowest possible doses using simple iodine enhanced mammography, its deleterious effect on lesion detectability due to quantum noise does not make it a viable option. Tomosynthesis methods proved to provide the best image quality at the lowest doses overall. This is the first research study to objectively and quantitatively assess the imaging capabilities of contrast enhanced mammography and tomosynthesis. This analysis not only establishes a basis for comparing current breast imaging techniques, it also provides a metric that may be used for other quantitative imaging tasks.
CONCLUSION
It is often important to minimize mean glandular dose when imaging a patient; however, this reduction in dose should not come at the expense of image quality and lesion detectability. Results of this analysis indicate that at any dose and concentrations of a contrast agent, temporal subtraction tomosynthesis yields the highest nodule detectability, followed by temporal subtraction and dual energy subtraction mammography. Dual energy subtraction is beneficial compared to unsubtracted imaging, but in the absence of motion, dual energy is quantitatively inferior to temporal subtraction.
ACKNOWLEDGMENTS
The authors would like to acknowledge Baiyu Chen, Yuan Lin, Brian Harrawood, Olav Christianson, and Xiang Li for their assistance in many aspects of the study. This work was supported in part by NIH Training Grant No. T32EB007185 and a research grant from Siemens Medical Solutions.
References
- Niklason L. T., Christian B. T., Niklason L. E., Kopans D. B., and Reinhold R. F., “Digital tomosynthesis in breast imaging,” Radiology 205, 399–406 (1997). 10.1148/radiology.205.2.9356620 [DOI] [PubMed] [Google Scholar]
- Dromain C., Thibault F.,Muller S., Rimareix F., Delaloge S., Tardivon A., and Balleyguier C., “Dual-energy contrast-enhanced digital mammography: Initial clinical results,” Eur. Radiol. 21, 565–574 (2011). 10.1007/s00330-010-1944-y [DOI] [PubMed] [Google Scholar]
- Baker J. A. and Lo J. Y., “Breast tomosynthesis: State-of-the-art and review of the literature,” Acad. Radiol. 18, 1298–1310 (2011). 10.1016/j.acra.2011.06.011 [DOI] [PubMed] [Google Scholar]
- Poplack S. P., Tosteson T. D., Kogel C. A., and Nagy H. M., “Digital breast tomosynthesis: Initial experience in 98 women with abnormal digital screening mammography,” AJR 189, 616–623 (2007). 10.2214/AJR.07.2231 [DOI] [PubMed] [Google Scholar]
- Teertstra H. J., Loo C. E., van den Bosch M. A., van Tinteren H., Rutgers E. J., Muller S. H., and Gilhuijs K. G., “Breast tomosynthesis in clinical practice: Initial results,” Eur. Radiol. 20, 16–24 (2010). 10.1007/s00330-009-1523-2 [DOI] [PubMed] [Google Scholar]
- Michell M. J., Iqbal A., Wasan R. K., Evans D. R., Peacock C., Lawinski C. P., Douiri A., Wilson R., and Whelehan P., “A comparison of the accuracy of film-screen mammography, full-field digital mammography, and digital breast tomosynthesis,” Clin. Radiol. 67, 976–981 (2012). 10.1016/j.crad.2012.03.009 [DOI] [PubMed] [Google Scholar]
- Sechopoulos I., “A review of breast tomosynthesis. Part I. The image acquisition process,” Med. Phys. 40, 014301 (12pp.) (2013). 10.1118/1.4770279 [DOI] [PMC free article] [PubMed] [Google Scholar]
- Gur D., Abrams G. S., Chough D. M., Ganott M. A., Hakim C. M., Perrin R. L., Rathfon G. Y., Sumkin J. H., Zuley M. L., and Bandos A. I., “Digital breast tomosynthesis: Observer performance study,” AJR 193, 586–591 (2009). 10.2214/AJR.08.2031 [DOI] [PubMed] [Google Scholar]
- Chen S. C., Carton A. K., Albert M., Conant E. F., Schnall M. D., and Maidment A. D., “Initial clinical experience with contrast-enhanced digital breast tomosynthesis,” Acad. Radiol. 14, 229–238 (2007). 10.1016/j.acra.2006.10.022 [DOI] [PMC free article] [PubMed] [Google Scholar]
- Kuhl C. K., Mielcareck P., Klaschik S., Leutner C., Wardelmann E., Gieseke J., and Schild H. H., “Dynamic breast MR imaging: Are signal intensity time course data useful for differential diagnosis of enhancing lesions?,” Radiology 211, 101–110 (1999). 10.1148/radiology.211.1.r99ap38101 [DOI] [PubMed] [Google Scholar]
- Richard S. and Samei E., “Quantitative breast tomosynthesis: From detectability to estimability,” Med. Phys. 37, 6157–6165 (2010). 10.1118/1.3501883 [DOI] [PubMed] [Google Scholar]
- Zhao B. and Zhao W., “Three-dimensional linear system analysis for breast tomosynthesis,” Med. Phys. 35, 5219–5232 (2008). 10.1118/1.2996014 [DOI] [PMC free article] [PubMed] [Google Scholar]
- Zhao B., Zhou J., Hu Y.-H., Mertelmeier T., Ludwig J., and Zhao W., “Experimental validation of a three-dimensional linear system model for breast tomosynthesis,” Med. Phys. 36, 240–251 (2009). 10.1118/1.3040178 [DOI] [PMC free article] [PubMed] [Google Scholar]
- Hill J. G. M. M. L., Puong S., Carton A. K., Iordache R., Muller S., and Yaffe M. J., “Impact of image acquisition timing on image quality for dual-energy contrast-enhanced breast tomosynthesis,” Proc. SPIE 8313, 831308 (2012). 10.1117/12.911627 [DOI] [Google Scholar]
- Chen L., Abbey C. K., Nosratieh A., Lindfors K. K., and Boone J. M., “Anatomical complexity in breast parenchyma and its implications for optimal breast imaging strategies,” Med. Phys. 39, 1435–1441 (2012). 10.1118/1.3685462 [DOI] [PMC free article] [PubMed] [Google Scholar]
- Gang G., Lee J., Stayman J. W., Tward D. J., Zbijewski W., Prince J. L., and Siewerdsen J. H., “Analysis of Fourier-domain task-based detectability index in tomosynthesis and cone-beam CT in relation to human observer performance,” Med. Phys. 38, 1754–1768 (2011). 10.1118/1.3560428 [DOI] [PMC free article] [PubMed] [Google Scholar]
- Hu Y.-H. and Zhao W., “The effect of angular dose distribution on the detection of microcalcifications in digital breast tomosynthesis,” Med. Phys. 38, 2455–2466 (2011). 10.1118/1.3570580 [DOI] [PMC free article] [PubMed] [Google Scholar]
- Reiser I. and Nishikawa R. M., “Task-based assessment of breast tomosynthesis: Effect of acquisition parameters and quantum noise,” Med. Phys. 37, 1591–1600 (2010). 10.1118/1.3357288 [DOI] [PMC free article] [PubMed] [Google Scholar]
- Richard S. and Ehsan S., “Quantitative imaging in breast tomosynthesis and CT: Comparison of detection and estimation task performance,” Med. Phys. 37, 2627–2637 (2010). 10.1118/1.3429025 [DOI] [PubMed] [Google Scholar]
- Lewin J. M., Isaacs P. K., Vance V., and Larke F. J., “Dual-energy contrast-enhanced digital subtraction mammography: Feasibility,” Radiology 229, 261–268 (2003). 10.1148/radiol.2291021276 [DOI] [PubMed] [Google Scholar]
- Diekmann F., Freyer M., Diekmann S., Fallenberg E. M., Fischer T., Bick U., and Pollinger A., “Evaluation of contrast-enhanced digital mammography,” Eur. J. Radiol. 78, 112–121 (2011). 10.1016/j.ejrad.2009.10.002 [DOI] [PubMed] [Google Scholar]
- Diekmann F. and Bick U., “Tomosynthesis and contrast-enhanced digital mammography: Recent advances in digital mammography,” Eur. Radiol. 17, 3086–3092 (2007). 10.1007/s00330-007-0715-x [DOI] [PubMed] [Google Scholar]
- Carton A. K., Gavenonis S. C., Currivan J. A., Conant E. F., Schnall M. D., and Maidment A. D., “Dual-energy contrast-enhanced digital breast tomosynthesis–A feasibility study,” Br. J. Radiol. 83, 344–350 (2010). 10.1259/bjr/80279516 [DOI] [PMC free article] [PubMed] [Google Scholar]
- Dromain C., Balleyguier C., Adler G., Garbay J. R., and Delaloge S., “Contrast-enhanced digital mammography,” Eur. J. Radiol. 69, 34–42 (2009). 10.1016/j.ejrad.2008.07.035 [DOI] [PubMed] [Google Scholar]
- Sara Gavenonis K. L., Karunamuni R., Zhang Y., Ren B., Ruth C., and Maidment A. D. A., “Initial experience with dual-energy contrast-enhanced digital breast tomosynthesis in the characterization of breast cancer,” Breast Imaging 7361, 32–39 (2012). 10.1007/978-3-642-31271-7_5 [DOI] [Google Scholar]
- I. C.o.R.U.a.M. (ICRU), Medical Imaging – The Assessment of Image Quality, ICRU Report No. 54 (ICRU, Bethesda, MD, 1996).
- Richard S. and Siewerdsen J. H., “Comparison of model and human observer performance for detection and discrimination tasks using dual-energy x-ray images,” Med. Phys. 35, 5043–5053 (2008). 10.1118/1.2988161 [DOI] [PMC free article] [PubMed] [Google Scholar]
- Gang G. J., Lee J., Stayman J. W., Tward D. J., Zbijewski W., Prince J. L., and Siewerdsen J. H., “The generalized NEQ and detectability index for tomosynthesis and cone-beam CT: From cascaded systems analysis to human observers,” Proc. SPIE 7622, 76220Y–76211Y (2010). 10.1117/12.845462 [DOI] [PMC free article] [PubMed] [Google Scholar]
- Gang G. J., Tward D. J., Lee J., and Siewerdsen J. H., “Anatomical background and generalized detectability in tomosynthesis and cone-beam CT,” Med. Phys. 37, 1948–1965 (2010). 10.1118/1.3352586 [DOI] [PMC free article] [PubMed] [Google Scholar]
- Gang G. J., Zbijewski W., Webster Stayman J., and Siewerdsen J. H., “Cascaded systems analysis of noise and detectability in dual-energy cone-beam CT,” Med. Phys. 39, 5145–5156 (2012). 10.1118/1.4736420 [DOI] [PMC free article] [PubMed] [Google Scholar]
- Richard S., Siewerdsen J. H., Jaffray D. A., Moseley D. J., and Bakhtiar B., “Generalized DQE analysis of radiographic and dual-energy imaging using flat-panel detectors,” Med. Phys. 32, 1397–1413 (2005). 10.1118/1.1901203 [DOI] [PubMed] [Google Scholar]
- Burgess A. E., Jacobson F. L., and Judy P. F., “Human observer detection experiments with mammograms and power-law noise,” Med. Phys. 28, 419–437 (2001). 10.1118/1.1355308 [DOI] [PubMed] [Google Scholar]
- Wang X., Mainprize J. G., Wu G., and Yaffe M. J., “Task-based evaluation of image quality of filtered back projection for breast tomosynthesis,” Digital Mammography (Springer, Berlin Heidelberg, 2010), pp. 106–113. [Google Scholar]
- Hornig M. D., Batz L., and Mertelmeier T., “Design of a contrast-enhanced dual-energy tomosynthesis system for breast cancer imaging,” Proc. SPIE 8313, 83134O (2012). 10.1117/12.911377 [DOI] [Google Scholar]
- Jerebko A. K., and Mertelmeier T., “Evaluation and optimization of the maximum-likelihood approach for image reconstruction in digital breast tomosynthesis,” Proc. SPIE 7622, 76220E (2010). 10.1117/12.844177 [DOI] [Google Scholar]
- Mertelmeier T., Orman J., Haerer W., and Dudam M. K., “Optimizing filtered backprojection reconstruction for a breast tomosynthesis prototype device,” Proc. SPIE 6142, 131–142 (2006). 10.1117/12.651380 [DOI] [Google Scholar]
- Samei E., “Image quality in two phosphor-based flat panel digital radiographic detectors,” Med. Phys. 30, 1747–1757 (2003). 10.1118/1.1578772 [DOI] [PubMed] [Google Scholar]
- Samei E., Flynn M. J., and Reimann D. A., “A method for measuring the presampled MTF of digital radiographic systems using an edge test device,” Med. Phys. 25, 102–113 (1998). 10.1118/1.598165 [DOI] [PubMed] [Google Scholar]
- Samei E. and Flynn M. J., “An experimental comparison of detector performance for direct and indirect digital radiography systems,” Med. Phys. 30, 608–622 (2003). 10.1118/1.1561285 [DOI] [PubMed] [Google Scholar]
- Samei E., Ranger N. T., Dobbins J. T., and Chen Y., “Intercomparison of methods for image quality characterization. I. Modulation transfer function,” Med. Phys. 33, 1454–1465 (2006). 10.1118/1.2188816 [DOI] [PubMed] [Google Scholar]
- Saunders R. S., Samei E., Jesneck J. L., and Lo J. Y., “Physical characterization of a prototype selenium-based full field digital mammography detector,” Med. Phys. 32, 588–599 (2005). 10.1118/1.1855033 [DOI] [PubMed] [Google Scholar]
- Marshall N. and Bosmans H., “Measurements of system sharpness for two digital breast tomosynthesis systems,” Phys. Med. Biol. 57, 7629–7650 (2012). 10.1088/0031-9155/57/22/7629 [DOI] [PubMed] [Google Scholar]
- Samei E., Murphy S., and Richard S., “Assessment of multi-directional MTF for breast tomosynthesis,” Phys. Med. Biol. 58, 1649–1661 (2013). 10.1088/0031-9155/58/5/1649 [DOI] [PubMed] [Google Scholar]
- Boone J. M., “Normalized glandular dose (DgN) coefficients for arbitrary x-ray spectra in mammography: Computer-fit values of Monte Carlo derived data,” Med. Phys. 29, 869–875 (2002). 10.1118/1.1472499 [DOI] [PubMed] [Google Scholar]
- I. E. C. 62220-1-2, 2005.
- Dobbins J. T., Samei E., Ranger N. T., and Chen Y., “Intercomparison of methods for image quality characterization. II. Noise power spectrum,” Med. Phys. 33, 1466–1475 (2006). 10.1118/1.2188819 [DOI] [PubMed] [Google Scholar]
- Klein S., Staring M., Murphy K., Viergever M. A., and Pluim J. P. W., “Elastix: A toolbox for intensity based medical image registration,” IEEE Trans. Med. Imaging 29, 196–205 (2010). 10.1109/TMI.2009.2035616 [DOI] [PubMed] [Google Scholar]
- Li X., Samei E., Delong D. M., Jones R. P., Gaca A. M., Hollingsworth C. L., Maxfield C. M., Carrico C. W., and Frush D. P., “Three-dimensional simulation of lung nodules for paediatric multidetector array CT,” Br. J. Radiol. 82, 401–411 (2009). 10.1259/bjr/51749983 [DOI] [PubMed] [Google Scholar]
- Puong S., Bouchevreau X., Duchateau N., Iordache R., and Muller S., “Optimization of beam parameters and iodine quantification in dual-energy contrast enhanced digital breast tomosynthesis,” Proc. SPIE 6913, 69130Z (2008). 10.1117/12.770148 [DOI] [Google Scholar]
- Richard S. and Siewerdsen J. H., “Optimization of dual-energy imaging systems using generalized neq and imaging task,” Med. Phys. 34, 127–139 (2007). 10.1118/1.2400620 [DOI] [PubMed] [Google Scholar]
- Kiarashi N., Lo J. Y., Lin Y., Ikejimba L. C., Ghate S. V., Nolte L. W., J. T.DobbinsIII, Segars W. P., and Samei E., “Development and Application of a Suite of 4D Virtual Breast Phantoms for Optimization and Evaluation of Breast Imaging Systems,” Medical Imaging, IEEE Transactions on (accepted). 10.1109/TMI.2014.2312733 [DOI] [PMC free article] [PubMed] [Google Scholar]
- Guo Y., Sivaramakrishna R., Lu C. C., Suri J. S., and Laxminarayan S., “Breast image registration techniques: A survey,” Med. Biol. Eng. Comput. 44, 15–26 (2006). 10.1007/s11517-005-0016-y [DOI] [PubMed] [Google Scholar]
- Sinha S. P., Narayanan R., Ma B., Roubidoux M. A., Liu H., and Carson P. L., “Image registration for detection and quantification of change on digital tomosynthesis mammographic volumes,” AJR 192, 384–387 (2009). 10.2214/AJR.08.1388 [DOI] [PMC free article] [PubMed] [Google Scholar]
- Allec S. A. N., Scott C. C., Lewin J. M., and Karim K. S., “Including the effect of motion artifacts in noise and performance analysis of dual-energy contrast-enhanced mammography,” Phys. Med. Biol. 57, 8405–8425 (2012). 10.1088/0031-9155/57/24/8405 [DOI] [PubMed] [Google Scholar]
- Acciavatti A. M. Raymond, “Optimization of continuous tube motion and step-and-shoot motion in digital breast tomosynthesis systems with patient motion,” Proc. SPIE 8318, 831306 (2012). 10.1117/12.911016 [DOI] [Google Scholar]
- Timberg P., Båth M., Andersson I., Mattsson S., Tingberg A., and Ruschin M., “In-plane visibility of lesions using breast tomosynthesis and digital mammography,” Med. Phys. 37, 5618–5626 (2010). 10.1118/1.3488899 [DOI] [PubMed] [Google Scholar]


