Abstract
Purpose: A study was designed to investigate the impact of time-of-flight (TOF) and point spread function (PSF) modeling on the detectability of myocardial defects.
Methods: Clinical FDG-PET data were used to generate populations of defect-present and defect-absent images. Defects were incorporated at three contrast levels, and images were reconstructed by ordered subset expectation maximization (OSEM) iterative methods including ordinary Poisson, alone and with PSF, TOF, and PSF+TOF. Channelized Hotelling observer signal-to-noise ratio (SNR) was the surrogate for human observer performance.
Results: For three iterations, 12 subsets, and no postreconstruction smoothing, TOF improved overall defect detection SNR by 8.6% as compared to its non-TOF counterpart for all the defect contrasts. Due to the slow convergence of PSF reconstruction, PSF yielded 4.4% less SNR than non-PSF. For reconstruction parameters (iteration number and postreconstruction smoothing kernel size) optimizing observer SNR, PSF showed larger improvement for faint defects. The combination of TOF and PSF improved mean detection SNR as compared to non-TOF and non-PSF counterparts by 3.0% and 3.2%, respectively.
Conclusions: For typical reconstruction protocol used in clinical practice, i.e., less than five iterations, TOF improved defect detectability. In contrast, PSF generally yielded less detectability. For large number of iterations, TOF+PSF yields the best observer performance.
Keywords: time-of-flight, point spread function, myocardial defect, detectability, channelized Hotelling observer
INTRODUCTION
Time of flight in positron emission tomography (TOF-PET) uses the difference between the arrival times of coincident photons to estimate the location of positron annihilation. TOF-PET improves image quality compared to conventional PET, which does not identify the annihilation location on an event basis. This technique has been explored in the past,1, 2 but until recently,3 limitations of the scanner hardware obstructed its incorporation into commercial systems. For clinical applications, TOF results in lower statistical noise in the acquired data, effectively increasing the system sensitivity. Noise reduction from TOF leads to significant improvements to lesion detectability and, in most cases, to overall image quality.4, 5, 6
The ring geometry of current PET detector systems leads to inconsistencies in the imaging process. PET acquisition is affected by depth-of-interaction errors within the crystal elements, which cause event misregistration (parallax effect). PET spatial resolution is the source of quantitative partial volume errors for small structures, and the point spread response degrades this resolution in tomographic reconstruction. The phenomenon increases with spatial distance from the center of the field of view (FOV). Point spread function (PSF) modeling is an effective approach to minimize these degrading effects. The system PSF can be derived from simulation, analytical calculation, and point source measurements. The resulting PSF models can then be incorporated into the PET system matrix to be used in forward- and back-projection steps in the iterative algorithm.7, 8, 9, 10 Although most evaluations of PSF note improvements in image noise, spatial resolution, and contrast, recently it has been suggested that the noise propagation associated with resolution modeling is more complex than what these simplistic metrics are able to adequately characterize.11 Task-based evaluations, e.g., studies investigating detectability or localization performance, may provide a clearer picture of the impact of PSF.
Iterative reconstruction is the current standard for clinical PET, and the incorporation of TOF and PSF models in the reconstruction process has great potential to improve image quality.12, 13 TOF and PSF result in faster iterative convergence4, 5 and more uniform spatial resolution,8, 14 respectively. Several groups have also investigated the impact of these new reconstructions on lesion detectability;15, 16, 17, 18 the conclusions of these studies are generally aligned. PSF and, to a greater degree, TOF result in improved observer performance, especially in the detection of small and faint lesions, and the combination of both techniques performed better than either individually. One study reported improvements in detection performance of human observers of 7%, 19%, and 37%, respectively, for PSF, TOF, and TOF+PSF over the baseline reconstruction, which was ordinary Poisson (OP) 3D OSEM PET.19 While significant effort has been aimed at assessing the performance of TOF and PSF for improving detectability of “hot” lesions in whole-body (WB) PET, little work has been focused on evaluating the performance in “cold” defects.
According to the Society of Nuclear Medicine (SNM) PET/CT Utilization Task Force (UTF) Cardiac PET and PET/CT Imaging Practice Guidelines, cardiac viability imaging with FDG-PET is recommended to identify patients with partial loss of heart muscle movement or hibernating myocardium and to distinguish between dysfunctional and viable scarred myocardial tissue.20 Management decisions in patients with cardiomyopathy and left ventricular dysfunction are based on the detection of defects in myocardial uptake. Previous work has investigated the impact on cardiac studies of PSF, reporting improvements in image contrast, defect definition, and contrast-to-noise ratio.21 The work presented here aims to investigate and quantify the reconstruction performance of TOF and PSF to enhance photopenic regions in the myocardial ring, in the context of observer detectability.
FDG studies were used in this work to simulate myocardial viability studies. However, the defect detection model is similar to that for other cardiac studies, e.g., where decreased tracer uptake may indicate ischemic tissue. Thus, the findings presented here extend to perfusion studies as well, using PET tracers based on 82Rb, 13N-ammonia, 15O-water, or 18F-BMS-747158.22
MATERIALS AND METHODS
Past patient FDG-PET data were used to generate both defect-present and defect-absent images. Defects at three contrast levels were generated by removing activity from a spherical region of 1-cm diameter located in the myocardium. Images were reconstructed by iterative methods with ordinary Poisson ordered subset expectation maximization (OP-OSEM) (Ref. 23) alone and with PSF, TOF, and PSF+TOF. Mathematical observers were used to analyze the images and predict the performance of human observers.
PET scanning
Ninety-six oncology patients underwent routine clinical PET/CT scans at the University of Tennessee Medical Center after overnight fasting. All scans followed the administration of 370 MBq of 18F-FDG and a 90-min uptake period.4 Of these patients, 32 (82.16 ± 18.05 kg) with uniformly increased FDG uptake in the myocardium were selected for this study. Patients underwent a WB PET/CT consisting of four to seven bed positions. Patients were scanned for 2–4 min per bed according to the clinical protocol. The scan time was increased for larger subjects to compensate for higher attenuation and lower count statistics in the acquisition data; this was determined by patient weight. The data were acquired in 3D mode and saved in listmode format. The reconstructed images were reviewed and locations of possible myocardial defect sites were recorded. All scans were performed on a prototype TOF scanner based on the Biograph 6 TruePoint PET/CT (Siemens Healthcare, Molecular Imaging),6 with extended axial coverage (TrueV).
The PET system comprises four rings of 192 LSO detector blocks, and each block is a 13 × 13 grid of crystal elements (4 × 4 × 20 mm). The axial FOV is 21.8 cm with a 70-cm diameter patient port. The average spatial resolutions (FWHM) are 4.4 and 5.2 mm transaxially, and 4.4 and 5.8 mm axially, measured at 1 and 10 cm from the center of the transverse FOV, respectively. The coincidence electronics uses an acceptance window of 4.1 ns, with an energy window of 435–650 keV. The timing resolution is 550 ps (FWHM), and the acceptance window is divided into TOF bins of 312 ps.6
To model the activity to be removed from the patient scans to create the defects, we used the PET data acquired on a sphere phantom using the same scanner that was used for the patient studies.19 A 1-cm inner-diameter sphere was filled with approximately 200 kBq of 18F and separately scanned in air at 40 predetermined coordinates corresponding to various potential locations within a typical patient. This was accomplished by mounting the sphere to a 40 × 40 cm grid, with over 600 threaded holes. The 40 locations were scanned separately for 3 min each.
Myocardial defect generation
The artificial defects were simulated in the images according to a process similar to that used by other studies.15, 16, 24 Prior to reconstruction, counts were removed from the raw PET data corresponding to the location of the anterolateral wall of the left ventricle. This is a left circumflex coronary artery (LCX) territory. Among the three major coronary arteries, the LCX supplies almost 40% of the myocardium. Therefore, occlusion of the proximal LCX may cause a large area of myocardial infarction.25 The removed counts were those from the 1-cm sphere signal, attenuated by the patient CT map, and subtracted from the patient sinograms, following the procedure described hereafter. We first reconstructed the spheres and patients separately with the baseline reconstruction (OP-OSEM) so to find an appropriate scale factor based on the ratio of measured activities for each region of interest. The scale factors were then applied to the sphere data to obtain the predetermined defect to myocardium contrast, defined as
| (1) |
Three contrast levels were used: 0.29 ± 0.06, 0.44 ± 0.1, and 0.5 ± 0.12, as measured in the baseline reconstructed images.
Once the sphere projection data had been scaled appropriately, attenuation was simulated using the patient attenuation correction factor (ACF) map. The resulting sinogram was subtracted from that of the patient, and then the new data were reconstructed, producing a patient volume with a cold defect. This process is demonstrated in Fig. 1 in a uniform phantom.
Figure 1.
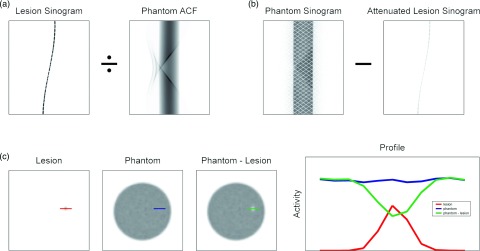
Generation of defect-present images, demonstrated in a phantom. (a) Projection data from a sphere were attenuated with the phantom attenuation map and then (b) subtracted from the original phantom projection sinogram. (c) Reconstructed volume slices showing the original sphere, original phantom, and the phantom missing the sphere counts, along with the respective profiles drawn over the target sites.
The sphere data were not acquired at locations corresponding to the unique myocardium of each patient. Instead, the transverse distance to the scanner center was calculated for every myocardial site. The sphere location that closest matched this radial length was selected. The corresponding sphere data were rotated transaxially, in 3D and TOF segments, and shifted axially to effectively “reposition” the sphere. The TOF change caused by the translation was applied accordingly. Once the sphere had been moved, the myocardial activity at the new site was used to scale the defect contrast, as defined in Eq. 1. Figure 2 shows transaxial slices containing the myocardial defect in volumes reconstructed with the four reconstructions, using three iterations, 12 subsets, and no postreconstruction smoothing.
Figure 2.
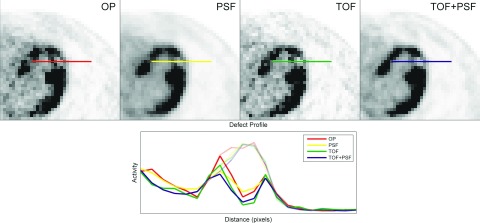
Transaxial slices containing a myocardial defect in the anterolateral wall of the left ventricle are shown for volumes generated from the four reconstruction methods under study. Solid lines represent defect profiles while faint lines show the respective myocardial backgrounds, before defect subtraction.
For each patient, defects were added to the myocardium at two different locations.
Reconstructions
Four reconstructions using Siemens e7 tools, were evaluated in this work: OP-OSEM alone and with PSF, TOF, and TOF+PSF. Initial investigations compared each algorithm at three iterations and 12 subsets, since these represent typical parameters for a clinical PET protocol. Each reconstruction was subsequently run to 20 iterations, with the intermediate iterations saved. All images were then smoothed with a Gaussian filter, ranging from 1 to 6 mm with a step of 1 mm. The final image matrix was 168 × 168 × 109; the transaxial pixel size was 4.073 mm, and the slice thickness was 2.027 mm.
A total of 129 360 images were used in the study [33 patients × four reconstructions × 20 iterations × seven smoothing kernels (0–6 mm) × seven defect conditions (two defect locations × three contrasts + one defect-absent)].
Mathematical observer models
The performance of the reconstructions was evaluated by mathematical observer models in a binary classification task with exactly known signal and background (SKE/BKE), i.e., determining the class from which each image arose, defect-present or defect-absent. Previous work has shown good agreement between human and channelized nonprewhitening (CNPW) observers,12, 26 but the handicapped channelized Hotelling (CH) models have shown stronger correlation with human observers in signal detection in random (anatomical) background tasks.27, 28, 29, 30
The numerical models described here used channelized difference-of-Gaussian (DOG) frequency filters. Each channel was defined by
| (2) |
where i is the channel number. The set of σi was defined according to
| (3) |
A sparse DOG (SDOG) configuration, with three channels, was defined using Q = 2, α = 2, and σ0 = 0.015.30
The channelized mathematical observer calculates a statistical point for each test image in a space defined by the frequency responses of its channels. It then histograms all image points along its discriminant function, also defined in channel-response space. Each of these histogrammed points is the observer test statistic of a sample image, and observer SNR is calculated using
| (4) |
where μ1 and μ1 are the observer test statistics belonging to the defect-present and defect-absent classes, respectively. The discriminant function of the Hotelling observer is linear.
The CH observer uses the mean class difference and second order measures of the discrete distributions to remove correlations within the data, similar to Fisher linear discriminant analysis (LDA). However unlike LDA, the true ensemble covariances are only approximated by the sample distributions.
For normal distributions, the CH observer is the ideal linear observer, using all available information about the underlying classes to construct the most accurate linear discriminant function. A human observer may not have this degree of knowledge and typically performs worse in classification tasks. This discrepancy is attributed to internal noise within the human observer and is presumed to be of the order of the variance within each frequency channel. It is accounted for in the CH observer by doubling the magnitudes of the diagonal elements of the whitening matrix.30, 31 The CH observer using this handicapped discriminant necessarily performs worse and has shown better agreement with human observers. It was therefore decided to implement the CH observer model with internal noise. An illustration of the observer models, using a three-channel filter, is given in Fig. 3. Here, the data are represented by 3D vectors comprising the channel responses.
Figure 3.
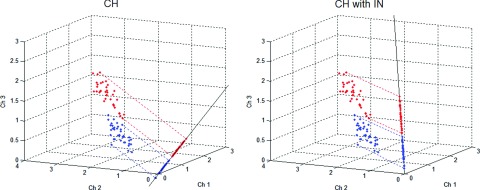
Scatter plot showing the difference between linear mathematical observers. Each point in the 3D scatter plot represents a sample image, reduced to a three-channel response vector, red points belong to the lesion-present class while blue points are from the lesion-absent class. In the plots, the lines serve as the observer discriminant functions, along which the sample data are histogrammed to calculate observer SNR. The channelized Hotelling observer incorporates the mean class difference and the class covariance matrices into the discriminant function. The addition of noise to the prewhitening matrix degrades observer performance and has shown better agreement with that of human observers.
RESULTS
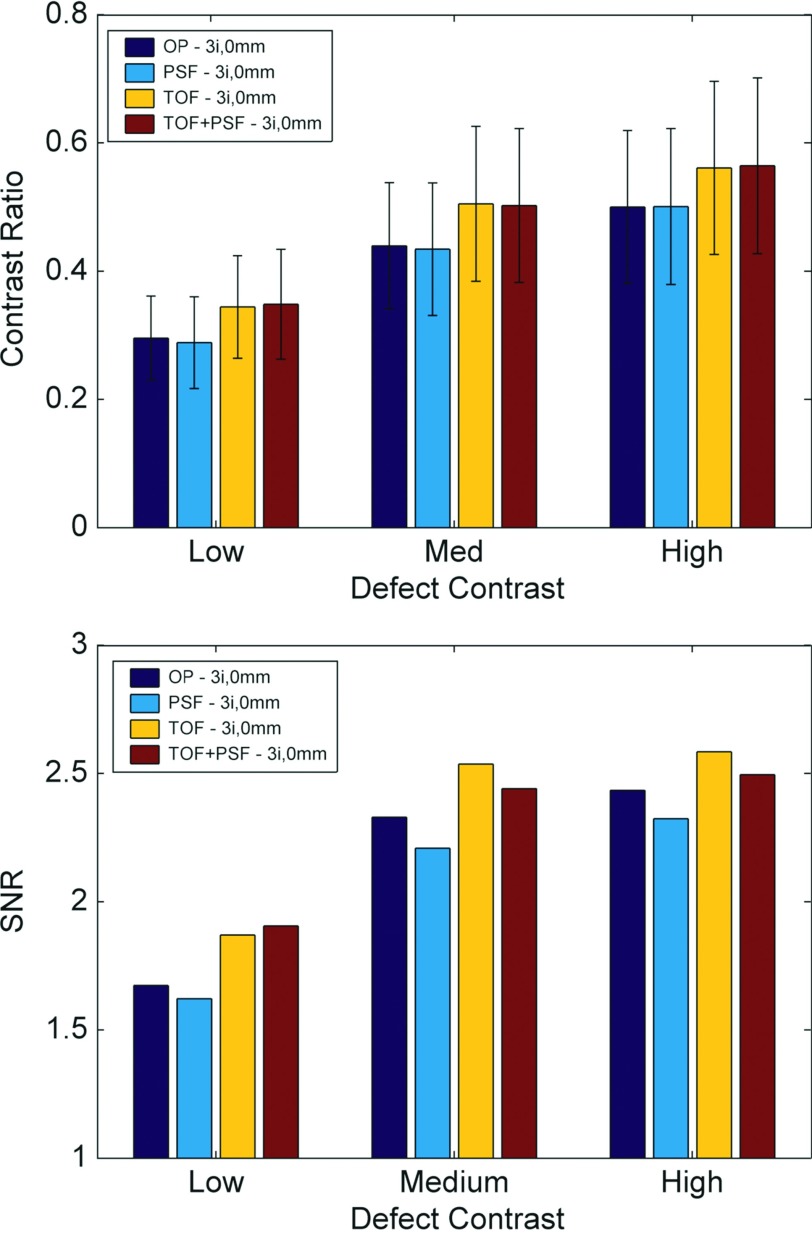
Analysis of observer performance for reconstructions using three iterations and 12 subsets, seen in Fig. 4, showed that TOF was superior to non-TOF and PSF-based reconstructions generally performed worse than non-PSF. This was expected since PSF delays convergence in iterative reconstruction, and at three iterations of 12 subsets, the image contrast has not yet converged. For these images (with no postreconstruction smoothing), the mean defect detection SNR was improved by TOF by ∼8.6% across all defect contrasts. Due to the slow convergence of PSF reconstruction, PSF yielded ∼4.4% less SNR than OP.
Figure 4.
Contrast ratio and observer SNR for different defect contrasts and reconstruction methods for images at three iterations and no smoothing. Standard deviation of the observer statistics was generally lower for images with TOF, and defect contrast had not converged for reconstructions with PSF. At this point, before sufficient reconstruction convergence, PSF performed poorly.
The analyses over all iterations showed that reconstructions incorporating PSF performed best with the maximum number of iterations and this was independent of defect contrast. The relative performances of reconstructions without PSF were affected by defect contrast; the larger contrast defects required more iterations to achieve peak observer performance. The TOF reconstruction required fewer iterations than non-TOF. Figure 5 shows observer performance evaluated over 20 iterations and seven postreconstruction smoothing settings.
Figure 5.
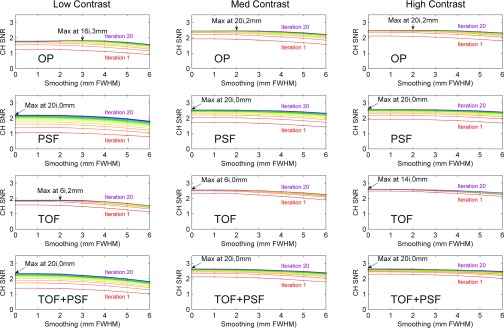
Observer SNR for images at various iteration number and postreconstruction smoothing. With the exception of TOF, SNR generally peaked at late iteration number, especially for the reconstructions incorporating PSF. Postreconstruction smoothing generally degraded observer performance, and so peak performance was seen in the images with little or no smoothing.
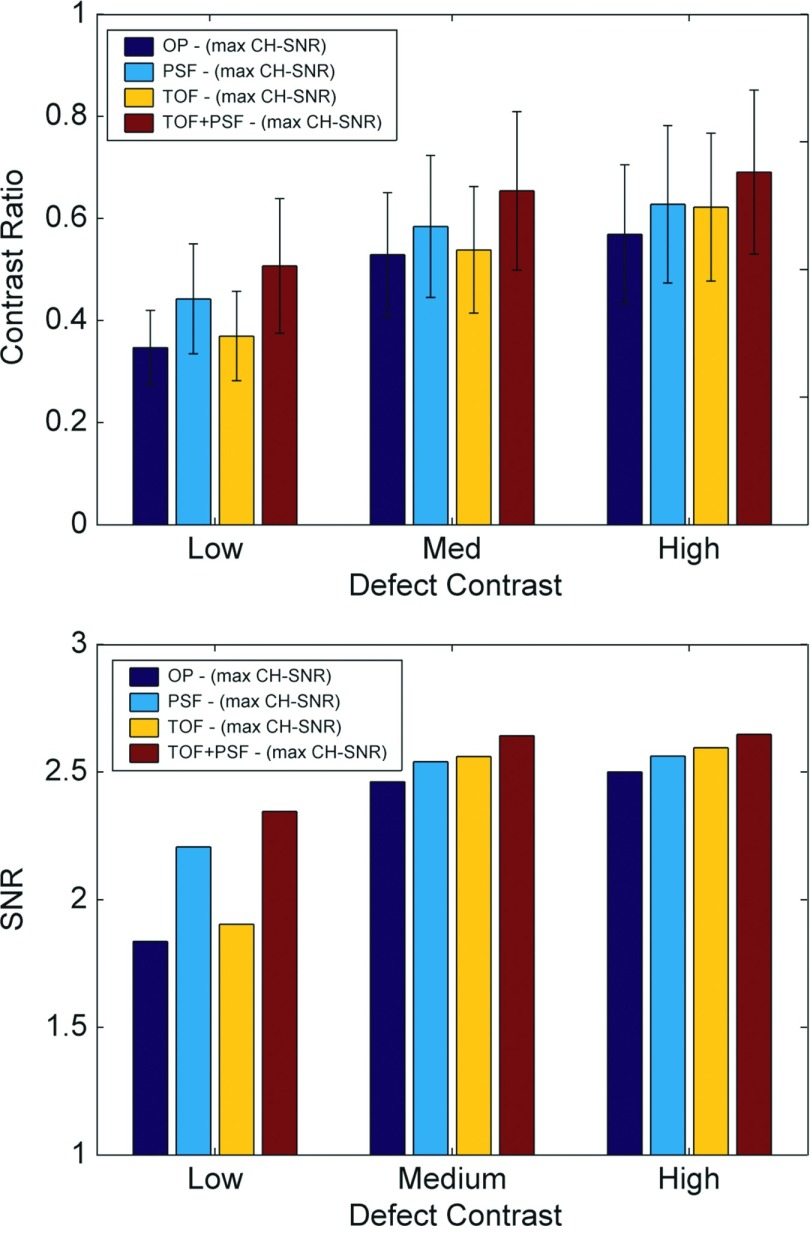
Defect contrast ratio and observer SNR are shown in Fig. 6 for images reconstructed with the optimal parameters (from Fig. 5).
Figure 6.
Defect contrast and CH observer SNR for images at iteration and smoothing parameter corresponding to maximum SNR from Fig. 5. Although, the standard deviation of the observer statistics was generally less with TOF, improvements in contrast recovery for PSF increased observer SNR. PSF performed better than TOF for the faint signals due to the enhanced defect contrast.
Here, OP always performed poorest and the combination of TOF and PSF performed best. For the faint defects, PSF performed better than TOF; otherwise, TOF was superior. The combination of TOF and PSF improved mean detection SNR as compared to non-TOF and non-PSF counterparts by 3.0% and 3.2%, respectively.
Figure 7 shows the dependence of SNR on the mean difference and standard deviation of the two classes of the channelized Hotelling observer test statistics, performed on images without smoothing. Observer SNR was largely dependent on the mean class separation of test statistics, which was accelerated by TOF and delayed by PSF. Dashed vertical lines mark the iteration corresponding to maximum SNR.
Figure 7.
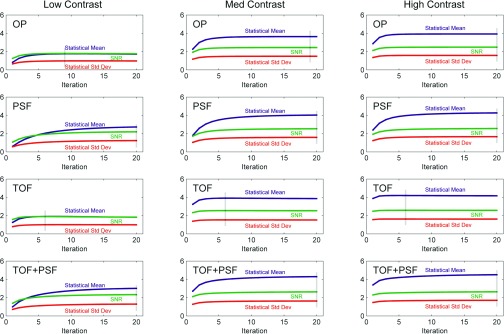
Plots showing relation between mean class difference and standard deviation of channelized Hotelling observer test statistics for all reconstructions (with no smoothing) and defect contrasts. Analogous to the images themselves, TOF accelerated convergence of the observer performance while PSF delayed it. Maximum SNR is marked by faint vertical lines.
DISCUSSION
Myocardial metabolism and perfusion studies account for a significant portion of clinical PET use, and coronary artery disease (CAD) continues to account for the majority of deaths in the United States and the Western world. Improvements in PET reconstruction models can provide clinicians more accurate information about stunned, hibernated, and viable myocardial regions, possibly leading to more appropriate treatment plans.
The effects of TOF and PSF on PET reconstruction have been well documented, especially in the context of oncology studies and detection performance for hot lesions.12, 15, 16, 19 However, little attention has been paid to the potential benefits for detection of cold defects, which may represent a different pathological indication, e.g., tissue ischemia. This is important to consider for iterative reconstruction since image convergence is a nonlinear process and behaves differently for regions of varying uptake within the PET FOV; areas of low activity converge slower than those of high activity. This study investigated the case of cold regions surrounded by very hot backgrounds, where many iterations were needed for defect convergence. Local image noise was not significantly increased at high iteration numbers since the hot myocardium was supported by high count statistics. Thus, observer SNR generally improved with high iteration number; this is in contrast to hot lesions in cool or warm background, which usually require a balance of contrast convergence and noise suppression.
The impact of TOF and PSF with patient movement was beyond the scope of this work since gating was not a part of the original acquisition protocol, and the defect signals were not affected by respiratory or cardiac motion. Thus, this study evaluated detection performance of stationary signals in motion-blurred backgrounds. The findings reported here are clinically valuable since nongating cardiac PET is not uncommon in clinical practice. In the future, it may be interesting to add an artificial detect in each cardiac and respiratory motion phase if the motion can be measured using, for example, simultaneous PET/MR.32 The measured motion fields can be incorporated into PET reconstruction that includes both TOF and PSF. A defect detection study using a moving artificial defect would allow us to evaluate the performance of PET reconstruction that includes motion correction, PSF, and TOF.
Observer performance in this study was strongly influenced by defect contrast, supported by the fact that postreconstruction smoothing degraded observer SNR in nearly every case. Image smoothing can be beneficial for reducing noise and correlating pixel values, but in the myocardium, where there were high levels of activity, noise was not an important consideration. Here, the smoothing operation offered little benefit, and instead, reduced the contrast between the cold defects and the hot background because the high frequency components were removed. Additionally, regions of relatively low activity suffer from positive bias in iterative reconstruction,33, 34 and many iterations are needed to reduce this bias and approach the true defect contrast. Thus, observer performance generally peaked in the reconstructions with high iterations and low smoothing.
This was especially true for reconstructions modeling the system PSF, which is known to slow iterative convergence and to increase correlations between neighboring voxels. The comparison of all images at three iterations showed that inclusion of the PSF model degraded performance because the defect contrast had not converged. The analyses over all iterations showed that maximum observer SNR was achieved for these algorithms in the last iteration we used and with no smoothing; this was independent of defect contrast.
For algorithms without PSF, the optimal reconstruction parameters in Fig. 5 did depend on defect contrast. For faint signals, fewer iterations were needed to maximize observer SNR, because high contrast takes longer to converge. As iteration number increased, our results showed that detection SNR decreased more for low contrast relative to high contrast defects. When the reconstruction parameters for each algorithm were optimized, PSF showed more benefit than TOF for faint defects because of the enhancement to the signal contrasts. At similar contrast levels, TOF improved observer SNR because it decreased statistical noise, but for faint defects, the gains in contrast recovery associated with PSF substantially outweighed the noise differences. TOF always performed better for higher-contrast defects, and the combination of TOF and PSF improved performance for all contrasts.
CONCLUSION
For typical reconstruction protocols used in clinical practice using less than five iterations, TOF improved defect detectability. At these low iteration numbers, PSF generally yielded less detectability. However, performance of PSF improved greatly at the higher iteration numbers, even surpassing that of non-PSF TOF for faint defects. The combination of TOF and PSF performed best for all conditions. In this work, both TOF and PSF showed potential to improve observer performance, but care should be taken to choose the reconstruction parameters appropriate to the imaging task.
ACKNOWLEDGMENT
This work was supported, in part, by Grant Nos. R01-HL110241, R01-CA165221, R01-HL118261, and T32-EB013180.
References
- Tomitani T., “Image reconstruction and noise evaluation in photon time-of-flight assisted positron emission tomography,” IEEE Trans. Nucl. Sci. 28, 4581–4589 (1981). 10.1109/TNS.1981.4335769 [DOI] [Google Scholar]
- Budinger T., “Time-of-flight positron emission tomography: Status relative to conventional PET,” J. Nucl. Med. 24, 73–78 (1983). [PubMed] [Google Scholar]
- Conti M., Bendriem B., Casey M., Chen M., Kehren F., Michel C., and Panin V., “First experimental results of time-of-flight reconstruction on an LSO PET scanner,” Phys. Med. Biol. 50, 4507–4526 (2005). 10.1088/0031-9155/50/19/006 [DOI] [PubMed] [Google Scholar]
- Lois C., Jakoby B. W., Long M. J., Hubner K. F., Barker D. W., Casey M. E., Conti M., Panin V. Y., Kadrmas D. J., and Townsend D. W., “An assessment of the impact of incorporating time-of-flight information into clinical PET/CT imaging,” J. Nucl. Med. 51, 237–245 (2010). 10.2967/jnumed.109.068098 [DOI] [PMC free article] [PubMed] [Google Scholar]
- Karp J. S., Surti S., Daube-Witherspoon M. E., and Muehllehner G., “Benefit of time-of-flight in PET: Experimental and clinical results,” J. Nucl. Med. 49, 462–470 (2008). 10.2967/jnumed.107.044834 [DOI] [PMC free article] [PubMed] [Google Scholar]
- Jakoby B., Bercier Y., Conti M., Casey M., Gremillion T., Hayden C., Bendriem B., and Townsend D., “Performance investigation of a time-of-flight PET/CT scanner,” in Proceedings of the Nuclear Science Symposium and Medical Imaging Conference (NSS/MIC), Dresden, 19–25 Oct. 2008 (IEEE, New York, 2008), pp. 3738–3743.
- Panin V. Y., Kehren F., Michel C., and Casey M., “Fully 3-D PET reconstruction with system matrix derived from point source measurements,” IEEE Trans. Med. Imaging 25, 907–921 (2006). 10.1109/TMI.2006.876171 [DOI] [PubMed] [Google Scholar]
- Tong S., Alessio A., and Kinahan P., “Noise and signal properties in PSF-based fully 3D PET image reconstruction: An experimental evaluation,” Phys. Med. Biol. 55, 1453–1473 (2010). 10.1088/0031-9155/55/5/013 [DOI] [PMC free article] [PubMed] [Google Scholar]
- Daube-Witherspoon M. E., Matej S., Werner M. E., Surti S., and Karp J. S., “Impact of resolution modeling on accuracy and precision of lesion contrast measurements,” in Proceedings of the Nuclear Science Symposium and Medical Imaging Conference (NSS/MIC), Valencia, 23–29 Oct. 2011 (IEEE, New York, 2011), pp. 4373–4377.
- Walker M. D., Asselin M., Julyan P. J., Feldmann M., Talbot P., Jones T., and Matthews J., “Bias in iterative reconstruction of low-statistics PET data: Benefits of a resolution model,” Phys. Med. Biol. 56, 931–949 (2011). 10.1088/0031-9155/56/4/004 [DOI] [PubMed] [Google Scholar]
- Rahmim A. and Tang J., “Noise propagation in resolution modeled PET imaging and its impact on detectability,” Phys. Med. Biol. 58, 6945–6968 (2013). 10.1088/0031-9155/58/19/6945 [DOI] [PMC free article] [PubMed] [Google Scholar]
- Kadrmas D. J., Casey M. E., Conti M., Jakoby B. W., Lois C., and Townsend D. W., “Impact of time-of-flight on PET tumor detection,” J. Nucl. Med. 50, 1315–1323 (2009). 10.2967/jnumed.109.063016 [DOI] [PMC free article] [PubMed] [Google Scholar]
- Armstrong I. S., Williams H. A., and Matthews J. C., “Accuracy and variability of quantitative measurements using PET with time-of-flight information and resolution modelling,” in Proceedings of the Nuclear Science Symposium and Medical Imaging Conference (NSS/MIC), Valencia, 23–29 Oct. 2011 (IEEE, New York, 2011), pp. 4167–4170.
- Casey M., Point Spread Function Reconstruction in PET (Siemens Medical Solution, Knoxville, TN, 2007). [Google Scholar]
- Surti S., Scheuermann J., El Fakhri G., Daube-Witherspoon M. E., Lim R., Abi-Hatem N., Moussallem E., Benard F., Mankoff D., and Karp J. S., “Impact of time-of-flight PET on whole-body oncologic studies: A human observer lesion detection and localization study,” J. Nucl. Med. 52, 712–719 (2011). 10.2967/jnumed.110.086678 [DOI] [PMC free article] [PubMed] [Google Scholar]
- El Fakhri G., Surti S., Trott C. M., Scheuermann J., and Karp J. S., “Improvement in lesion detection with whole-body oncologic time-of-flight PET,” J. Nucl. Med. 52, 347–353 (2011). 10.2967/jnumed.110.080382 [DOI] [PMC free article] [PubMed] [Google Scholar]
- Kadrmas D. J., Casey M. E., Black N. F., Hamill J. J., Panin V. Y., and Conti M., “Experimental comparison of lesion detectability for four fully-3D PET reconstruction schemes,” IEEE Trans. Med. Imaging 28, 523–534 (2009). 10.1109/TMI.2008.2006520 [DOI] [PMC free article] [PubMed] [Google Scholar]
- Surti S. and Karp J. S., “Experimental evaluation of a simple lesion detection task with time-of-flight PET,” Phys. Med. Biol. 54, 373–384 (2009). 10.1088/0031-9155/54/2/013 [DOI] [PMC free article] [PubMed] [Google Scholar]
- Schaefferkoetter J., Casey M., Townsend D., and El Fakhri G., “Clinical impact of time-of-flight and point response modeling in PET reconstructions: a lesion detection study,” Phys. Med. Biol. 58, 1465–1478 (2013). 10.1088/0031-9155/58/5/1465 [DOI] [PMC free article] [PubMed] [Google Scholar]
- Di Carli M. F., Davidson M., Little R., Khanna S., Mody F. V., Brunken R. C., Czernin J., Rokhsar S., Stevenson L. W., and Laks H., “Value of metabolic imaging with positron emission tomography for evaluating prognosis in patients with coronary artery disease and left ventricular dysfunction,” Am. J. Cardiol. 73, 527–533 (1994). 10.1016/0002-9149(94)90327-1 [DOI] [PubMed] [Google Scholar]
- Le Meunier L., Slomka P. J., Dey D., Ramesh A., Thomson L. E., Hayes S. W., Friedman J. D., Cheng V., Germano G., and Berman D. S., “Enhanced definition PET for cardiac imaging,” J. Nucl. Cardiol. 17, 414–426 (2010). 10.1007/s12350-010-9193-7 [DOI] [PubMed] [Google Scholar]
- Anagnostopoulos C., Georgakopoulos A., Pianou N., and Nekolla S. G., “Assessment of myocardial perfusion and viability by positron emission tomography,” Int. J. Cardiol. 167, 1737–1749 (2013). 10.1016/j.ijcard.2012.12.009 [DOI] [PubMed] [Google Scholar]
- Michel C., Sibomana M., Boi A., Bernard X., Lonneux M., Defrise M., Comtat C., Kinahan P., and Townsend D., “Preserving Poisson characteristics of PET data with weighted OSEM reconstruction,” in Proceedings of the Nuclear Science Symposium and Medical Imaging Conference (NSS/MIC), Toronto, 8–14 Nov. 1998 (IEEE, New York, 1998), pp. 1323–1329.
- El Fakhri G., Santos P. A., Badawi R. D., Holdsworth C. H., Van Den Abbeele A. D., and Kijewski M. F., “Impact of acquisition geometry, image processing, and patient size on lesion detection in whole-body 18F-FDG PET,” J. Nucl. Med. 48, 1951–1960 (2007). 10.2967/jnumed.108.007369 [DOI] [PubMed] [Google Scholar]
- Javadi M. S., Lautamäki R., Merrill J., Voicu C., Epley W., McBride G., and Bengel F. M., “Definition of vascular territories on myocardial perfusion images by integration with true coronary anatomy: a hybrid PET/CT analysis,” J. Nucl. Med. 51, 198–203 (2010). 10.2967/jnumed.109.067488 [DOI] [PubMed] [Google Scholar]
- Gifford H., Kinahan P., Lartizien C., and King M., “Evaluation of multiclass model observers in PET LROC studies,” IEEE Trans. Nucl. Sci. 54, 116–123 (2007). 10.1109/TNS.2006.889163 [DOI] [PMC free article] [PubMed] [Google Scholar]
- Yao J. and Barrett H., “Predicting human performance by a channelized Hotelling observer model,” Proc. SPIE 1768, 161–168 (1992). 10.1117/12.130899 [DOI] [Google Scholar]
- Barrett H., Yao J., Rolland J., and Myers K., “Model observers for assessment of image quality,” Proc. Natl. Acad. Sci. U.S.A. 90, 9758–9765 (1993). 10.1073/pnas.90.21.9758 [DOI] [PMC free article] [PubMed] [Google Scholar]
- Gifford H., King M., De Vries D., and Soares E., “Channelized Hotelling and human observer correlation for lesion detection in hepatic SPECT imaging,” J. Nucl. Med. 41, 514–521 (2000). [PubMed] [Google Scholar]
- Abbey C. and Barrett H., “Human-and model-observer performance in ramp-spectrum noise: Effects of regularization and object variability,” J. Opt. Soc. Am. A 18, 473–488 (2001). 10.1364/JOSAA.18.000473 [DOI] [PMC free article] [PubMed] [Google Scholar]
- Gifford H., King M., Pretorius P., and Wells R., “A comparison of human and model observers in multislice LROC studies,” IEEE Trans. Med. Imaging 24, 160–169 (2005). 10.1109/TMI.2004.839362 [DOI] [PubMed] [Google Scholar]
- Ouyang J., Li Q., and El Fakhri G., “Magnetic resonance-based motion correction for positron emission tomography imaging,” Semin. Nucl. Med. 43, 60–67 (2013). 10.1053/j.semnuclmed.2012.08.007 [DOI] [PMC free article] [PubMed] [Google Scholar]
- Stute S., Nuyts J., Van Slambrouck K., Sibomana M., van Velden F., Boellaard R., and Comtat C., “Image properties of various ML-based reconstructions of very noisy HRRT data,” in Proceedings of the Nuclear Science Symposium and Medical Imaging Conference (NSS/MIC), Valencia, 23–29 Oct. 2011 (IEEE, New York, 2011), pp. 4311–4315.
- Nuyts J., Stute S., Van Slambrouck K., van Velden F., Boellaard R., and Comtat C., “Maximum-likelihood reconstruction based on a modified Poisson distribution to reduce bias in PET,” in Proceedings of the Nuclear Science Symposium and Medical Imaging Conference (NSS/MIC), Valencia, 23–29 Oct. 2001 (IEEE, New York, 2011), pp. 4337–4341.


