

Abstract
Brain tissue swelling is a dangerous consequence of traumatic injury and is associated with raised intracranial pressure and restricted blood flow. We consider the mechanical effects that drive swelling of brain tissue slices in an ionic solution bath, motivated by recent experimental results that showed that the volume change of tissue slices depends on the ionic concentration of the bathing solution. This result was attributed to the presence of large charged molecules that induce ion concentration gradients to ensure electroneutrality (the Donnan effect), leading to osmotic pressures and water accumulation. We use a mathematical triphasic model for soft tissue to characterize the underlying processes that could lead to the volume changes observed experimentally. We suggest that swelling is caused by an osmotic pressure increase driven by both non-permeating solutes released by necrotic cells, in addition to the Donnan effect. Both effects are necessary to explain the dependence of the tissue slice volume on the ionic bath concentration that was observed experimentally.
Keywords: Donnan effect, triphasic model, brain mechanics, tissue swelling
1. Introduction
Following damage such as stroke or traumatic brain injury, brain tissue has been observed to swell [1]. As the brain is confined by the skull, local swelling may be associated with compression of other regions of tissue, increased intracranial pressure and restricted blood supply to the brain [2]. Brain swelling is a significant cause of morbidity and death [3]: current medical strategies aim to reduce swelling and intracranial pressure in order to maintain blood supply and retain cerebral metabolism [4]. However, to enable treatments to be developed it is of critical importance to understand the underlying physical effects that cause brain tissue to swell following injury.
1.1. Swelling of brain tissue slices
Brain swelling, or oedema, occurs when there is an abnormal accumulation of water within the brain tissue [5,6]. It is thought that this water accumulation is primarily driven by osmotic effects [7], as the mechanisms that maintain osmotic gradients between tissue, blood and cerebrospinal fluid are disrupted when tissue is damaged. Our aim is to understand the relationship between osmotic gradients, water accumulation and deformation in damaged brain tissue. As an initial step towards understanding the interplay of these complex processes leading to oedema, we consider here the swelling of brain tissue slices bathed in salt solution. Tissue slice experiments are common as brain slices in vitro maintain many aspects of their in vivo characteristics, while the external environment can be controlled with relative ease [8]. Numerous experimental studies have observed that brain tissue slices swell when excised from the brain and placed in an isotonic solution bath [9–11]. We focus on the experimental results of Elkin et al. [9], as they carried out systematic experiments to determine slice volume change over a range of bathing solution concentrations.
Experiments were performed on cortex slices from rats, measuring 3 × 1.5 × 0.35 mm. There were two sets of experimental conditions and results of particular interest. First, slices were treated with electron transport chain decouplers (10 mM 2-deoxyglucose and 5 mM sodium cyanide) and placed in an isotonic (300 mOsm) artificial CSF solution (Gey's salt solution) for 24 h. This treatment blocked metabolic activity in the cells, leading to damage and hence swelling. The volume of the slices was then measured to establish a baseline volume change of 74 ± 10%.
Second, damaged slices were transferred to solutions with different ionic concentrations (6, 200, 300, 1000, 2000 and 4000 mOsm) for 2 h before the swollen volume of tissue was measured again. It was observed that when the tissue was moved to a less concentrated ionic solution bath it would swell further; when the tissue was moved to a more concentration solution bath then it would shrink. Results were given for the volume change relative to a baseline volume. Since we are interested in the processes leading to the total volume change from healthy to damaged tissue, we rescale the results for the concentration-dependent swelling with respect to the mean baseline volume change of 74 ± 10% to obtain the volume change in each ionic concentration, relative to the original volume of the healthy tissue slice.
1.2. Causes of oedema
In vivo brain tissue swelling may be caused by one or more of a number of mechanisms, including changes in blood–brain barrier permeability, accumulation of plasma proteins in the tissue and abnormal cell metabolism and function. As brain tissue slices are isolated from the vasculature, changes in blood–brain barrier permeability cannot be a factor in the swelling of such slices.
Elkin et al. [9] propose that the Donnan effect contributes to the physical driving force underlying brain tissue swelling. The Donnan effect occurs when a charged porous medium is in contact with an ionic solution. At equilibrium, the ions must be in electrochemical equilibrium, and the tissue must be electroneutral. The charges on the porous medium require neutralization and so ions move in to neutralize the medium charge; the ion concentration is greater within the porous medium than outside. This difference in internal and external ion concentration leads to an osmotic pressure that drives fluid from the ionic solution into the porous medium [12]. If the porous medium is elastic, this osmotic pressure and the concomitant influx of water causes deformation of the medium, i.e. swelling.
The fixed negative charges in the brain are due to macromolecules such as proteoglycans and DNA: we refer to these charges collectively as the fixed charge density (FCD). In healthy brain tissue, macromolecules with a net negative charge are present within cells [13]. As living cells are able to actively regulate transport across their cell membrane, they are able to prevent the influx of ions that would otherwise lead to the Donnan effect. The FCD in healthy tissue is therefore isolated from the tissue mixture, and so there is effectively no FCD. However, when brain tissue is damaged the cell membranes lose their integrity and the FCD within cells may become exposed. The tissue can then be thought of as a mixture of solid components (extra and intracellular matrix with FCD attached), water and dissolved ions. Thus, tissue damage effectively causes an increase in the FCD of the tissue, which might lead to tissue swelling via the Donnan effect.
An alternative hypothesis for the increase in osmotic pressure within the tissue slices is that it is caused by an accumulation of solutes. An increase in tissue osmolarity has been measured in the core of an oedemic region following contusion and ischaemia that was not due to changes in organic ion concentration [14]. The authors hypothesize that the increase in osmolarity is due to solutes produced during abnormal metabolism in distressed tissue. An increase in solute concentration could also arise from the proteins which are usually isolated within the intracellular space [13] and become merged with the interstitum when the cell membranes are damaged. As the slices measure just 0.35 mm in depth, small uncharged solutes that are able to diffuse easily through the mixture will rapidly equilibrate in concentration with the solution bath. Only solutes that cannot move through the convoluted architecture of the tissue, and become ‘trapped’ by the solid matrix, will contribute to the osmotic pressure within the tissue.
1.3. Mathematical modelling approaches
While the mechanical properties of brain tissue under compression, extension and shear have been studied extensively (e.g. [15–18]), the properties and behaviour of swelling brain tissue have received relatively little attention in the biomechanics literature. The deformation of brain tissue caused by a given force depends upon the rate at which that force is applied [19]. A common approach is to model the tissue as a viscoelastic material whereby the elastic coefficients in the stress–strain relationship are time dependent: this approach is typically applicable for processes that occur rapidly such as car crashes or sports injuries [20,21].
An alternative approach is a multiphase (or poroelastic) theory, where components of the tissue are treated as separate, interacting phases. Biphasic and poroelastic models, incorporating a porous elastic solid phase (representing cells and extracellular matrix) and a fluid phase (representing interstitial fluid), have been applied to model conditions such as hydrocephalus [22,23] and oedema [24]. A triphasic model is an extension of the biphasic approach to include positive and negative ions species. Elkin et al. [9] investigated the behaviour of damaged slices of brain tissue using a triphasic model, while Drapaca & Fritz [25] use a triphasic model to propose a new mechanism for hydrocephaulus. This triphasic model was originally proposed by Lai et al. [12] for cartilage, and comprises three mobile phases: solid, fluid and ions, along with an FCD adhered to the solid phase. Cartilage has a different structure to brain tissue: cartilage has a dense extracellular matrix (ECM) with a high concentration of negatively charged proteoglycans and is highly acellular [26], while soft tissues such as the brain contain a lower proteoglycan concentration, and much greater cell density. The proteoglycans of the ECM are the primary source of FCD in cartilage. It is unclear whether significant FCD is exposed in healthy brain tissue, but the analysis of Elkin et al. [9] indicates that damaged brain tissue does indeed behave as a triphasic mixture.
In this work, we extend the triphasic approach to investigate whether exposure of FCD (the Donnan effect) alone is sufficient to explain the two experimental observations of Elkin: (i) the 74% volume increase observed in isotonic bathing solution and (ii) the dependence of the final slice volume on the ionic concentration of the bathing solution.
2. Mathematical model for equilibrium swelling
We consider a steady-state equilibrium model of swelling, rather than investigating the dynamics of the system. To understand why this is appropriate, we consider the timescales in the problem. The experimental slices were of thickness h = 0.35 mm, the diffusion coefficient of ions in soft tissue is of order D = 10−10 m2 s−1 [27], and the hydraulic conductivity of brain tissue to water is of order K = 10−12 m2 Pa−1 s−1 [23,28]. The timescale for ions to equilibrate is h2/D, while the timescale for water to equilibrate is h2/K/Δp (where Δp is the pressure drop across the system, which is of order Δp = 1000 Pa for brain tissue swelling). Calculating these timescales indicates that both the water and ions should respond to an instantaneous change in FCD over a timescale of minutes. In the experiments of Elkin et al. [9] however, swelling evolved over several hours. This suggests that it is biological processes (such as the rate of exposure of FCD) rather than physical processes (such as the rate of movement of ions and water) that determine the swelling rate. At each stage of the process, we expect the system to be approximately in equilibrium.
We use a steady-state triphasic model to investigate the volume change in brain tissue caused by a prescribed FCD increase. The mathematical model we present is equivalent to that given by Elkin et al. [9], and note that this model is described elsewhere in the literature (for example with application to articular cartilage [12,29,30]). In §4, we show that this model can be extended to account for the presence of additional non-permeating solute species.
2.1. Model set-up
We consider a cuboid of tissue allowed to swell freely in an ionic solution bath. We assume that the solution bath is of constant composition, well mixed, and at concentration c* and pressure p*. The tissue is modelled as a triphasic mixture of incompressible phases: an elastic solid phase (representing solid components of the tissue such as extracellular matrix), a fluid phase and a solute phase composed of positive and negative ion phases in solution. In addition, there is an FCD represented by a negative charge on the solid matrix. Figure 1 shows a schematic of the phases considered in our model.
Figure 1.
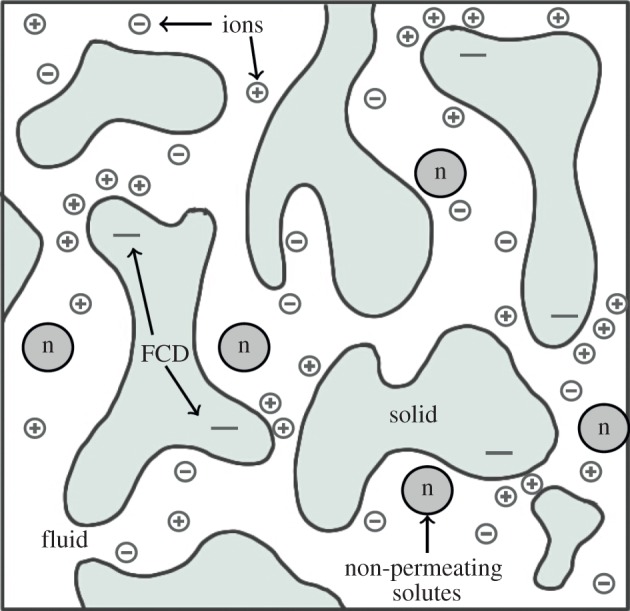
A schematic of the phases considered in a triphasic model: a solid phase, fluid phase and solutes (positive (+) and negative (−) ion species, and non-permeating solutes (n)). Some components of the solid phase have a net negative charge (FCD), which induce ion concentrations to satisfy charge neutralization. (Online version in colour.)
The volume fraction of the solid phase, defined as the volume of solid divided by the volume of the mixture, is denoted by ϕs. We assume that the mixture is saturated and the solute concentrations are sufficiently dilute that the volume fractions of the solute may be neglected in comparison with the solid and fluid phases: thus the volume fraction of the fluid is 1 − ϕs. The concentrations of positive and negative ions, and FCD within the tissue, are denoted c+, c− and cf, respectively. The mixture is electroneutral, and when in steady state the fluid and ion phases are in electrochemical equilibrium. When an FCD is present these requirements cause the steady-state ion concentration to be greater within the tissue than in the solution bath [12,30].
We compute the steady-state equilibrium to determine the volume change between healthy and damaged tissue. In the healthy state, we assume that the FCD is negligible: therefore, the ion concentration within the tissue is equal to that of the solution bath and there is no osmotic pressure within the tissue. We model tissue damage by increasing the reference state  to mimic an increase of FCD now present in the tissue: this FCD induces an ion concentration difference between the tissue and bath which causes an osmotic pressure gradient. This osmotic pressure difference drives water to accumulate within the tissue, therefore causing swelling.
A key point is that a triphasic mathematical model measures the volume change of the tissue relative to a ‘reference state’. We take the reference state to be the original volume of the tissue when excised, before the experiments began. Therefore, the volume change predicted by our model is the total volume change undergone during the experiments (i.e. the volume change between healthy tissue when originally excised, and damaged tissue following both experiments). By contrast, Elkin et al. [9] treated the already damaged tissue, in a concentrated solution bath, as being the reference state. While the latter approach allows the behaviour of damaged tissue to be studied, the physical relevance of their reference state is unclear, and the causes of the overall change in tissue volume cannot be investigated.
2.2. Governing equations
The solid phase is treated as a homogeneous, isotropic, incompressible elastic solid, and the tissue deformation is determined by the stretch of the solid phase. The tissue is described in the (stress-free) reference configuration by the material coordinates X, and after deformation is defined by new coordinates x = χ(X, t) (referred to as the current configuration). The deformation gradient tensor F is defined by
| 2.1 |
It is also useful to define J = det(F), the local change in volume due to deformation [31]. Since the solid phase is incompressible, the mass conservation of the solid phase can be written as
| 2.2 |
where  is the volume fraction of the solid in the stress-free reference state.
The behaviour of the tissue is determined by a balance of elastic stress and osmotic pressure. The elastic properties of brain tissue under finite deformation have been modelled by several stress–strain constitutive laws, including the Ogden [32] and Fung [9] models. In mixture theory, the stress tensor has two components, which represent the stress due to the elastic properties of the tissue and that due to fluid pressure. For comparison with Elkin et al. [9], we treat the tissue as an isotropic Fung material [33], so that the Cauchy stress has the form:
| 2.3 |
where p is the fluid pressure, B = FFT is the left Cauchy–Green stress tensor and
| 2.4 |
The parameters λs, μs are chosen so that for small deformations they coincide with the Lamé coefficients of the solid, and c is an additional elastic modulus (with units of stress) which controls the strain stiffening.
The tissue experiences free swelling boundary conditions. At equilibrium, the stress within the tissue must balance the pressure exerted by the solution bath (σ = −p*I) [34]. As the tissue is assumed homogeneous and isotropic, an equilibrium deformation with these boundary conditions takes the form F = λI, where λ is the stretch in each principal direction. Therefore,
| 2.5 |
where K = λs+2/3μs is the bulk modulus.
Within the tissue the positive ions (c+) and negative ions (c−) contribute to the osmotic pressure. Assuming ideal solutions, the osmotic pressure difference between the tissue and bath is
| 2.6 |
where c* is the osmotic concentration of the bath, R is the ideal gas constant and T the absolute temperature. At equilibrium, the ions must be distributed so that they are in electrochemical equilibrium and such that the tissue is electroneutral everywhere: therefore, the positive and negative ion concentration within the tissue is determined by the Donnan equilibrium (e.g. [29,30])
| 2.7 |
As the FCD is attached to the solid phase, the concentration of FCD is related to the deformation according to
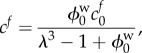 |
2.8 |
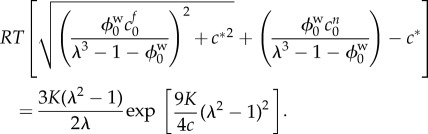
where cf0 and  represent the FCD and volume fraction of water in the stress-free reference state, respectively. Substituting equations (2.6)–(2.8) into equation (2.5) gives a single equation for λ
 |
2.9 |
which can be solved numerically for the stretch λ (e.g. using Newton's method). The right-hand side of equation (2.9) represents the elastic stress in the tissue, whereas the left-hand side the osmotic pressure; the equilibrium state occurs when the elastic stress and osmotic pressure are balanced.
2.3. Parametrization
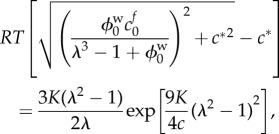
The meanings and typical values of the parameters used in the model are given in table 1. Note in particular that for the strain stiffening parameter c, Elkin et al. [9] fitted data to obtain c = 26.5 Pa for brain tissue (they noted that their fit was not sensitive to this parameter). However, if this were the case, then the observed volume increase of 74% would require fluid pressure to be of the order 1 × 10⁷ Pa (1 × 10⁵ mmHg). As intracranial pressure increases associated with oedema are of the order 1 × 10³ Pa (10−20 mmHg) [37], this is clearly unphysiological. For a typical biological tissue, the exponential coefficient 9 K/4c ≈ 1 [35], therefore we choose c = 1000 Pa to ensure that this is the case. The difference in stress–strain relationships for these values of the strain stiffening parameter c is shown in figure 2.
Table 1.
Summary of the parameters values used in the model. Note that the units Eq represent the amount of a substance multiplied by its valence.
| parameters for the triphasic model in the brain | |||
|---|---|---|---|
| item | meaning | value | references |
| K | bulk modulus (calculated from Poisson ratio of 0.35 and Young's modulus of 350 Pa) | 380 Pa | [28] |
| c | strain stiffening elastic parameter | 1000 Pa | [35] |
 |
reference state tissue water volume fraction | 0.8 | [10] |
 |
reference state solid volume fraction ( ) ) |
0.2 | [10] |
 |
FCD of damaged tissue at reference state | 4 mEq l−1 | [9] |
| R | gas constant | 8.3 J mol−1 K−1 | [36] |
| T | temperature | 310 K | [9] |
Figure 2.
Stress–strain relationships for the Fung elastic model, as given by equation (2.5), with bulk modulus K = 380 Pa, for three values of the strain stiffening parameter c. The gradient of each curve gives a measure of the stiffness: a steeper slope indicates that the mixture is stiffer, as a greater stress is required to produce a particular volume change. We observe that all these curves exhibit strain stiffening, whereby the material becomes stiffer at greater strains. However, at lower values of c, the stiffening occurs at smaller volume changes.
In the healthy state, we assume that the FCD is negligible  , which has the consequence that λ = 1 is a solution to equation (2.9), i.e. there is no swelling without FCD. We model damage by increasing the FCD to a fixed value: the FCD in damaged brain tissue was measured by Elkin et al. [9] by assaying the GAG content (glycosaminoglycan, a major component of FCD in biological tissue) of damaged brain tissue (finding a reference state FCD of
  ). For a particular
  the solution λ to equation (2.9) gives the stretch of the tissue from the healthy to damaged state; the corresponding volume change is simply
 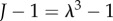 .
.
We exclude the data point corresponding to the 6 mOsm solution bath (the most dilute bathing solution) in our analysis. Indeed, if the FCD is of comparable magnitude to the concentration of the bathing solution, the osmotic pressure induced by the Donnan effect is very sensitive to the FCD. For example, an increase in the FCD from 10 to 11 mEq l−1 can lead to an osmotic pressure change of up to 90 Pa (less than 1 mmHg) in an isotonic solution, but could cause an osmotic pressure change of over 2000 Pa (15 mmHg) in a 6 mOsm bathing solution. Furthermore, it has been observed experimentally that brain tissue fails at strains over 25% [38]. The only bathing concentration causing a strain over 25% is 6 mOsm (a volume increase of 130% is equivalent to over 30% strain in each principal direction), and therefore, it is uncertain whether the elastic parameters are relevant in this regime. Additionally for the 6 mOsm bathing solution, we cannot be confident of the assumption that the concentration of the solution bath remains constant, since products released from the damaged tissue may cause a proportionately large change in the concentration of the bathing solution. For more concentrated bathing solutions, this effect would be relatively insignificant. Given the sensitivity of the model to this data point, and the uncertainly over whether the assumptions of the model are valid, we exclude this data point from our analysis.
3. The Donnan hypothesis
In this section, we analyse solutions to equation (2.9) to investigate whether the Donnan effect is able to explain the magnitude of swelling observed experimentally. The experimental results of Elkin et al. [9] are shown in figure 3b, showing the volume change of tissue slices in ionic solution baths of 6, 200, 300, 1000 and 2000 and 4000 mOsm relative to their size when initially excised.
Figure 3.
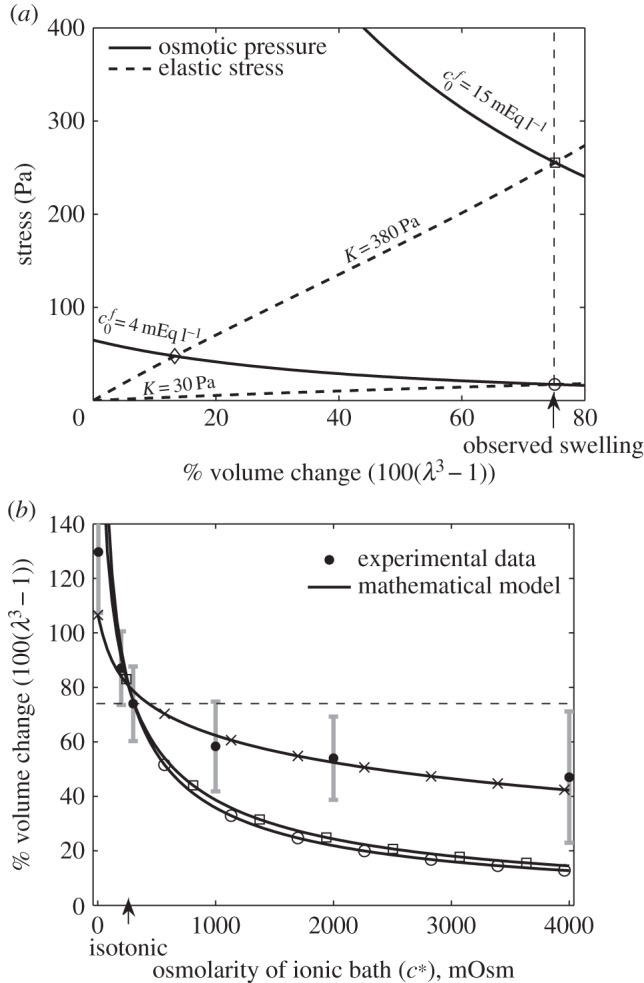
(a) Elastic stress within the tissue (dashed curves) and osmotic pressure due to the Donnan effect (solid curves) in an isotonic solution (c* = 300 mOsm) as a function of tissue volume change. Intersections between the elastic stress and osmotic pressure give solutions to equation (2.9) for a particular parameter set. For an FCD of  and bulk modulus K = 380, we see that only 15% volume change would be expected, yet experimentally 74% was observed. Increasing the FCD to
  or decreasing the bulk modulus to K = 30 Pa allows 74% swelling. (b) Shows expected swelling (solutions to equation (2.9)) as a function of bath ionic concentration, for comparison with experimental data from Elkin et al. [9]. The error bars signify the minimum and maximum expected range based upon the standard error of the mean given by Elkin et al. [9]. Each of the two parameter sets that give 74% swelling in isotonic solution are used as follows: squares,
  , K = 380 Pa; circles,
  , K = 30 Pa. Additionally, we show the curve obtained by performing a least-squares fit for the bulk modulus and FCD: crosses,
  , K = 4475 Pa. These parameters are unphysiological.
To begin with, we consider whether the Donnan effect can explain the 74% ‘baseline’ swelling observed when damaged tissue slices are submerged in an isotonic ionic solution. Figure 3a shows both the osmotic pressure (left-hand side of equation (2.9)) and elastic stress (right-hand side of equation (2.9)) for a tissue slice in isotonic bathing solution (c* = 300 mOsm), as a function of the volume change  . Solutions to equation (2.9) occur where these curves intersect so that the osmotic pressure balances the elastic stress. Table 1 shows relevant physiological parameters for brain tissue: based upon the accepted values of these parameters, a volume change of 15% should be expected.
The discrepancy between the 15% swelling predicted and 74% observed experimentally leads us to re-evaluate the material parameters used. The bulk modulus of K = 380 Pa was measured for recently excised brain tissue [28]. It therefore seems possible that the elastic properties of brain tissue may change over the course of the experiment. Figure 3a shows that if the bulk modulus of brain tissue were reduced to K = 30 Pa, then 74% swelling would be predicted in an isotonic solution bath. However, while there is evidence that unphysiological experimental conditions such as temperature may affect the Young modulus by 50% [39] there is no precedent for the 10-fold decrease in the elastic moduli of damaged brain tissue that would be needed to explain the 74% baseline swelling shown in figure 3a. On the contrary, experiments have indicated that the elastic moduli of brain tissue actually increases post-mortem [40].
An alternative explanation for the discrepancy is that the FCD of dead brain tissue may be greater than that measured experimentally. The physiological FCD of  was calculated by assaying just the sulfated GAG concentration. As observed by Elkin et al. [9], there may be other sources of FCD in the damaged tissue. If instead the bulk modulus is maintained at K = 380 Pa but the FCD is increased to
  , we observe from figure 3a that a volume change of 74% is predicted in an isotonic solution. We now use these two scenarios (K = 380 Pa and
  , or
, or  Pa and
  ) as a starting point to investigate the second series of experiments performed by Elkin: examining the further swelling when exposed to different bath concentrations.
In figure 3b, we show results of the theoretical model for each of the parameter sets in figure 3a; we also show the experimental data. This shows that while an FCD of  and bulk modulus of K = 380 Pa, or FCD of
  and bulk modulus of K = 30 Pa, are sufficient to explain the swelling observed in isotonic bathing solution (300 mOsm), these parameters do not to explain the swelling observed across the range of ionic bathing solutions investigated experimentally. As a first step to understanding the swelling observed at different concentrations, we conducted a least-squares fit to determine the bulk modulus and reference state FCD that best fit the experimental data. This yields K = 4475 Pa and
  . While these parameters show a good fit to the data they are unphysiological: the bulk modulus is an order of magnitude greater than that measured experimentally, while the FCD is two orders of magnitude greater than that measured in brain tissue.
With physiological parameters, the theoretical model shows that the Donnan effect is unable to explain the concentration-dependent swelling observed experimentally. This indicates that exposure of intracellular FCD, leading to the Donnan effect, cannot be the only mechanism driving tissue slice swelling. We therefore seek an alternative explanation.
4. Extension to non-permeating solutes
As it is unlikely that exposure of intracellular FCD is the only driver of increased osmotic pressure, we consider other sources of solutes. For example, the breakdown of capillary membranes can lead to an increase in the plasma protein content of the tissue [1]. Similarly, breakdown of cell membranes may allow proteins previously isolated within the intracellular space to be released into the tissue, and it has been hypothesized that brain injury causes abnormal cellular metabolism leading to degradation of large molecules and tissue structures, causing an elevation in tissue osmolarity [14]. In this section, we investigate the effects of an increase in solute concentration in the tissue.
We hypothesize that along with an increase in FCD, damaged brain tissue also experiences an increase in the concentration of uncharged solutes. Whereas many of these solutes may be small enough to diffuse down concentration gradients and equilibrate with the external solution bath, others may be sufficiently large that they become trapped within the tissue by the various membranes and intracellular and extracellular structures that are present. We refer to these as non-permeating solutes [41].
While both changes in non-permeating solute concentrations and exposure of FCD lead to osmotic pressure increases, the mechanism through which they do so is different. On the one hand, exposure of FCD induces an ion concentration difference between the bathing solution and tissue. This is both to ensure electroneutrality and prevent chemical potential gradients at equilibrium [42]. Because of this coupling, the osmotic pressure induced by exposure of FCD depends on the concentration of the bathing solution. On the other hand, non-permeating solutes are physically trapped within the tissue and exert an osmotic pressure of their own accord, independent of the bathing concentration. They are unable to equilibrate in concentration with the external bathing solution because they cannot diffuse through the mixture.
For simplicity, we assume that a negligible concentration of these non-permeating solutes is present in healthy tissue, whereas there is a homogeneous concentration in damaged tissue. Defining cn as this solute concentration in a damaged tissue, and  as the concentration for damaged tissue in the reference state, similar to equation (2.8), we may express the current concentration in terms of the deformation
| 4.1 |
As the non-permeating solutes are trapped within the tissue, their presence alters the governing equation by adding an additional term to the osmotic pressure. Therefore, the governing equation (2.9) becomes
 |
4.2 |
We fit for the reference state FCD  and non-permeating solute concentration
  from equation (4.2) to the experimental data by minimizing the least-squares error, finding
  and
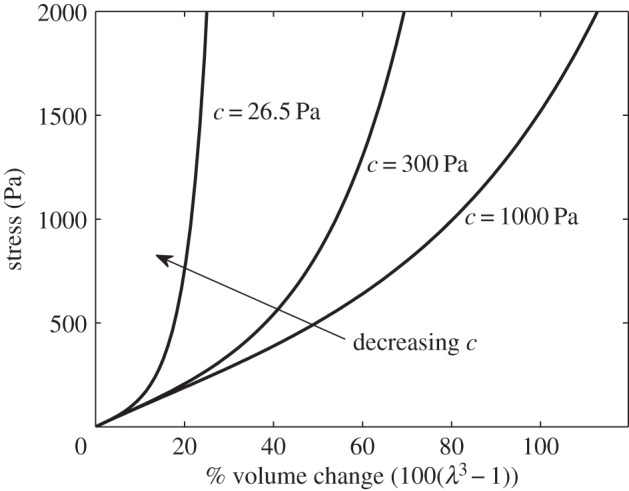
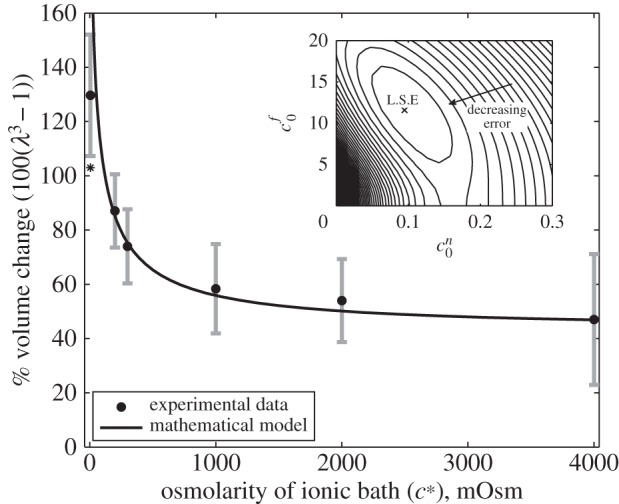
and  = 0.09 mOsm. Figure 4 shows the experimental data and solutions of equation (4.2) for these values. As discussed in §2.3, we neglect the data point corresponding to the 6 mOsm solution when performing the least-squares fit (because it is uncertain whether the model parameters are relevant to such concentrated bathing solutions). However, we include this data point in the plot to show that the mathematical model and experimental data still agree qualitatively.
Figure 4.
The solid curve shows solutions to (4.2) for the values of FCD and non-permeating solute concentrations ( and
and  , respectively) that minimize the mean squared error (see inset). Black circles show experimental data from [9], where the error bars signify the minimum and maximum expected range based upon the standard error of the mean. The bulk modulus is K = 380 Pa for all of these computations. Asterisk (*) denotes the data point for the 6 mOsm solution bath is excluded from the fitting, see text. Inset: contours showing the mean squared error of solutions across a range of FCD cf0 and fixed osmole
  concentrations, compared to the experimental data shown in the main figure. Values which correspond to the least-squared error (L.S.E) are
  and
and  = 0.09 mOsm.
The inset of figure 4 shows contours for the least-squares error of solutions to equation (4.2), compared to the experimental data as a function of the reference state FCD  and fixed osmole concentration
  . Figure 4 shows that the model is able to provide a good fit for the experimental data for bathing solution concentrations in the 100–4000 mOsm range.
5. Discussion
We have used a triphasic model to investigate swelling of brain tissue slices. The triphasic model is appropriate for modelling tissue swelling since it couples the effects of ion concentration and fluid pressure with elastic deformation of the tissue, allowing osmotic effects to drive tissue swelling. We have proposed an extension to the existing model [12] by including a further non-permeating solute species, which directly exerts an osmotic pressure on the tissue [41].
It has been proposed that exposure of intracellular FCD (leading to the Donnan effect) provides the physical driving force for swelling of brain tissue slices [9]. However, we have shown that within physiological parameter values the Donnan effect alone is insufficient to explain the magnitude of swelling observed experimentally (volume increases of 74% in isotonic solution). One possible explanation is that the elastic properties of the tissue are altered when the tissue is damaged. However, the bulk modulus of the tissue would have to decrease to only 30 Pa for the Donnan effect to explain the magnitude of swelling in isotonic solution. Such a large effect is not supported by the experimental literature and, if anything, the modulus has been reported to increase. Furthermore, this reduction in bulk modulus gives a poor fit for the subsequent experimental data across a range of bathing solution concentrations.
We propose that the swelling of brain tissue slices is caused by an increase in osmotic pressure due to two types of species: ions trapped in the tissue due to the FCD, and solutes unable to permeate through the tissue due to mechanical obstructions. Tissue swelling caused by non-permeating solutes alone is independent of the ionic concentration of the solution bath. It is the presence of the FCD that causes the ionic concentration of the bathing solution to affect the tissue volume, since the charged FCD interacts with ions to maintain electroneutrality. The presence of FCD explains why the slice volume depends upon the bathing solution concentration, while the presence of the non-permeating solutes explains why the tissue is swollen even in bathing concentrations of 4000 mOsm, where the presence of FCD results in minimal swelling. A least-squares fit gave the reference state FCD as  and the reference state fixed osmole concentration as
  = 0.09 mOsm.
A reference state FCD of  is greater than the reference state FCD of
  measured experimentally by assaying the GAG content of damaged brain tissue [9]. However, the authors acknowledged that other macromolecules that were not tested for (such as DNA [43]) may also contribute to the FCD, and therefore it is reasonable to expect the FCD to be greater than that measured in this experiment. In articular cartilage, FCD has been measured in the range 10–30 mEq l−1 [44] which is comparable in magnitude to the FCD we hypothesize in damaged brain tissue on the basis of Elkin's data.
Kawamata et al. [14] measured a 91.5 mOsm increase in osmolarity due to solutes in the core oedemic region of in vivo rat brains. Our fit to the experimental data required a non-permeating solute concentration of only  = 0.09 mOsm. This large difference may occur because the majority of osmotically active molecules produced within the tissue are small enough to diffuse out of the tissue slice and equilibrate in concentration with the solution bath. Only those trapped within the tissue will contribute to the osmotic pressure difference.
The triphasic model has been validated experimentally for cartilage [34]. Soft tissues such as the brain are structurally very different from cartilage, and as the proteoglycan concentration is much lower than cartilage it is not clear whether the tissue contains sufficient negative charges to have a non-negligible FCD. Our work agrees with the hypothesis of Elkin et al. [9] that damaged brain tissue contains sufficient FCD to act as a triphasic material. However, we propose that a further term must be considered, to represent the osmotic pressure caused by electrically neutral non-permeating solutes which themselves directly exert an osmotic pressure. These molecules may be released from the intracellular compartment, or produced due to abnormal cellular metabolism, when the tissue is damaged. As cartilage has a low cell density in comparison to other soft tissues, this term is not relevant in the original triphasic model.
Although we have shown that the volumetric response of damaged brain slices to changes in ionic bathing solution are consistent with the Donnan effect being present, to the best of our knowledge, this effect has not been discussed in the literature with regard to in vivo swelling. In vivo an exposed FCD would prevent the free movement of ions, which may have consequences for the formation and resolution of oedema. Similarly, an accumulation of non-permeating solutes could prolong oedema if they cannot be cleared from the tissue. When tissue damage occurs in the in vivo brain, these effects may well be difficult to isolate due to other osmotic effects, and it is only by careful slice experiments that this behaviour can be isolated and further understood.
References
- 1.Simard JM, Kent TA, Chen M, Tarasov KV, Gerzanich V. 2007. Brain oedema in focal ischaemia: molecular pathophysiology and theoretical implications. Lancet Neurol. 6, 258–268. ( 10.1016/S1474-4422(07)70055-8) [DOI] [PMC free article] [PubMed] [Google Scholar]
- 2.Walberer M, et al. 2008. Aggravation of infarct formation by brain swelling in a large territorial stroke: a target for neuroprotection? J. Neurosurg. 1090, 287–293. ( 10.3171/JNS/2008/109/8/0287) [DOI] [PubMed] [Google Scholar]
- 3.Raslan A, Bhardwaj A. 2007. Medical management of cerebral edema. Neurosurg. Focus 220, 1–12. ( 10.3171/foc.2007.22.5.13) [DOI] [PubMed] [Google Scholar]
- 4.Thiex R, Tsirka SE. 2007. Brain edema after intracerebral hemorrhage: mechanisms, treatment options, management strategies, and operative indications. Neurosurg. Focus 220, 1–7. ( 10.3171/foc.2007.22.5.7) [DOI] [PubMed] [Google Scholar]
- 5.Fishman RA. 1975. Brain edema. N. Engl. J. Med. 2930, 706–711. ( 10.1056/NEJM197510022931407) [DOI] [PubMed] [Google Scholar]
- 6.Marmarou A. 2007. A review of progress in understanding the pathophysiology and treatment of brain edema. Neurosurg. Focus 22, 1–10. ( 10.3171/foc.2007.22.5.2) [DOI] [PubMed] [Google Scholar]
- 7.Klatzo I. 1987. Pathophysiological aspects of brain edema. Acta Neuropathol. 72, 236–239. ( 10.1007/BF00691095) [DOI] [PubMed] [Google Scholar]
- 8.Cho S, Wood A, Bowlby MR. 2007. Brain slices as models for neurodegenerative disease and screening platforms to identify novel therapeutics. Curr. Neuropharmacol. 50, 19–33. ( 10.2174/157015907780077105) [DOI] [PMC free article] [PubMed] [Google Scholar]
- 9.Elkin BS, Shaik MA, Morrison B., III 2010. Fixed negative charge and the Donnan effect: a description of the driving forces associated with brain tissue swelling and edema. Phil. Trans. R. Soc. A 368, 585–603. ( 10.1098/rsta.2009.0223) [DOI] [PMC free article] [PubMed] [Google Scholar]
- 10.Hrabĕtová S, Chen KC, Masri D, Nicholson C. 2002. Water compartmentalization and spread of ischemic injury in thick-slice ischemia model. J. Cereb. Blood Flow Metab. 22, 80–88. ( 10.1097/00004647-200201000-00010) [DOI] [PubMed] [Google Scholar]
- 11.Pappius HM, Elliott KAC. 1956. Water distribution in incubated slices of brain and other tissues. Can. J. Biochem. Physiol. 340, 1007–1022. ( 10.1139/o56-106) [DOI] [PubMed] [Google Scholar]
- 12.Lai WM, Hou JS, Mow VC. 1991. A triphasic theory for the swelling and deformation behaviors of articular cartilage. J. Biomech. Eng. 113, 245–258. ( 10.1115/1.2894880) [DOI] [PubMed] [Google Scholar]
- 13.Leaf A. 1959. Maintenance of concentration gradients and regulation of cell volume. Ann. N. Y. Acad. Sci. 720, 396–404. ( 10.1111/j.1749-6632.1959.tb44168.x) [DOI] [PubMed] [Google Scholar]
- 14.Kawamata T, Mori T, Sato S, Katayama Y. 2007. Tissue hyperosmolality and brain edema in cerebral contusion. Neurosurg. Focus 220, 1–8. ( 10.3171/foc.2007.22.5.6) [DOI] [PubMed] [Google Scholar]
- 15.Franceschini G, Bigoni D, Regitnig P, Holzapfel GA. 2006. Brain tissue deforms similarly to filled elastomers and follows consolidation theory. J. Mech. Phys. Solids 540, 2592–2620. ( 10.1016/j.jmps.2006.05.004) [DOI] [Google Scholar]
- 16.Miller K, Chinzei K. 2002. Mechanical properties of brain tissue in tension. J. Biomech. 350, 483–490. ( 10.1016/S0021-9290(01)00234-2) [DOI] [PubMed] [Google Scholar]
- 17.Rashid B, Destrade M, Gilchrist MD. 2012. Mechanical characterization of brain tissue in compression at dynamic strain rates. J. Mech. Behav. Biomed. 100, 23–38. ( 10.1016/j.jmbbm.2012.01.022) [DOI] [PubMed] [Google Scholar]
- 18.Taylor Z, Miller K. 2004. Reassessment of brain elasticity for analysis of biomechanisms of hydrocephalus. J. Biomech. 370, 1263–1269. ( 10.1016/j.jbiomech.2003.11.027) [DOI] [PubMed] [Google Scholar]
- 19.Miller K. 1999. Constitutive model of brain tissue suitable for finite element analysis of surgical procedures. J. Biomech. 320, 531–537. ( 10.1016/S0021-9290(99)00010-X) [DOI] [PubMed] [Google Scholar]
- 20.Kyriacou SK, Mohamed A, Miller K, Neff S. 2002. Brain mechanics for neurosurgery: modeling issues. Biomech. Model. Mechanobiol. 10, 151–164. ( 10.1007/s10237-002-0013-0) [DOI] [PubMed] [Google Scholar]
- 21.Zhang L, Yang KH, King AI. 1260. A proposed injury threshold for mild traumatic brain injury. J. Biomech. Eng. 1260, 226–236. ( 10.1115/1.1691446) [DOI] [PubMed] [Google Scholar]
- 22.Levine DN. 1999. The pathogenesis of normal pressure hydrocephalus: a theoretical analysis. Bull. Math. Biol. 610, 875–916. ( 10.1006/bulm.1999.0116) [DOI] [PubMed] [Google Scholar]
- 23.Smillie A, Sobey I, Molnar Z. 2005. A hydroelastic model of hydrocephalus. J. Fluid Mech. 539, 417–443. ( 10.1017/S0022112005005707) [DOI] [Google Scholar]
- 24.Nagashima T, Shirakuni T, Rapoport SI. 1990. A two-dimensional, finite element analysis of vasogenic brain edema. Neurol. Med. Chir. 30, 1–9. ( 10.2176/nmc.30.1) [DOI] [PubMed] [Google Scholar]
- 25.Drapaca CS, Fritz JS. 2012. A mechano-electrochemical model of brain neuro-mechanics: application to normal pressure hydrocephalus. Int. J. Num. Anal. Mod. Ser. B 1, 82–93. [Google Scholar]
- 26.Gentili C, Cancedda R. 2009. Cartilage and bone extracellular matrix. Curr. Pharm. Des. 150, 1334–1348. ( 10.2174/138161209787846739) [DOI] [PubMed] [Google Scholar]
- 27.Sun DN, Gu WY, Guo XE, Lai WM, Mow VC. 1999. A mixed finite element formulation of triphasic mechano-electrochemical theory for charged, hydrated biological soft tissues. Int. J. Numer. Method Eng. 45, 1375–1402. () [DOI] [Google Scholar]
- 28.Cheng S, Bilston LE. 2007. Unconfined compression of white matter. J. Biomech. 400, 117–124. ( 10.1016/j.jbiomech.2005.11.004) [DOI] [PubMed] [Google Scholar]
- 29.Cowin SC, Doty SB. 2009. Tissue mechanics. Berlin, Germany: Springer. [Google Scholar]
- 30.Huyghe JMRJ, Janssen JD. 1997. Quadriphasic mechanics of swelling incompressible porous media. Int. J. Eng. Sci. 35, 793–802. ( 10.1016/S0020-7225(96)00119-X) [DOI] [Google Scholar]
- 31.Ogden RW. 1997. Non linear elasic deformations. New York, NY: Dover. [Google Scholar]
- 32.García JJ, Smith JH. 2010. A biphasic hyperelastic model for hydrocephalus. Lat. Am. Appl. Res. 40, 295–302. [Google Scholar]
- 33.Fung YC. 1984. Structure and stress–strain relationship of soft tissues. Am. Zool. 240, 13–22. ( 10.1093/icb/24.1.13) [DOI] [Google Scholar]
- 34.Frijns AJH, Huyghe JM, Janssen JD. 1997. A validation of the quadriphasic mixture theory for intervertebral disc tissue. Int. J. Eng. Sci. 350, 1419–1429. ( 10.1016/S0020-7225(97)00047-5) [DOI] [Google Scholar]
- 35.Holzapfel GA, Gasser TC, Ogden RW. 2000. A new constitutive framework for arterial wall mechanics and a comparative study of material models. J. Elasticity 61, 1–48. ( 10.1023/A:1010835316564) [DOI] [Google Scholar]
- 36.Atkins P. 2006. Physical chemistry, 8th edn Oxford, UK: Oxford University Press. [Google Scholar]
- 37.Reulen HJ, Graham R, Spatz M, Klatzo I. 1977. Role of pressure gradients and bulk flow in dynamics of vasogenic brain edema. J. Neurosurg. 460, 24–35. ( 10.3171/jns.1977.46.1.0024) [DOI] [PubMed] [Google Scholar]
- 38.Bilston LE. 2011. Brain tissue mechanical properties. In Biomechanics of the brain (ed. Miller K.), pp. 69–89. New York, NY: Springer. [Google Scholar]
- 39.Rashid B, Destrade M, Gilchrist MD. 2013. Influence of preservation temperature on the measured mechanical properties of brain tissue. J. Biomech. 460, 1276–1281. ( 10.1016/j.jbiomech.2013.02.014) [DOI] [PubMed] [Google Scholar]
- 40.Metz H, McElhaney J, Ommaya AK. 1970. A comparison of the elasticity of live, dead, and fixed brain tissue. J. Biomech. 30, 453–458. ( 10.1016/0021-9290(70)90017-5) [DOI] [PubMed] [Google Scholar]
- 41.Ateshian GA, Likhitpanichkul M, Hung CT. 2006. A mixture theory analysis for passive transport in osmotic loading of cells. J. Biomech. 390, 464–475. ( 10.1016/j.jbiomech.2004.12.013) [DOI] [PMC free article] [PubMed] [Google Scholar]
- 42.Donnan FG. 1924. The theory of membrane equilibria. Chem. Rev. 10, 73–90. ( 10.1021/cr60001a003) [DOI] [Google Scholar]
- 43.Elkin BS, Shaik MA, Morrison B., III 2011. Chondroitinase ABC reduces brain tissue swelling in vitro. J. Neurotrauma. 280, 2277–2285. ( 10.1089/neu.2010.1603) [DOI] [PubMed] [Google Scholar]
- 44.Lu X, Mow VC. 2008. Biomechanics of articular cartilage and determination of material properties. Med. Sci. Sports Exerc. 40, 193–199. ( 10.1249/mss.0b013e31815cb1fc) [DOI] [PubMed] [Google Scholar]