Abstract
Diatoms are non-motile, unicellular phytoplankton that have the ability to form colonies in the form of chains. Depending upon the species of diatoms and the linking structures that hold the cells together, these chains can be quite stiff or very flexible. Recently, the bending rigidities of some species of diatom chains have been quantified. In an effort to understand the role of flexibility in nutrient uptake and aggregate formation, we begin by developing a three-dimensional model of the coupled elastic–hydrodynamic system of a diatom chain moving in an incompressible fluid. We find that simple beam theory does a good job of describing diatom chain deformation in a parabolic flow when its ends are tethered, but does not tell the whole story of chain deformations when they are subjected to compressive stresses in shear. While motivated by the fluid dynamics of diatom chains, our computational model of semiflexible fibres illustrates features that apply widely to other systems. The use of an adaptive immersed boundary framework allows us to capture complicated buckling and recovery dynamics of long, semiflexible fibres in shear.
Keywords: biofluid dynamics, fluid–structure interactions, diatom chains, flexible fibres
1. Introduction
Flexible, elastic fibres that either move around in a fluid or move a fluid around are ubiquitous in nature and biology. In mammals, cilia are excellent examples of actuated elastic fibres that are responsible for mucus clearance in the respiratory tract and promote ovum transport in the oviduct [1]. Biological polymers such as DNA and actin filaments or synthetic polymers such as nylon are examples of passive elastic fibres that may bend or buckle in a moving fluid [2–5]. In order to predict the dynamics of a semiflexible fibre moving in a viscous, incompressible fluid, its mechanical properties must be known.
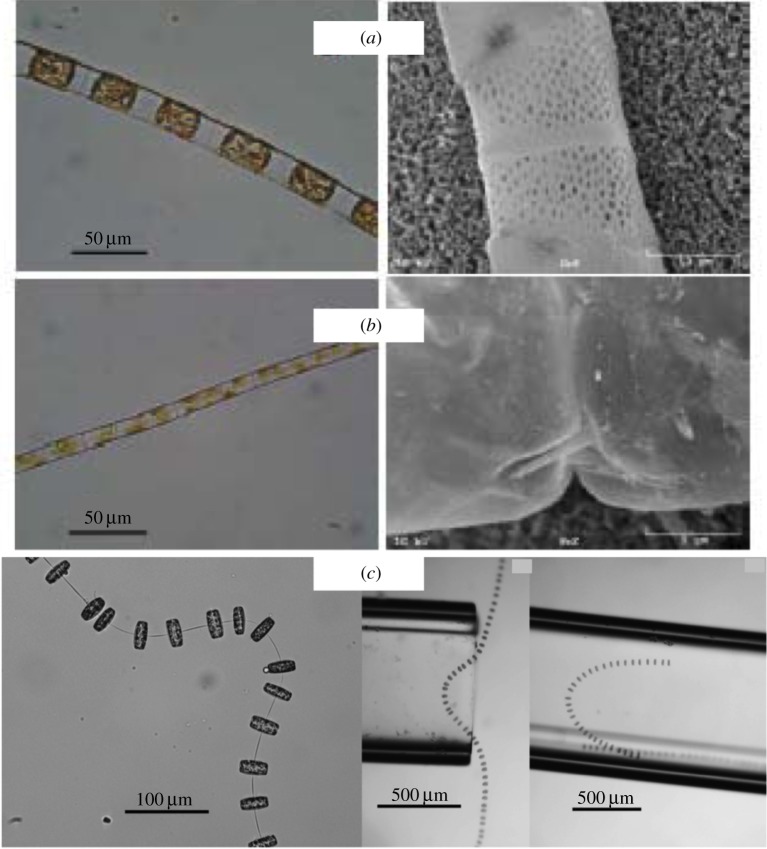
Here, we focus on the intriguing flexible fibres that are formed by some types of diatoms, non-motile phytoplankton. Phytoplankton account for approximately 40% of the primary marine production as well as one-fourth of the oxygen production on the Earth. The local flow environment around phytoplankton affects processes such as nutrient uptake and predator–prey interactions [6,7]. While diatoms are unicellular, some types have evolved the ability to form colonies in the form of chains using a variety of linking structures that hold the cells together (figure 1) [8]. Figure 1a,b shows micrographs of Lithodesmium undulatum and Guinardia delicatula. While these chains appear to be fairly stiff, figure 1c shows images of Thalassiosira sp., which appear to be much more flexible. Does flexibility enhance or hinder nutrient transport and acquisition by diatom chains in a dynamic flow environment? This question was addressed by Musielak et al. [9] using a computational fluid dynamic model in two dimensions. It was found that stiffer chains enjoy enhanced nutrient uptake in a patchy environment, perhaps because they bend less and sweep out a larger volume of fluid than more flexible chains. The correspondence between the mechanical properties of the model diatom chains in [9] and real diatom chains could not be directly assessed because, at that time, no laboratory measurements of bending rigidity or flexural stiffness of diatom chains were available. However, recently, Young et al. [8] performed experiments that quantified the flexural stiffness of different types of diatom chains by measuring their deflections under flow when held across a capillary tip. A simple beam theory was applied to approximate the flexural stiffness given the measured deflections and imposed volumetric flow rate. Here, we describe the calibration of these laboratory experiments [8] with the development of a full three-dimensional computational model of an inhomogeneous elastic chain. Having verified that the computational elastic structure has captured elastic properties of true diatom chains, we examine the dynamics of these chains in shear flow.
Figure 1.
Light (left) and scanning electron (right) micrographs of (a) L. undulatum and (b) G. delicatula, courtesy of A. Young and L. Karp-Boss, University of Maine. (c) Images of Thalassiosira sp. adapted from [8]. (Online version in colour.)
While motivated by the fluid dynamics of diatom chains, our three-dimensional computational model of semiflexible fibres illustrates features that apply widely to other systems. Namely, we show that using a three-dimensional adaptive immersed boundary framework [10] allows us to capture complicated buckling and recovery of long, flexible fibres in shear flow. Moreover, we argue that the dynamics of complex elastic fibres cannot always be predicted by assuming that they are homogeneous, linear beams. In the following sections, we will describe the structure of the computational diatom chain and the computational experiments that were performed to mirror the laboratory experiments in [8]. We will then examine how the orbits of these semiflexible fibres in shear flow depend upon their elastic properties and the connectivity properties of the network of points and springs that build them.
2. Calibration of experiments and computations
2.1. Construction of elastic diatom chain
Motivated by the structure of L. undulatum (figure 1a), we construct an elastic model of a diatom chain by creating a network of nodes and springs. The nodes are placed regularly on the surface of the cylindrical fibre, equally spaced around cross sections that are orthogonal to the centreline of the cylinder. We will consider three types of structures based upon the specified connectivity of the nodes. In the surface-spring type, we specify that linear springs connect closest points on the surface to each other and to next-to-closest points on the surface. The full-spring type not only has linear springs connecting nodes on the surface as in the surface-spring type but also has additional nodes placed along the centreline that are connected by internal springs to the surface nodes on the corresponding cross section (spokes). The diatom-chain type comprises an alternating sequence of each of the previous types, with the full-spring structure modelling the valve or cellular part of a single diatom and the surface-spring structure modelling the cell-connection between two diatoms in the chain. Figure 2 shows a schematic of the node-connectivity that builds the diatom chain. Figure 3 shows the long fibre that is the computational diatom chain, with the ‘zoomed-in’ portion showing the connectivity structure of two adjacent diatoms.
Figure 2.
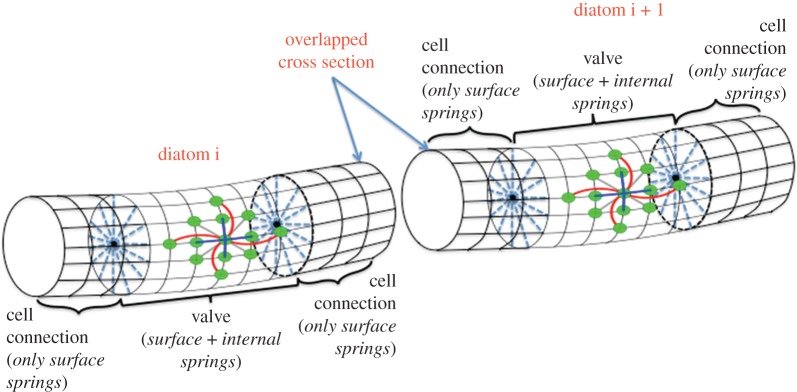
A schematic that shows the node–spring connectivity structure that is used to build a model diatom chain. (Online version in colour.)
Figure 3.
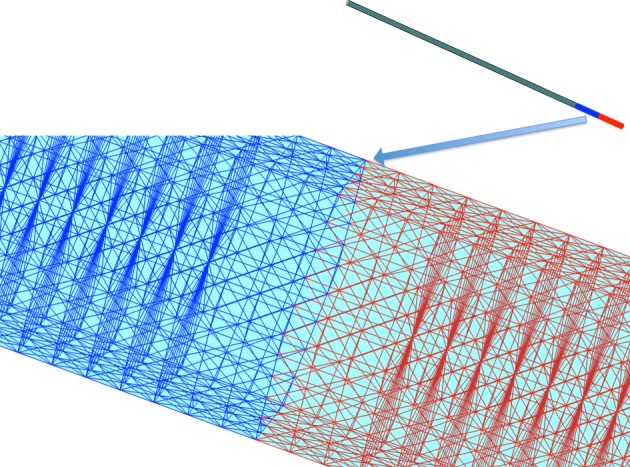
The computational diatom chain structure. The zoomed-in portion shows the alternating valve and cell structures. The valve structures that connect the diatom cells do not have internal spokes. (Online version in colour.)
Assume that xk and xl are two nodes of the diatom chain that are connected by a linkage or spring of rest length Δskl. The force at xk due to this spring is
| 2.1 |
There is an equal and opposite force due to this spring at the node xl. Here, τkl (kg s−2) is the stiffness constant of the linear spring and Δskl (m) is its resting length. This resting length is taken to be the distance between the nodes xl and xk when the fibre is initialized as the straight cylinder shown in figure 3. The total elastic energy E (kg m2 s−2) in this node–spring system is given by
| 2.2 |
where N is the total number of nodes. Note that E = 0 when the model diatom chain is in its straight, equilibrium configuration.
For prescribed stiffness constants τkl, we can estimate the macroscopic bending modulus of the model diatom chain using the non-hydrodynamic approach outlined by Lim & Peskin [11]. The cylindrical structure is bent at a constant curvature β and the total potential energy E stored in all of the springs is calculated using equation (2.2). Assuming that the node–spring structure approximates a homogeneous elastic beam, the stored energy in the bent structure is related to curvature by
| 2.3 |
where L is the length of the chain and  is its flexural stiffness or bending rigidity. Here,
  is the Young's modulus and I is the chain's second moment of area. Note that A has units of N m2; and a quadratic relationship between the total energy E and β is noted. A least-squares fit is used to determine the macroscopic bending rigidity A.
Alternatively, one may use the above procedure to determine spring stiffness constants τkl that will result in a prescribed macroscopic bending rigidity A. This is the approach that we will take in building the computational fibres to match the bending rigidities measured for diatom chains in [8]. For simplicity, in the model diatom chains discussed herein, we choose the same spring stiffness τkl = S0 for each of the linkages in the structure.
In order to further characterize the material properties of these computational fibres, we pinned one end of the fibre down and imposed a series of fixed strains to the fibre by extending the other end and fixing it so that the extended fibre was up to twice its equilibrium length. We then found the minimum energy configuration of the spring–node structure in the strained configuration. We found that the energy in the strained systems was a quadratic function of the strain. Therefore, the overall structures are neither strain-hardening nor strain-softening, but Hookean, like the individual spring elements that comprise them.
2.2. Estimating flexural rigidity of diatom chains
Young et al. [8] discuss their procedure to calculate flexural rigidities of four distinct types of chain-forming diatoms. The overall strategy was to measure the bending of the chains in response to an applied force. Individual diatom chains were suspended across the rim of a hollow glass capillary tube submerged in a seawater-filled Petri dish. Chains were then exposed to a constant hydrodynamic force that bent the chain into the tube (figure 4a). The volumetric flow rate of the imposed flow was measurable, along with the chain dimensions and the resulting chain deflection. Assuming that the diatom chains in these experiments are governed by small-deflection beam theory, the flexural stiffness (bending rigidity) may be calculated as [12]
| 2.4 |
where f is the force per unit length at the point of maximum deflection of the chain, y is the maximum deflection of the chain and L is the length of the straight chain. In order to directly apply equation (2.4), an estimate of the force f was needed. Young et al. [8] used the relationship,
| 2.5 |
that relates the drag force on a cylindrical fibre to its radius r, the velocity at the point of maximum deflection u, the density of the seawater ρ and a drag coefficient Cd. This drag coefficient Cd was estimated using an empirical formula based upon the Reynolds number of the flow. We refer the reader to [8] for details. In order to validate this procedure, the flexural stiffness for nylon was also estimated and it compared favourably with previously reported values. Table 1 shows the estimated flexural stiffnesses calculated in a subset of the experiments reported in [8] and provided to us by Young and Karp-Boss during the course of these experiments. Note that the range of measured flexural stiffnesses for different chain types varies over four orders of magnitude. The stiffest diatom chain, L. undulatum, has tightly fused, silica-based connections, whereas G. delicatula, the most flexible diatom chain measured has a single silica spine connection. Moreover, some types such as Thalassiosira sp. were too flexible for the experimental procedure to yield an estimate of the bending rigidity (figure 1c).
Figure 4.
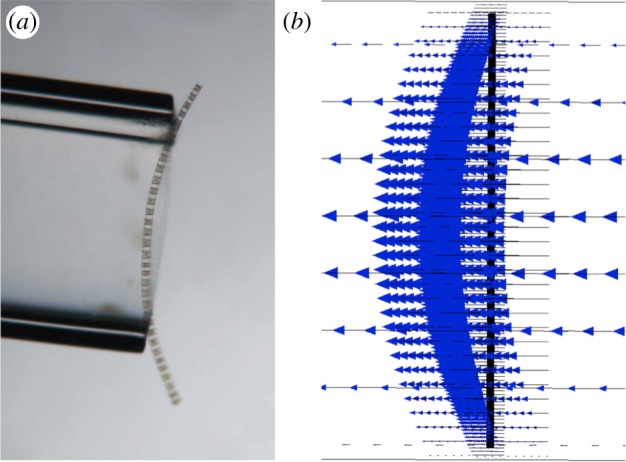
(a) A chain of G. delicatula placed across the rim of the capillary tube (courtesy of A. Young and L. Karp-Boss, University of Maine). (b) A computational chain placed in a channel subject to an imposed flow. (Online version in colour.)
Table 1.
Chain diameters and average flexural stiffnesses of different diatom chain types measured by A. Young and L. Karp-Boss at the University of Maine (2011, personal communication). These data come from a subset of those experiments reported in [8]. The third column shows the associated stiffness constants used for the springs of the computational diatom chain so that the bend modulus of the model computed using equation (2.3) matches column 2.
| diatom chain type | chain diam. (m) | flex stiff (N m2) | stiff constant (N m−1) |
|---|---|---|---|
| L. undulatum | 3.24 × 10⁻⁵ | 1.93 × 10⁻¹³ | 6.00 |
| S. turris | 2.37 × 10⁻⁵ | 1.23 × 10⁻¹³ | 7.00 |
| L. annulata | 3.08 × 10⁻⁵ | 6.30 × 10⁻¹⁵ | 2.44 × 10⁻¹ |
| G. delicatula | 1.547 × 10⁻⁵ | 5.73 × 10⁻¹⁷ | 7.44 × 10⁻³ |
Table 1 also shows spring stiffnesses chosen for the model diatom chain so that it's bending rigidity based upon computing the total energy in a bent configuration (equation (2.3)) matches the measured bending rigidity. For instance, consider a model of a L. undulatum chain that comprised 12 diatoms, with each valve of length 60 µm, and a cell-connection portion of 7.2 µm at each end, for a total length of 0.9 mm. This is discretized using 504 cross sections, with 30 nodes around each hexagonal cross section, and one node along the centreline. The portion of this diatom chain that corresponds to the valve has springs connecting the centreline to the surface. By choosing the spring constant S0 = 6.00 N m−1, we assert that the overall bending rigidity of the model diatom chain comprised these 12 diatoms and discretized as stated is A = 1.93 × 10⁻¹³ N m2.
2.3. Coupling of elastic diatom chain with fluid
We choose an immersed boundary framework to model the interaction of the diatom chain with a viscous, incompressible fluid [13,14]. The system is governed by the three-dimensional Navier–Stokes equations
| 2.6 |
| 2.7 |
 |
2.8 |
 |
2.9 |
where ρ is the fluid density, u is the fluid velocity, Xj denotes the Lagrangian coordinates of the jth longitudinal filament Γj comprising the cylindrical diatom chain (either along its surface or its centreline), p denotes pressure, μ is the dynamic viscosity and Ω denotes the fluid domain. Note that the forces fj defined on the filaments Γj are precisely sums of the spring forces in equation (2.1). The Eulerian elastic force density F on the fluid is a Dirac delta-function layer of force that is supported at the material points of the neutrally buoyant diatom chain. Away from these points, the force of the fibre on the fluid is zero.
Traditionally, the immersed boundary method uses a Cartesian background grid to keep track of Eulerian fluid quantities such as velocity and pressure, whereas the material points of the immersed structure are treated in a Lagrangian manner. Grid-based, discretized versions of the Dirac delta function are used to communicate force on the immersed structure to the background grid and to interpolate fluid velocities on the grid to the immersed structure [14]. Here, we use an adaptive and parallel implementation of the immersed boundary method, IBAMR (Griffith et al. [10]), that dynamically refines the Cartesian mesh to its finest level around the immersed structure as it moves throughout the fluid domain. Adaptivity allows the use of a large computational domain Ω, because a coarse mesh may be used away from the immersed boundary, while details of the fluid–structure interaction near the immersed boundary are captured by a fine mesh. In particular, a cell-centred, second-order projection method on a hierarchical structured grid is used to solve the incompressible Navier–Stokes equations. The viscous terms are treated implicitly, and a second-order Godunov method for the explicit treatment of the advective term is employed. A second-order Runge–Kutta method is used to update the system in time (see [10] for implementation details).
To simulate the experiments done in the laboratory, we immerse the diatom chain models in a background parabolic flow (figure 4b). We set ρ = 103 kg m−3 and μ = 10−3 Pa s. Note that the spring stiffnesses were chosen as in table 1 to give an overall bending rigidity that was measured for each diatom chain type. Cross-sectional diameters of the chains were calibrated for each of the types, but the same overall connectivity structures as shown in figure 3 were used in each case. Tethering forces to keep the cross sections at the ends of the chains fixed near the no-slip boundary were used. In addition, the parameters for the parabolic flow were chosen to match the volumetric flow rates as in the laboratory set-up. The diatom chain, whose equilibrium configuration is a straight cylinder, is initially placed vertically, but is bent by the imposed parabolic flow. Soon the coupled fluid-chain system reaches a steady state. As in the laboratory experiments, we are able to measure the maximum displacement of the chain. However, unlike the laboratory experiments, we can directly measure (rather than estimate) the drag force at the point of maximum displacement. The maximum displacement and the drag force based upon laboratory experiments are shown in table 2 along with the corresponding computational measurements of both.
Table 2.
Maximum deflection and drag measured by the laboratory experiments of A. Young and L. Karp-Boss at the University of Maine (2011, personal communication). These data come from a subset of those experiments reported in [8]. Also shown are corresponding maximum deflection and drag force resulting from our coupled three-dimensional fluid/fibre model.
| species | (lab) max. defl. (m) | (comp) max. defl. (m) | (lab) drag (N m−1) | (comp) drag (N m−1) |
|---|---|---|---|---|
| Lithodesmium | 4.0 × 10⁻⁵ | 1.3 × 10⁻⁵ | 8.8 × 10⁻⁵ | 3.8 × 10⁻⁵ |
| S. turris | 4.4 × 10⁻⁵ | 2.8 × 10⁻⁵ | 1.8 × 10⁻⁴ | 7.4 × 10⁻⁵ |
| L. annulata | 6.4 × 10⁻⁵ | 5.4 × 10⁻⁵ | 4.2 × 10⁻⁵ | 1.9 × 10⁻⁵ |
| Guinardia | 6.2 × 10⁻⁵ | 2.9 × 10⁻⁵ | 6.4 × 10⁻⁸ | 8.5 × 10⁻⁸ |
Here, we see that the computational measurements of maximum displacement and drag force agree with those estimated using laboratory experiments to well within an order of magnitude for all diatom chain types. While neither the true diatom chains nor the spring–node computational models of the diatom chain are homogeneous beams, the use of small-deflection beam theory allows us to quantify an effective macroscopic bending rigidity of the chain.
Similar computational experiments were performed for model chains that were made up of only surface-spring connections and full-spring connections. When compared to the more heterogeneous diatom chain model, one would guess that the surface-spring chain model obtained by removing all of the spoke connections in the valve portions would result in a structure with a smaller macroscopic bending rigidity. Similarly, a full-spring chain model obtained by adding spoke connections at every cross section would presumably have a larger macroscopic bending rigidity. In fact, this is the case. For instance, for a model of G. delicatula of length 0.9 mm and bending rigidity A = 5.73 × 10⁻¹⁷ N m2, the corresponding surface-spring structure has a bending rigidity of A = 5.65 × 10⁻¹⁷ N m2, and the corresponding full-spring structure has a bending rigidity of A = 5.89 × 10⁻¹⁷ N m2. When these three structures were subjected to the imposed parabolic flow, their maximum deflections and drag forces at the point of maximum deflection were basically identical. By contrast, we will see below that these three structures do not behave similarly when subjected to a shear flow, where compressive stresses give rise to buckling behaviour.
3. Semiflexible fibres in shear flow
The seminal assessment of Munk & Riley [15] indicates that when the size of phytoplankton is more than 10 or so micrometres, ambient fluid motion can enhance fluxes of solutes to or from cells. Lazier & Mann [16] have also suggested that because phytoplankton are typically smaller than the Kolmogorov length scale in the ocean, phytoplankton experience turbulence as a linear shear. For this reason, the fluid dynamics of diatom chains driven by linear shear flows is important to the study of nutrient delivery to phytoplankton. While recent work suggests that more complex background flows around phytoplankton, such as dissipative vortices, should be considered [17]; here, we focus on the behaviour of diatom chains in shear flow. In a steady shear flow, chains tend to align with their long axis parallel to the flow and tumble periodically [18]. These orbits are reminiscent of the rotational orbits of an ellipsoid in shear, whose analysis appears in the classic work of Jeffery [19]. Jeffery showed that the rotational period T of a spheroid in Stokes flow with an imposed shear rate κ was a function of the spheroid's aspect ratio ar (major axis/minor axis)
| 3.1 |
Karp-Boss & Jumars [18] studied the motion of two types of chain-forming diatoms, Skeletonema costatum and Thalassiosira, and compared the observed rotational periods to that predicted by Jeffery's theory for a spheroid of the same aspect ratio. They observed that rotational periods of the elongated chains fell well below those predicted by the theory for the corresponding spheroid and that the more flexible chains typically rotated faster than more rigid ones of the same aspect ratio.
The study of semiflexible fibres in shear flows certainly predates the above-mentioned investigation of diatom chains in shear. For instance, the classical work of Forgacs & Mason [4] characterized the qualitative shape deformations of flexible fibres in shear by tracking the orbits of pulp, Dacron and elastomer fibres. Springy rotations, snake rotations and coil formations were observed for fibres of different lengths. As in the diatom chain experiments [18], more flexible fibres were found to have shorter rotational periods than stiffer fibres with the same aspect ratio. Forgacs and Mason also noted that for a given fluid viscosity and shear rate, a critical fibre length existed beyond which the threadlike particle bent. The deformation increased with the fibre length. In the past decades, this fibre buckling has been analysed using slender body hydrodynamics [20–22], bead models of the fibre that neglect hydrodynamic interaction of fibre segments [23] and computational models that couple the fluid equations with the fibre forces [24–26]. Below we will examine buckling in our fibre models, but first we will introduce the non-dimensional parameters that govern this elastic-hydrodynamic system.
3.1. Reynolds number and effective flow forcing
The Reyolds number that governs the dynamics of the cylindrical fibre in a background shear flow measures the relative importance of inertial forces to viscous forces. To define the Reynolds number, we use the fibre length L and the characteristic velocity κL, where κ is the shear rate (s−1)
| 3.2 |
The other governing dimensionless parameter measures the relative importance of fluid forces to elastic forces
| 3.3 |
This dimensionless parameter is referred to in [22] as the effective viscosity, but here we refer to  as the effective flow forcing. Here, A is the flexural stiffness or bending rigidity of the fibre. We can see the appearance of the non-dimensional bending rigidity when we consider the local slender body model of a filament in flow that gives a local relation between the velocity of the filament centreline and the force the filament exerts on the fluid
| 3.4 |
Here, x(s, t) is the position of the fibre's centreline, xs is the tangent vector to the centreline and c ≈ ln ε−1, where ε is the ratio of the filament's radius to its length. If equation (3.4) is non-dimensionalized using the filament's length L as a characteristic length, the velocity κL as a characteristic velocity and A/L3 as a characteristic force per unit length, the effective flow forcing emerges. Note that the effective flow forcing  that is felt by a fibre increases as the fluid viscosity increases, increases as the length of the fibre increases, increases as the shear rate increases, but decreases as it becomes stiffer (as its bending rigidity increases).
Typical shear rates experienced by phytoplankton in the ocean are estimated to be 0.01 s−1 ≤ κ ≤ 1 s−1 and typical lengths of diatom chains are estimated to be 0.25 mm ≤ L ≤ 4 mm [7]. For a fluid with the density and viscosity of seawater, and the types of diatom chains whose bending rigidities are shown in table 1, the resulting Reynolds numbers and effective flow forcing experienced are in the range
 |
3.5 |
The upperbound for effective flow forcing, for example, would be achieved by a G. delicatula that is 4 mm long, exposed to a shear rate of 1 s−1. It is possible that more flexible diatom chain types such as Thalassiosira sp., whose bending rigidity could not be measured using the aspiration technique in [8], experience effective flow forcings that are orders of magnitude more.
3.2. Diatoms in shear
We will now examine the results of numerical experiments where we subject our computational chains to a background shear flow. The connectivity of these chains will be either full-spring, surface-spring or that of the alternating diatom chain structure.
First, we will consider a diatom chain of non-dimensional length Lc = 1 whose structure is shown in figure 3. Here, Lc is the length of the entire chain, and, in this case, the chain comprised three connected diatom cells. The aspect ratio of the chain (length/diameter) is 14.43. The three-dimensional computational domain is a square box of dimensions MLc × MLc × MLc, where M = 67 in the following simulations. The background shear flow is achieved by specifying velocity boundary conditions at the upper and lower planes bounding the domain. Note that the use of an adaptive mesh allows us to use this large computational domain, while still resolving the fluid grid around the diatom chain. Here, we chose Reynolds number Re = 0.06 and an effective flow forcing of  = 1.15 × 10³. This effective flow forcing would correspond to a Lauderia annulata whose length is approximately 2.4 mm in a shear flow of κ = 1 s−1, or a G. delicatula whose length is approximately 1.27 mm in the same flow. We note that here we are computing at a Reynolds number somewhat smaller than that experienced by chains of these lengths, at the given shear, in seawater.
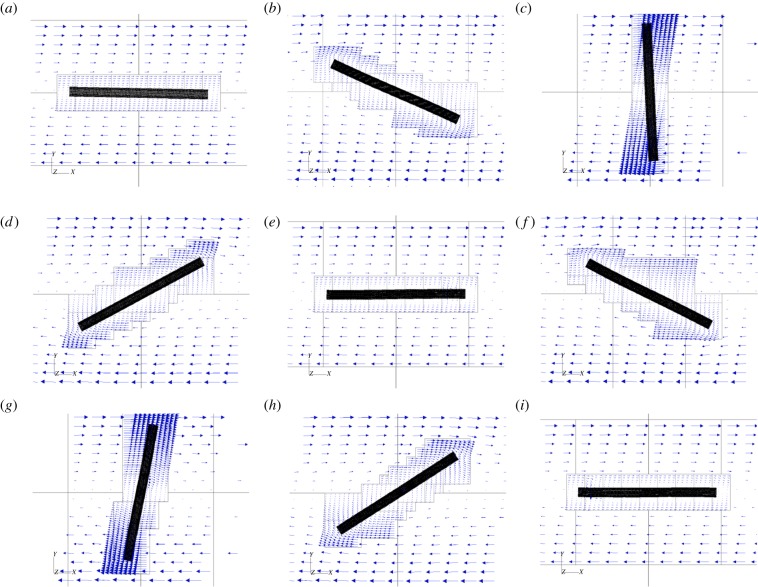
Figure 5 shows successive snapshots of this diatom chain as it goes through a complete orbit. Note that at time t* = 0 (upper left frame), the initial position is slightly perturbed from the horizontal. The imposed shear flow is evident by the velocity vectors depicted on the dynamic, adaptive mesh. The centreline of this mostly rigid fibre remains in a plane due to symmetry. Figure 6 tracks the evolution of the angle that the fibre makes with the horizontal as a function of the non-dimensional time t* = κt. As is typical of Jeffery orbits, the diatom chain spends most of its time aligned with the flow in a horizontal position, interspersed with quick flipping events. Using Jeffery's theory (equation (3.1)) for an ellipse of aspect ratio ar = 14.43, the approximate rotational period would be t* = 91.1. Using a slender body approximation, Cox [27] determined an effective aspect ratio  to be used in Jeffery's formula for a rigid slender cylinder of aspect ratio ar. This effective aspect ratio (
 = 10.95) would result in an approximate rotational period of t* = 69.38. Figure 6 shows that the rotational period of our computational fibre is approximately t* = 47. We note two main reasons for the difference between the computed rotational period and that predicted by the theory. Firstly, the aspect ratio of this diatom chain does not fall well within the range valid for slender body approximation. Recently, Zhang et al. [28] discussed the applicability of the slender body approximation [27] to fibres with smaller aspect ratios. Secondly, this fibre is not perfectly rigid. For thin, rod-like structures, the rotational period is dominated by the time that the rod stays in the horizontal position, aligned with the flow. For even a modest amount of flexibility, that horizontal position is disturbed, causing an early onset flipping event. Figure 6 also shows the evolution of the ratio of the end-to-end distance of the fibre to its equilibrium length. This ratio would be identically one for a rigid cylinder. Note that the computational fibre underwent both compression and extension from is equilibrium length, and, although no significant deformation is evident in figure 5, the end-to-end length of the fibre does vary by as much as 5% of its equilibrium. Flexibility was noted by Forgacs & Mason to give rise to rotational periods that were shorter than those of a rigid fibre with the same aspect ratio [4]. We also remark that we have validated the computational method used here for an ellipsoid rotating in shear flow by comparing the resulting rotational dynamics with that predicted by Jeffery in [29].
Figure 5.
One rotational period of a diatom-chain structure of non-dimensional length Lc = 1 in an imposed shear flow. The fibre length is 14.43 times its diameter. The Reynolds number Re = 0.06 and the effective flow forcing  . (Online version in colour.)
Figure 6.
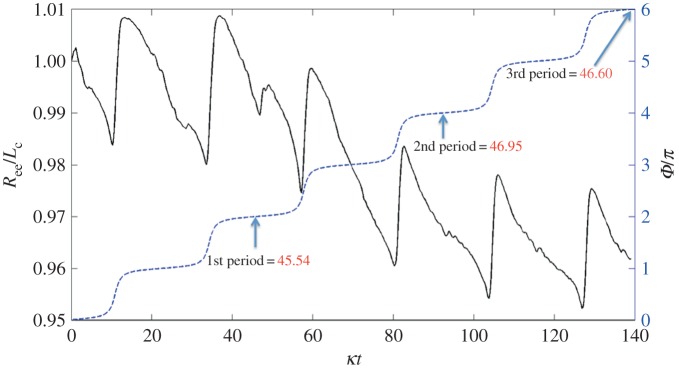
Evolution of the ratio of end-to-end distance Ree to equilibrium length Lc (solid line) and orientational angle of the diatom-chain orbit (dashed line) shown in figure 5. (Online version in colour.)
The related surface-spring and full-spring structures of non-dimensional length Lc = 1, as discussed above, have macroscopic bending rigidities that fall within 5% of this diatom chain structure. Although not shown here, we subjected these other structures to the same shear and observed dynamics that were basically indistinguishable from the diatom chain dynamics shown in figure 5. There was little evidence of deformation, even for the structure with links only between surface nodes (surface-spring).
Although similar orbits are observed for these relatively short, rigid fibres with different spring connectivities (diatom-chain, surface-spring and full-spring), this is no longer the case when we increase the fibre length fourfold (Lc = 4). Increasing the length results in a Reynolds number of Re = 0.94 and an effective flow forcing of  . The aspect ratio of these longer chains is ar = 57.71. Figure 7 shows the positions and deformations of the three chain types as they undergo a single orbit. As expected, the full-spring (blue) and diatom-chain (black) deform less than the chain with surface-springs (red). The dynamics of these three chains in shear, when they are experiencing compressive stresses, are very different. Such a difference did not appear when the chains were subjected to the parabolic flow, as in the aspiration experiments described above.
Figure 7.
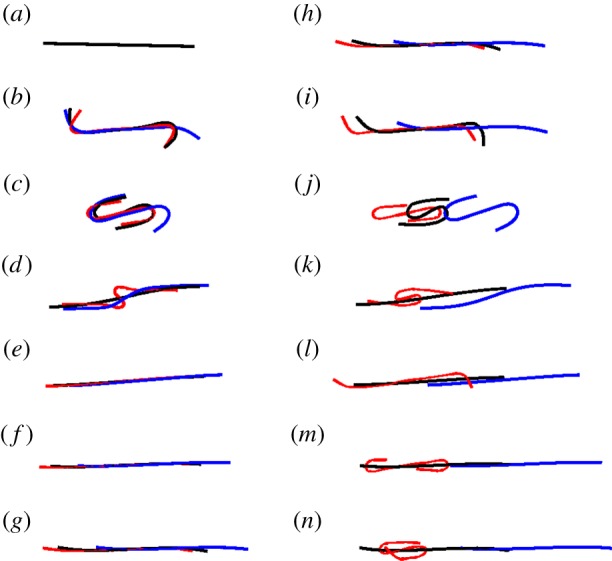
Three chain types subjected to the same shear. Diatom-chain type (black, A = 5.73 × 10⁻¹⁷ N m2), surface-spring (red, A = 5.65 × 10⁻¹⁷ N m2) and full-spring type (blue, A = 5.89 × 10⁻¹⁷ N m2). Although the macroscopic bending rigidity of these chains differs by less than 5%, their orbits are very different.
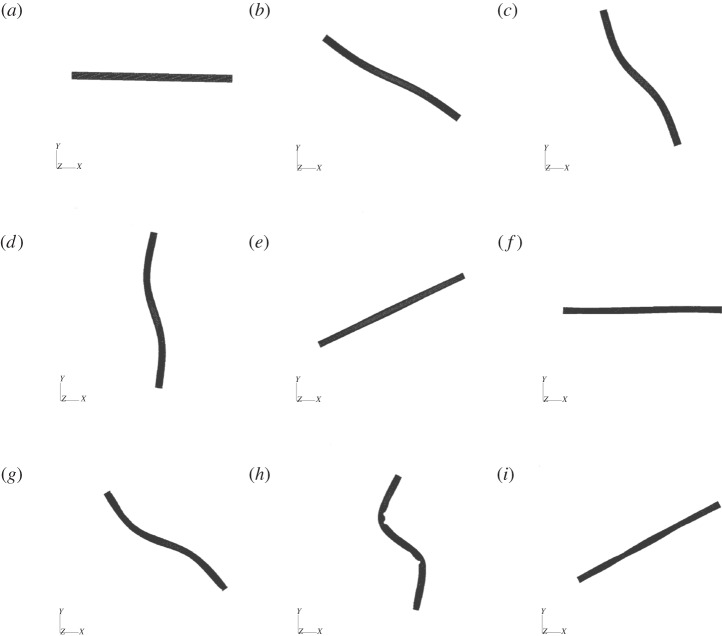
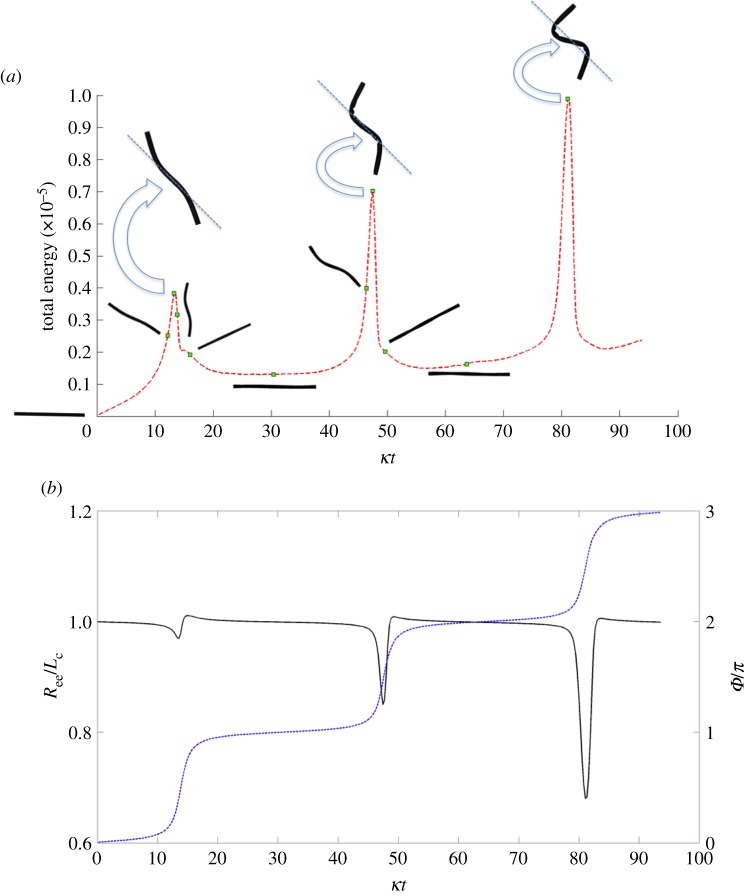
For even the full-spring fibre of length Lc = 4 in figure 7 above, we note the onset of buckling. This did not happen at the length Lc = 1. Keeping all other parameters fixed, is there a critical fibre length that will result in buckling? Consider the dynamics of a surface-spring structure in shear that we know did not buckle at Lc = 1, but did at Lc = 4. Changing its length to Lc = 1.33, and its aspect ratio to ar = 19.24 with all other parameters fixed results in a Reynolds number of Re = 0.104 and an effective flow forcing of  . Figure 8 shows a series of snapshots of the fibre as it undergoes a single orbit. At this larger value of effective flow forcing, the buckling due to compressive stresses is evident. Because this fibre is built out of a network of nodes and springs, we can measure the total amount of stored energy in the springs as a function of non-dimensional time (figure 9a). We see local peaks in stored energy at the instances where the fibre is 45° from the horizontal, when it is undergoing the maximal compressive stress. While the energy in the springs does decrease as the fibre rotates from this position, we see that the fibre springs do not have enough time to get back to equilibrium, and the magnitude of these peaks in energy increase during successive periods. Figure 9b shows the evolution of the ratio of the end-to-end distance of the fibre to its equilibrium length, along with its rotational angle. Here, we see that the end-to-end distance during buckling gets to as low as 70% of the equilibrium length.
Figure 8.
(a–e) Orbit of a surface-spring structure of non-dimensional length Lc = 1.33 in an imposed shear flow. The fibre length is 19.24 times its diameter. The Reynolds number Re = 0.10 and the effective flow forcing  .
.
Figure 9.
(a) Evolution of the total elastic energy of the surface-spring fibre as it rotates in shear. The square dots represent the total energy associated with the shapes of the fibre at the different times shown in figure 8. (b) Evolution of ratio of end-to-end distance Ree to equilibrium length Lc (solid line) and orientational angle of the surface-spring fibre's orbit (dashed line) shown in figure 8. (Online version in colour.)
Qualitatively, our results compare well with those of Tornberg & Shelley [22]. They demonstrated that buckling occurs at a threshold value of effective flow forcing (effective viscosity) about  , while our calculations show this buckling occurs at about
  . However, the aspect ratio of their slender fibres was assumed to be ar = 103, while our fibre that first exhibited buckling had an aspect ratio of ar = 19.24. Therefore, the appropriate non-dimensional quantity to compare would be
| 3.6 |
which takes into account the aspect ratio [3,21]. The buckling observed in [22] occurred at  and our simulations show buckling at
  = 7.4 × 10². While these differ by a factor of about 20, we do remark that the fibres of [22] are perfectly inextensible, which is certainly not the case for the computational fibres presented here.
3.3. Complex fibre orbits in shear
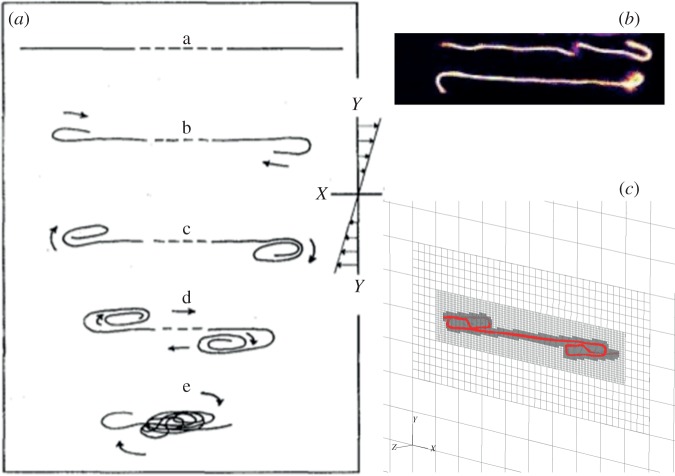
While our motivation for this research is to understand the local flow environment around diatom chains and the resulting implications on nutrient uptake, the computational model developed here is applicable to fibre dynamics in flow where the Reynolds numbers and effective flow forcings fall outside the range relevant to diatom geometries and flow parameters. Following the classic paper of Forgacs & Mason [4], we sought to capture the coil dynamics of long semiflexible fibres, which were only sketched by the authors (figure 10a). It is noted that the deformation of the fibre, while it is aligned with the flow direction, begins first with the bending of the ends. More recently, experiments by Harasim et al. [2] on long actin filaments reveal similar dynamics (figure 10b).
Figure 10.
(a) Schematic sketch from Forgacs & Mason [4] showing coiling of a very long fibre in shear; (b) multiple bending events occurring for a long actin filament in shear (images from Harasim et al. [2]); (c) a snapshot from our simulation for Lc = 16.67. (Online version in colour.)
Using the same surface-spring structure and parameters as in the simulation of figure 8, but with an increased non-dimensional length of Lc = 16.67 and aspect ratio of ar = 240.46, we subject the fibre to a shear flow with Reynolds number Re = 1.67 × 101 and the effective flow forcing of  . Figure 11 shows a sequence of snapshots of the coil dynamics of this long, flexible fibre in shear as it undergoes one rotation. Also shown are the adaptive meshes that capture this complex coiling and recovery. We first note the correspondence between the dynamics of this fibre and the sketch of [4] shown in figure 10a. We also see, in the second and third frame, that the bending of the ends is accompanied by complex buckling in the centre of the fibre, as also seen in the actin polymer micrographs of Harasim et al. [2] in figure 10b. In the course of one period, the fibre is able to recover from its entangled coil, but the ends remain bent (electronic supplementary material, movie S1). Although only one period is shown here, this long fibre continued to undergo a few more orbits going from a coiled configuration back to an elongated configuration, but the fibre did not recover from its coiled state. During this complex motion, because of the slight asymmetry caused by adaptive mesh generation, the centreline of the fibre does not remain in the plane, and the bent ends have a three-dimensional component to them (figure 10c).
Figure 11.

Orbit of a surface-spring structure of non-dimensional length Lc = 16.67 in an imposed shear flow. The fibre length is 240.47 times its diameter. The Reynolds number Re = 1.67 × 10 and the effective flow forcing  . (Online version in colour.)
Lindstrom & Uesaka [24] presented a fluid dynamic model of long, flexible fibres in shear that could exhibit coiled dynamics. However, it was proposed that such coiled motion could only be achieved when the fibre was endowed with an intrinsic, non-zero curvature. However, the complex coil dynamics we present above assumed an equilibrium configuration of a straight cylinder.
A convenient order parameter that measures the extent of buckling of a fibre is 1 − Ree/Lc [3], where Lc is the equilibrium length of the straight fibre, and Ree is the actual end-to-end distance in its evolving configuration. We summarize the results of the previous simulations in figure 12 by choosing the minimum value of end-to-end distance achieved within the first period of rotation of the fibre to compute the order parameter and plot that versus the effective flow forcing  corresponding to the simulation. The diamonds indicate surface-spring fibres, the dots indicate diatom-chain structures and the squares indicate full-spring structures.
Figure 12.
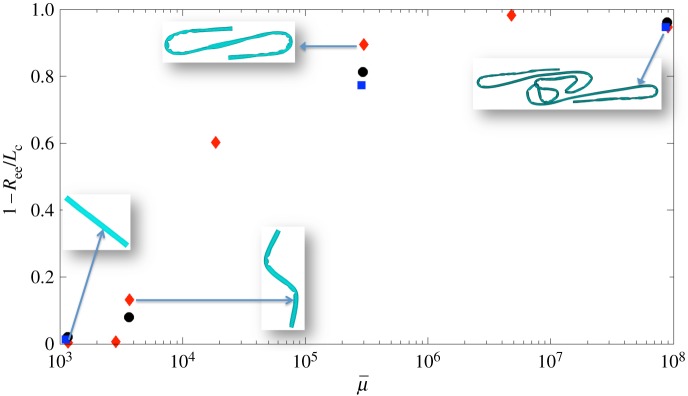
The order parameter 1 − Ree/Lc plotted versus  for each of the simulations described above. Here, the minimum value of end-to-end distance Ree achieved within the first rotational period was used. The diamonds indicate surface-spring fibres, the dots indicate diatom-chain structures and the squares indicate full-spring structures. (Online version in colour.)
Figure 13 demonstrates that this computational model can also capture the closed loop dynamics that are also described for an elastomer filament by Forgacs & Mason [4] (electronic supplementary material, movie S2). We note that the dynamics depicted here are fully three-dimensional.
Figure 13.
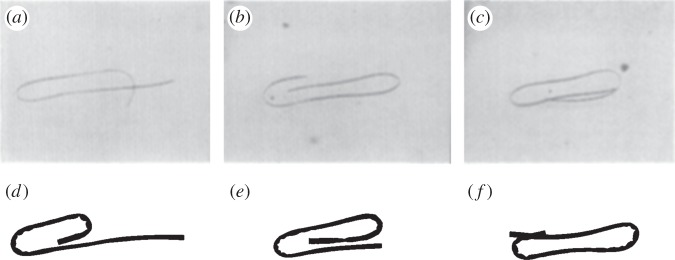
(a–c) Snapshots of an elastomer fibre’s motion from Forgacs & Mason [4]; and (d–f) equivalent snapshots from our simulation.
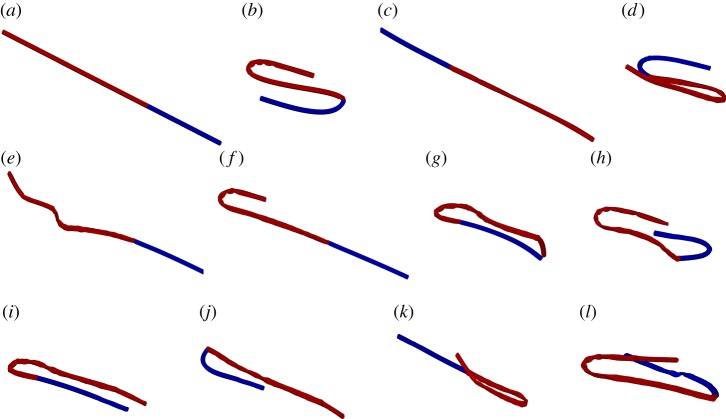
We also note the interesting dynamics of a non-uniform chain where the first third of its length has full-spring connections while the remaining two-thirds just has surface-spring connections. Figure 14 shows a few snapshots of this fibre as it undergoes rotation and deformation (electronic supplementary material, movie S3).
Figure 14.
Snapshots of rotational orbits of an inhomogeneous chain, where one-third of the length has full-spring connections (blue) while the remaining two-thirds just has surface-spring connections (red). Note that these frames are not equally spaced in time.
4. Discussion
Here, we have studied the elastohydrodynamics of semiflexible fibres in a moving fluid. In particular, our motivation is to understand the local flow environment of phytoplankton and its role in nutrient uptake and aggregate formation. Of particular interest are the diverse species of chain-forming diatoms [18]. Only recently has there been success in quantifying the flexural rigidities of some types of these diatom chains [8]. While some species were too flexible for the experimental method to yield a rigidity estimate, the bending rigidities of those species measured varied over four orders of magnitude. We have developed a three-dimensional computational model, based upon an immersed boundary framework [14], that couples an inhomogeneous elastic chain to an incompressible fluid. The elastic properties of the node–spring network comprising the computational fibre were chosen to match the macroscopic bending rigidities of the diatom chains measured in [8].
The computational model presented here does not treat the diatom chain as a simple beam, nor does it make the assumptions of slender body theory. Nevertheless, we have found that simple beam theory does a good job of describing the deformation of the inhomogeneous fibre when it is subjected to a parabolic flow. However, we found that although computational fibres with different connectivity (surface-spring and full-spring) have nearly equal macroscopic bending rigidities, when subjected to a shear flow with large enough effective flow forcing, their shape evolutions vary dramatically.
Our computational model also suggests that for the species of diatoms whose flexural rigidities were quantified in [8], L. undulatum and Stephanopyxis turris would not exhibit buckling in shear flows typically encountered in the ocean, but L. annulata and G. delicatula chains of more than 1–2 mm could. While the bending rigidity of more flexible species such as Thalassiosira was not quantified, their deformation in shear was reported in [18]. There it was conjectured that the flexibility of these chains may allow them to resist breakage when subjected to shear.
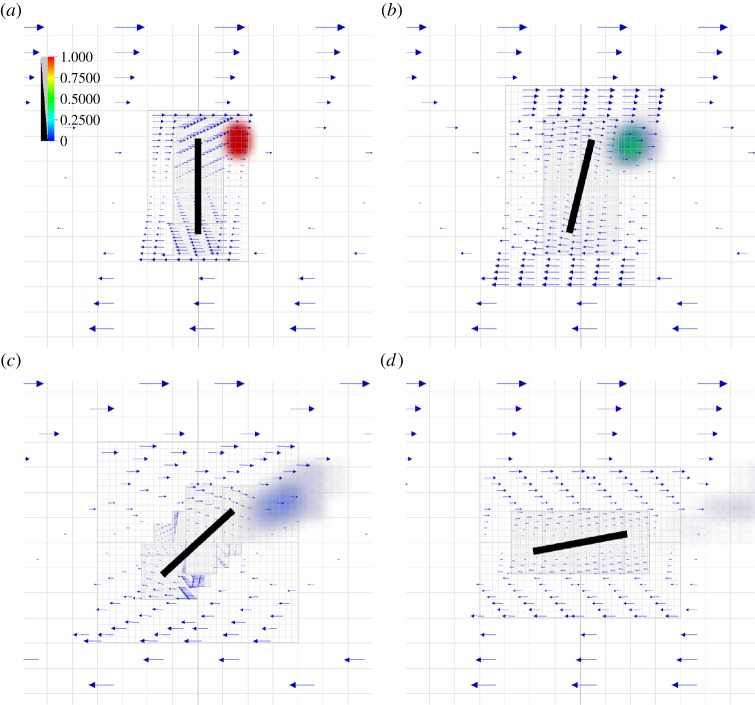
In order to gain more insight into the role of flexibility in diatom chains, we plan to extend this computational model in several directions. Firstly, as in the earlier two-dimensional studies of nutrient acquisition by diatom chains [9], the advection, diffusion and consumption of a chemical species around the diatom chain will be incorporated. This may readily be done since the velocity field is available at grid nodes in the entire domain. To demonstrate the future development of this model, we show the evolution of a bolus of nutrient that is diffusing and being advected by the diatom-shear system in figure 15. Just as this adaptive method [10] allows the computational model to resolve complicated fluid–structure interactions around the diatom chain, the resolution of nutrient dynamics will be achieved by adding grid-adaptivity that tags spatial regions with large nutrient gradients for refinement. (This has not been done in figure 15.) Secondly, assessing the effects of turbulence on phytoplankton solely by analysing simple shear flow has recently been questioned [17]. There it was suggested that dissipative vortices, such as a Burgers vortex, may better represent the local turbulent environment felt by diatom chains. Although here we focused upon diatom chain orbits when subjected to simple, steady shear flow, a richer set of fully three-dimensional background flows will be examined.
Figure 15.
From (a–d), evolution of a bolus of nutrient concentration in the diatom-shear system. The Peclet number that measures ratio of the diffusion timescale to the advection timescale, LU/D, here is about 76, where L is the length of the diatom, U = Lκ, where κ is shear rate, and D is the diffusivity of the nutrient.
Acknowledgements
The authors thank Lee Karp-Boss, Ashley Young and Peter Jumars for sharing their experimental data and for their helpful discussions. The authors also thank Boyce Griffith for his assistance in using IBAMR, Hideki Fujioka for leading the effort to include the advection and diffusion of a passive scalar, Charles Peskin for helpful discussions regarding computation of energy in bent fibres and Michael Shelley for sharing his invaluable insights.
Funding statement
The authors were supported, in part, by the US National Science Foundation grant no. NSF OCE 0724598.
References
- 1.Marshall WF, Nonaka S. 2006. Cilia: tuning in to the cell's antenna. Curr. Biol. 16, R604–R614. ( 10.1016/j.cub.2006.07.012) [DOI] [PubMed] [Google Scholar]
- 2.Harasim M, Wunderlich B, Peleg O, Kröger M, Bausch AR. 2013. Direct observation of the dynamics of semiflexible polymers in shear flow. Phys. Rev. Lett. 110, 108302 ( 10.1103/PhysRevLett.110.108302) [DOI] [PubMed] [Google Scholar]
- 3.Kantsler V, Goldstein R. 2012. Fluctuations, dynamics, and the stretch-coil transition of a single actin filament in extensional flows. Phys. Rev. Lett. 108, 03813 ( 10.1103/PhysRevLett.108.038103) [DOI] [PubMed] [Google Scholar]
- 4.Forgacs OL, Mason SG. 1959. Particle motions in sheared suspensions: X. Orbits of flexible threadlike particles. J. Colloid Sci. 14, 473–491. ( 10.1016/0095-8522(59)90013-3) [DOI] [Google Scholar]
- 5.Guglielmini L, Kushwaha A, Shaqfeh ES, Stone HA. 2012. Buckling transitions of an elastic filament in a viscous stagnation point flow. Phys. Fluids 22, 123601 ( 10.1063/1.4771606) [DOI] [Google Scholar]
- 6.Guasto JS, Rusconi R, Stocker R. 2012. Fluid mechanics of planktonic microorganisms. Annu. Rev. Fluid Mech. 44, 373–400. ( 10.1146/annurev-fluid-120710-101156) [DOI] [Google Scholar]
- 7.Karp-Boss L, Boss E, Jumars PA. 1996. Nutrient fluxes to planktonic osmotrophs in the presence of fluid motion. Oceanogr. Mar. Biol. 34, 71–107. [Google Scholar]
- 8.Young AM, Karp-Boss L, Jumars PA, Landis EN. 2012. Quantifying diatom aspirations: mechanical properties of chain-forming species. Limnol. Oceanogr. 57, 1789–1801. ( 10.4319/lo.2012.57.6.1789) [DOI] [Google Scholar]
- 9.Musielak MM, Karp-Boss L, Jumars PA, Fauci LJ. 2009. Nutrient transport and acquisition by diatom chains in a moving fluid. J. Fluid Mech. 638, 401–421. ( 10.1017/S0022112009991108) [DOI] [Google Scholar]
- 10.Griffith BE, Hornung RD, McQueen DM, Peskin CS. 2007. An adaptive, formally second order accurate version of the immersed boundary method. J. Comp. Phys. 223, 10–49. ( 10.1016/j.jcp.2006.08.019) [DOI] [Google Scholar]
- 11.Lim S, Peskin C. 2004. Simulations of the whirling instability by the immersed boundary method. SIAM J. Sci. Comp. 25, 2066–2083. ( 10.1137/S1064827502417477) [DOI] [Google Scholar]
- 12.Popov EP. 1976. Mechanics of materials. Englewood Cliffs, NJ: Prentice Hall. [Google Scholar]
- 13.Peskin CS. 1977. Numerical analysis of blood flow in the heart. J. Comp. Phys. 25, 220–252. ( 10.1016/0021-9991(77)90100-0) [DOI] [Google Scholar]
- 14.Peskin CS. 2002. The immersed boundary method. Acta Numer. 11, 459–517. ( 10.1017/S0962492902000077) [DOI] [Google Scholar]
- 15.Munk WH, Riley GA. 1952. Absorption of nutrients by aquatic plants. J. Mar. Res. 11, 215–240. [Google Scholar]
- 16.Lazier JN, Mann KH. 1989. Turbulence and diffusive layers around small organisms. Deep-Sea Res. 36, 1721–1733. ( 10.1016/0198-0149(89)90068-X) [DOI] [Google Scholar]
- 17.Jumars PA, Trowbridge JH, Boss E, Karp-Boss L. 2009. Turbulence–plankton interactions: a new cartoon. Mar. Ecol. 30, 133–150. ( 10.1111/j.1439-0485.2009.00288.x) [DOI] [Google Scholar]
- 18.Karp-Boss L, Jumars PA. 1998. Motion of diatom chains in steady shear flow. Limnol. Oceanogr. 43, 1767–1773. ( 10.4319/lo.1998.43.8.1767) [DOI] [Google Scholar]
- 19.Jeffery GB. 1922. The motion of ellipsoidal particles immersed in a viscous fluid. Proc. R. Soc. Lond. A 102, 161–179. ( 10.1098/rspa.1922.0078) [DOI] [Google Scholar]
- 20.Becker LE, Shelley MJ. 2001. Instability of elastic filaments in shear flow yields first-normal-stress differences. Phys. Rev. Lett. 87, 198301 ( 10.1103/PhysRevLett.87.198301) [DOI] [PubMed] [Google Scholar]
- 21.Young YN, Shelley MJ. 2007. Stretch-coil transition and transport of fibers in cellular flows. Phys. Rev. Lett. 99, 058303 ( 10.1103/PhysRevLett.99.058303) [DOI] [PubMed] [Google Scholar]
- 22.Tornberg AK, Shelley MJ. 2004. Simulating the dynamics and interactions of flexible fibers in Stokes flows. J. Comp. Phys. 196, 8–40. ( 10.1016/j.jcp.2003.10.017) [DOI] [Google Scholar]
- 23.Skjetne P, Ross RF, Klingenberg DJ. 1997. Simulation of single fiber dynamics. J. Chem. Phys. 107, 2108 ( 10.1063/1.474561) [DOI] [Google Scholar]
- 24.Lindstrom SB, Uesaka T. 2007. Simulation of the motion of flexible fibers in viscous fluid flow. Phys. Fluids 19, 113307 ( 10.1063/1.2778937) [DOI] [Google Scholar]
- 25.Stockie JM, Green SI. 1998. Simulating the motion of flexible pulp fibres using the immersed boundary method. J. Comput. Phys 147, 147–165. ( 10.1006/jcph.1998.6086) [DOI] [Google Scholar]
- 26.Bouzarth EL, Layton AT, Young Y-N. 2011. Modeling a semi-flexible filament in cellular Stokes flow using regularized Stokeslets. Int. J. Number. Methods Biomed. Eng. 27, 2021–2034. ( 10.1002/cnm.1454) [DOI] [Google Scholar]
- 27.Cox RG. 1971. The motion of long slender bodies in a viscous fluid. Part 2. Shear flow. J. Fluid Mech. 45, 625–657. ( 10.1017/S0022112071000259) [DOI] [Google Scholar]
- 28.Zhang D, Smith DE, Jack DA, Montgomery-Smith S. 2011. Numerical evaluation of single fiber motion for short-fiber-reinforced composite materials processing. J. Manuf. Sci. Eng. 133, 051002 ( 10.1115/1.4004831) [DOI] [Google Scholar]
- 29.Nguyen H, Karp-Boss L, Jumars PA, Fauci LJ. 2011. Hydrodynamic effects of spines: a different spin. Limnol. Oceanogr. Fluids Environ. 1, 110–119. ( 10.1215/21573698-1303444) [DOI] [Google Scholar]


