

Abstract
Motor activity possesses a multiscale regulation that is characterized by fractal activity fluctuations with similar structure across a wide range of timescales spanning minutes to hours. Fractal activity patterns are disturbed in animals after ablating the master circadian pacemaker (suprachiasmatic nucleus, SCN) and in humans with SCN dysfunction as occurs with aging and in dementia, suggesting the crucial role of the circadian system in the multiscale activity regulation. We hypothesized that the normal synchronization between behavioural cycles and the SCN-generated circadian rhythms is required for multiscale activity regulation. To test the hypothesis, we studied activity fluctuations of rats in a simulated shift work protocol that was designed to force animals to be active during the habitual resting phase of the circadian/daily cycle. We found that these animals had gradually decreased mean activity level and reduced 24-h activity rhythm amplitude, indicating disturbed circadian and behavioural cycles. Moreover, these animals had disrupted fractal activity patterns as characterized by more random activity fluctuations at multiple timescales from 4 to 12 h. Intriguingly, these activity disturbances exacerbated when the shift work schedule lasted longer and persisted even in the normal days (without forced activity) following the shift work. The disrupted circadian and fractal patterns resemble those of SCN-lesioned animals and of human patients with dementia, suggesting a detrimental impact of shift work on multiscale activity regulation.
Keywords: shift work, multiscale regulation, circadian misalignment
1. Introduction
Outputs from a wide variety of physiological systems, such as heart rate and motor activity, exhibit complex fluctuation patterns characterized by fractal/scale-invariant structures with properties that remain invariant over a wide range of timescales [1–9]. These fractal patterns appear to be a hallmark of healthy physiology because they are robust in healthy physiological systems but are significantly disrupted or abolished in degraded systems that are more vulnerable to catastrophic events and less adaptable to perturbations [2,4,10–13]. For instance, fractal patterns of motor activity are disturbed in Alzheimer's disease (AD) [11] and the degree of disturbances is correlated to AD severity [14]; and fractal regulation of heartbeat fluctuations is perturbed in patients with cardiovascular diseases [9,10,15] and can help to predict the survival rates of these patients [16,17]. However, the underlying mechanisms of fractal regulation in physiology are yet to be elucidated.
The circadian system orchestrates rhythms of approximately 24 h in behaviour and physiology and their synchronization with light/dark (LD) cycles [18]. In mammals, the master circadian pacemaker is located in the hypothalamic suprachiasmatic nucleus (SCN) [19,20]. Consisting of approximately 20 000 coupled neurons and driven by a complex and redundant genetic network [21], the SCN generates sustained oscillations in synchrony with the environmental LD cycles and transmits rhythmic messages to downstream neural and physiological processes [20,22]. Beyond a simple pacemaker functioning at a fixed timescale of approximately 24 h, recent studies indicate that the SCN also plays a crucial role in physiologic functions at multiple timescales [23]. This multiscale functionality of the SCN is evidenced by the disrupted fractal activity patterns in SCN-lesioned rats [7] and in elderly humans with AD and/or dementia accompanied by SCN dysfunction [11]. These findings suggest that intact circadian orchestration involving the SCN may be essential for normal fractal activity regulation [24].
Circadian regulation can be disturbed not only by dysfunction of central circadian control nodes such as the SCN but also by the interruptions of normal active–inactive behavioural cycles. Many studies have shown that desynchrony or misalignment between behavioural cycles and endogenous circadian rhythms, as occurs in shift workers, can disrupt sleep and circadian profiles of activity [25,26] as well as hormonal and metabolic variables, leading to increased risks for developing diabetes and cardiovascular diseases [27–31]. We hypothesize that the synchronization between behavioural cycles and endogenous circadian rhythms is required to maintain multiscale activity regulation. To test this hypothesis, we studied activity fluctuations of rats in a simulated work protocol that consisted of a regular weekly working schedule with five 8-h workdays followed by 2 days of rest. The protocol was performed under 12 L : 12 D cycles which were used to entrain the SCN-generated circadian rhythm. The 8-h working period in each workday was scheduled either during the light phase when animals were normally inactive—shift work or during the dark phase when animals were normally active—normal work. Our hypothesis predicts that scale-invariant activity patterns are disrupted in rats under the shift work schedule while persisting in rats under the normal work schedule.
2. Material and methods
2.1. Animals and protocol
We studied 19 Wistar rats at the age of seven to eight weeks throughout a four to five weeks protocol in which animals underwent a simulated work schedule. Each animal was housed in an individual transparent acrylic cage (40 × 50 × 20 cm) placed in a soundproof monitoring room with circulating air and constant temperature (22 ± 1°C). Rats had free access to water and food (Rodent Laboratory Chow 5001, Purina, Minnetonka, MN, USA) and were maintained in a 12 L : 12 D cycle throughout the protocol to ensure stable circadian oscillations of the SCN as confirmed by the expressions of PER1 and PER2 in the SCN [32]. In each week, animals had 5 days with scheduled ‘work’ (workday: Monday to Friday) followed by 2 days without ‘work’ (weekend: Saturday and Sunday). During the workdays, animals were assigned to either: (i) a shift work schedule (N = 12): ‘work’ during the habitual resting phase from 2 to 10 h after lights on (zeitgeber time: ZT 2–10); or (ii) a ‘normal’ work schedule (N = 7): ‘work’ during the normal active phase from 2 to 10 h after lights off (ZT 14–22) [32].
2.2. Simulated work procedure
In order to ensure that animals were active during a specific work period, animals were removed from their cages and put on slowly rotating drums that were designed for forced activity (Omnialva SA de CV, Mexico City, Mexico). The drum (33 cm in diameter × 33 cm long) rotated with a speed of one revolution/3 min such that animals had to stay awake and move slowly but were not required to perform effortful movements. Food and a small bottle of water were available ad libitum from a concentric middle tube. Except for during work periods, all animals stayed in their home cages and were continuously exposed to LD cycles (more details have been reported in Salgado-Delgado et al. [32]).
2.3. Data acquisition
Locomotor activity was monitored with movement sensors placed under individual cages that were designed to continuously detect motion-associated vibrations of the cages. The system for monitoring and data collection was developed in the Departamento de Anatomía, Facultad de Medicina, Universidad Nacional Autónoma de México, Mexico [32]. Data were collected with a digitized system and automatically stored every 1 min and resampled to 2-min epochs for further analysis. Note that there were no activity recordings for the animals during scheduled work periods because the animals were taken out of their home cages (figure 1 and electronic supplementary material, figures S3 and S4). To avoid artefacts when transferring animals between their home cages and the working cages, data of 30 min before and after the transitions in each workday were excluded.
Figure 1.
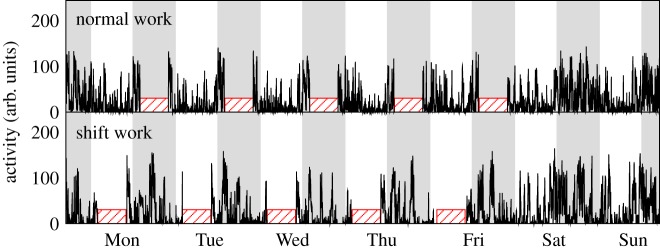
A week of representative activity recordings from a normal work animal and a shift work animal. The level of activity was expressed in arbitrary unit (arb. units). Shaded bars indicate the dark phase of LD cycles. The striped blocks denote the periods of simulated work, i.e. ZT 2–10 h for the shift work animal and ZT 14–22 h for the normal work animal. (Online version in colour.)
2.4. Multiscale activity patterns
To assess multiscale activity control, we performed detrended fluctuation analysis (DFA) to estimate correlations in the activity fluctuations at different timescales [33]. Compared with traditional correlation analyses such as power spectral analysis and Hurst analysis, the DFA can accurately quantify correlations in data that may be masked by underlying non-stationarities or trends [34,35]. This method quantifies the fluctuation amplitude, F(n), at different timescales n. A power-law form of F(n) indicates multiscale regulation in the fluctuations, yielding F(n) ∼ nα. The parameter α, called the scaling exponent, quantifies the correlation properties in the signal as follows: if α = 0.5, there is no correlation in the fluctuations (‘white noise’); if α > 0.5, there are positive correlations, where large activity values are more likely to be followed by large activity values (and vice versa for small activity values). Particularly, α ≈ 1, which has been observed in many physiological outputs under normal conditions, suggests the most complex behaviour in the fluctuations with a fine balance between randomness and excessive regularity [23]. Specifically, decreased α (less than 1) in activity fluctuations at large timescales has been observed in animals after the lesion of the SCN (more than approx. 4 h) [7] and in humans with aging and in dementia (more than approx. 2 h) [11]. On the other hand, spectral analysis can also be used to estimate correlations in a signal (i.e. examining the relationship among power densities at different timescales in the log–log plot of the spectrum) and the spectrum-derived scaling exponent is mathematically related to the DFA-derived exponent if the signal is stationary [36]. However, as biological signals are often non-stationary with varying mean and standard deviation, DFA and other nonlinear analytical approaches are proposed for a more reliable estimation of long-range correlations in biological systems [10,14,15,23,33,37].
Here, the segments of activity recordings with missed data due to simulated work periods were stitched together for this analysis as suggested by Chen et al. [34]. To minimize the effect of trends [35], we used the second-order polynomial fit in the DFA. We also selected the range of timescales to ensure reliable estimation of the scaling exponent, such as avoiding the spurious crossover region at small timescales (i.e. the smallest timescale was 5 epochs) and analysing data with sufficient number of boxes (i.e. the DFA-derived amplitude function at each timescale was based on data with at least six windows at that timescale).
2.5. Simulating effects of missing data
To simulate the effects of missing data on DFA results, we analysed 10-day activity recordings that were collected from seven additional Wistar rats—a control group—under the same 12 L : 12 D cycle but without any disturbances (no working periods) [7,38]. We artificially removed the data points in these recordings corresponding to the work periods and 30-min data before and after the work period, i.e. ZT 1.5–10.5 for the shift work schedule and for ZT 13.5–22.5 h for the normal work schedule.
2.6. Statistical analysis
Results were represented as mean ± s.e. To assess the effect of shift work on multiscale activity patterns, ANOVA was performed to assess differences in correlations at different timescales between the simulated shift work schedule, the simulated normal work schedule and the control condition. To explore the time course of the changes in activity regulation throughout the shift work protocol, mean activity level and correlations in activity fluctuations within subjects in different weeks were also compared by ANOVA. The multivariate analysis was used to assess the differences in 24-h activity profile between different weeks within subjects. To determine whether the effect of shift work on activity regulation is transient, we analysed data during the workdays and during the weekends separately.
3. Results
3.1. Effect of shift work on mean activity level
Based on data collected from the animals in the same study, we previously reported that body weight of the rats during the shift work protocol gradually increased and that the associated gain of weight became significant after two work weeks [32]. To examine whether the weight gain was associated with decreased locomotor activity, we investigated individual activity levels throughout the protocol. We found a significant reduction in the mean activity level of shift work animals after first or second week consistently for workday (p < 0.0001) and weekend (p < 0.0001). Specifically, the activity level during workdays remained similar in Week 2 (compared with Week 1, p = 0.43), but began to decrease in Week 3 (50 ± 4% decrease from Week 2 to Week 3; p < 0.0001) and remained at the similar low level in Weeks 4–5 (figure 2a). During weekends, the significant decrease of activity level was observed after Week 1, i.e. 42 ± 7% decrease from Week 1 to Week 2 (p = 0.0007) (figure 2b). By contrast, animals that underwent the normal work protocol did not show reduction in mean activity throughout the protocol. Instead this group even had a significant increase in the mean activity in Week 4 for the workday activity (57 ± 12% increase from Week 3 to Week 4; p = 0.0002) and in Week 3 for the weekend activity (71 ± 19% increase from Week 2 to Week 3; p < 0.0001) (figure 2d,e).
Figure 2.

Effects of shift work on mean activity levels and 24-h activity rhythms. Mean activity level during workdays (a,d) and during weekends (b,e) and 24-h rhythm amplitude during weekends (c,f) were calculated in each week. Results of shift work animals are shown in (a–c) and results of normal work animals in (d–f). In each individual, the mean activity level was normalized to the mean level of the data throughout the protocol (four weeks for the normal work group and five weeks for the shift work group). The amplitude of 24-h activity rhythm in each weekend was estimated from the normalized power spectrum with total power equal to one.
3.2. Effect of shift work on 24-h activity profile
In addition to reduced mean activity level, the amplitude of 24-h rhythm during the weekends (not quantified during the workdays due to missing data) was decreasing in shift work animals throughout the protocol (p = 0.0029), even after adjusting for daily mean activity. When compared with Week 1, the peak in the normalized power spectrum at 24 h decreased by 18 ± 8% in Week 2, 30 ± 4% in Week 3, 25 ± 5% in Week 4 and 23 ± 8% in Week 5 (figure 2c). Moreover, the amplitude of the 24-h rhythm (Week 3) and one of the harmonics of the 24-h rhythm, i.e. 12 or 6 h, in shift work animals were different from those of normal work animals in Week 2 to Week 4 (p < 0.01), although the harmonics of both groups were similar in Week 1 (p > 0.05) (see the electronic supplementary material, figure S1).
Moreover, the shape of the 24-h activity profile in the shift work animals during the workdays was also altered from Week 1 to Week 5 (figure 3a,b). This alteration can be well demonstrated when considering normalized activity level (normalized by daily mean level) in the following time periods during the workdays (figure 3c,d).
Figure 3.

Mean daily activity profiles during workdays for shift work animals (a) and normal work animals (c). Mean activity during the light and dark transitions during workdays for shift work animals (b) and normal work animals (d). Shaded areas indicated the dark phase of LD cycles. The striped blocks denoted the periods of simulated work. To obtain the mean daily activity pattern, data for each animal in each day were first normalized to the daily mean level. Then averaged daily patterns were obtained from five workdays. The mean activity levels were obtained from five 30-min windows near the light and dark transitions. Asterisks ‘*’ indicate a significant dependence on week (p < 0.05). For normal work animals, there were no significant changes in their activity responses to light–dark (p > 0.86) or dark–light transitions (p > 0.32) throughout the protocol. (Online version in colour.)
3.2.1. Diminished response to lights on
As expected, animals showed decreased activity after lights on in Week 1 (p < 0.05), i.e. 65 ± 21% of daily mean level at ZT 23.15−23.45 (before lights on) when compared with 28 ± 4% at ZT 0.15−0.45 (after lights on). However, the response was diminished in Weeks 2−5, as indicated by similar activity levels before and after lights on (p > 0.18).
3.2.2. Increased activity levels after the work period
When animals returned to their home cages after the scheduled shift work (ZT 10), activity at ZT 10.45−11.15 h was 58 ± 5% of daily mean level in Week 1. The activity level increased significantly in Weeks 2–5 (98 ± 11%, 223 ± 27%, 183 ± 23% and 187 ± 17% of daily mean level, respectively; p < 0.0001).
3.2.3. Reduced response to lights off
At ZT 11.15−11.45 (approx. 1.2 h after scheduled shift work), activity level was about 55 ± 5% of daily mean consistent for all five weeks (p > 0.05). Immediately after lights off (ZT 12 h), animals had a higher activity level at ZT 12.15−12.45 in Week 1 (114 ± 15%) when compared with that at ZT 11.15−11.45 (43 ± 5%). Such a response to the light–dark transition was significantly reduced in Week 2−5 (p < 0.05), i.e. mean activity at ZT 12.15−12.45 was 81 ± 13%, 94 ± 12%, 85 ± 17% and 92 ± 19% of daily mean level for Week 2–5, respectively.
On the weekends, a consistent reduction in the response to lights on was also observed in the shift work animals (p < 0.05; see the electronic supplementary material, figure S2) but the response to light–dark transitions showed no significant change (p > 0.5). All above changes in the shift work animals were not presented in the normal work animals (all p-values > 0.3) (figure 2f).
3.3. Scale-invariant activity correlations were disrupted by the shift work schedule
Under the normal work schedule, the activity fluctuations of animals during the workdays exhibited strong long-range correlations across a broad range of timescales from minutes up to 12 h, as indicated by a power-law form of F(n) ∼ nα (a straight line in a log–log plot) with α = 0.98 ± 0.01 (figure 4a,b). On the contrary, the shift work group showed significantly disrupted fluctuation patterns during the workdays, displaying different correlations in two timescale regions separated by a break point at timescale approximately 4 h (figure 4a,b). The correlations were much weaker at timescales above the break point (Region II: large timescales from 4 to 12 h, α2 = 0.72 ± 0.03) than those at smaller timescales (Region I: timescales less than 4 h, α1 = 1.08 ± 0.02) (p < 0.0001). Moreover, the difference in the scaling exponent between two regions (Δα = α1 − α2 = 0.36 ± 0.04) depended on the number of weeks into the protocol (p = 0.0014), and Δα was significantly larger in Weeks 3–5 when compared with Weeks 1–2 (figure 4f), indicating more disrupted multiscale regulation.
Figure 4.

Disrupted long-range correlations in shift work animals. Fluctuation functions F(n) of shift work animals and a normal work animals during workdays (a,b) and during weekends (c,d). The dashed curve is the fitting line derived from SCN-lesion animals [7]. On the abscissa, n represents the timescale in hours. The fluctuation functions were vertically shifted for better visualization of differences between conditions. There was a ‘break point’ at a timescale of approx. 4 h for shift work animals, which was marked by dashed vertical lines in each plots. The break point can be seen more clearly where F(n) divided by timescale n was plotted, where β = α − 1 (b,d). Scaling exponent α2 was obtained by fitting F(n) at timescales between 4 and 12 h (Region II), whereas scaling exponent α1 was obtained by fitting F(n) at timescales between approximately 0.5 and 4 h (Region I). Note that fewer points were plotted in the figures for a better visualization. (e) The degree of disruption of long-range correlations was quantified by Δα = α1 − α2. Δα = 0 indicates a consistent long-range correlations over the two regions while the larger Δα indicates more disrupted correlations with more difference in correlations between two timescale regions. Results of control animals with simulated effects of missing data corresponding to work schedule were presented for comparison. The scaling exponents were significantly different between two timescale regions for shift work animals during workdays and weekends (p < 0.01, indicated by ‘*’). (f) Disruption of correlation patterns in each week. The disruption in the shift work animals was much more severe in Week 3–5 as compared with the first two weeks. Asterisks ‘*’ indicate a significant disruption in fractal patterns (i.e. Δα different from 0; p < 0.01). Plus ‘+’ indicates a significant changes in Δα between the two consecutive weeks (p < 0.05). (Online version in colour.)
During the weekends, the shift work group still exhibited different correlations in the two regions with a smaller scaling exponent at timescales more than 4 h and a larger exponent at smaller timescales (Δα = 0.13 ± 0.03) (p = 0.0033) (figure 4c,d). However, the difference in correlations between the two regions was significantly reduced when compared with the difference during the workdays (p = 0.0001) (figure 4e). For the normal work group, the long-range correlations remained unchanged during the weekends with consistent correlations in the two timescale regions (α1 = 0.89 ± 0.03; α2 = 0.84 ± 0.02; Δα = 0.05 ± 0.04; p > 0.2).
In the surrogate data from rats that underwent 10 days of LD cycles without being disturbed, removing data points between ZT 1.5−10.5 h of these recordings did not disrupt long-range correlations. There was no difference in the correlations between Region I and II (Δα = 0.005 ± 0.033, not different from 0; p > 0.8) (figure 4e), indicating that the observed disrupted activity correlations in shift work animals were not due to the missing data.
4. Discussion
Previous studies have shown robust multiscale activity regulation in humans and animals, which remain unchanged during LD cycles and constant darkness, and persist over timescales from minutes to hours [1,7]. In this study, we further showed that the multiscale regulation was preserved even when animals were placed in a slowly rotating drum for 8 h each day during the normal active phase (ZT 14–22). Note that the experiment set-up was previously used to induce sleep deprivation [32,39,40] and was used in this study to induce forced activity. Remarkably, when forced activity was scheduled during the habitual resting phase (ZT 2–10), the patterns were significantly disrupted as characterized by different correlations in two timescale regions (less than 4 h and more than 4 h). The disruption appeared in the first week and worsened after two weeks (figure 4f). In addition, the disruption was mitigated but still remained during the weekends when shift work was absent, suggesting that 2 days were not sufficient for the complete recovery of disrupted activity regulation following 5 days of shift work. As the disrupted activity patterns resemble those observed in animals with lesion of the SCN [7] and in humans with dementia/AD [11], these findings indicate a multiscale, adverse impact of shift work on motor activity control that outlasted the shift work exposure itself.
4.1. Scale-invariant activity control requires normal circadian regulation
The control mechanism of multiscale activity regulation is still to be elucidated. Our previous studies showed that an intact SCN is required for maintaining such multiscale activity regulation. Lesioning the SCN in the animals breaks down fractal activity patterns, leading to abolished correlations at large timescales more than 2 h [7]. In human studies, aging and dementia disrupt activity fluctuations in a similar manner as the SCN lesion [11]. The degree of the disruption, as characterized by the difference between the correlations at small and large timescales, is highly correlated with amyloid plaques in the brain (a biomarker for AD) and can better predict changes of two major circadian neurotransmitters (vasopressinergic and neurotensinergic neurons) in the SCN than traditional circadian measures (e.g. circadian amplitude and daily variability of motor activities) [14]. In this study, we found that forced activity during the habitual resting phase can also disrupt the multiscale activity regulation. As the SCN still displayed stable circadian rhythmicity under the shift work schedule [32], the disruption is likely caused by perturbed dynamic interactions between the SCN and other neural nodes in motor activity control network [41]. This is consistent with our previous study in which we showed that the SCN itself cannot generate scale-invariant patterns [24] despite the fact that the neural network within the SCN is composed of tens of thousands of coupled neurons each acting as a cell-autonomous oscillator. Taken together, our results suggest that a network of neural nodes with feedback interactions involving the SCN is required for multiscale activity control and that the synchronization between circadian rhythms of behaviour, physiology and LD cycles is crucial for the normal function of the network.
A number of neural and hormonal pathways and control nodes that are linked to the SCN and affected by shift work may be involved in fractal activity regulation. For instance, shift work modified the rhythm of food intake which is known to affect daily rhythms of metabolic variables and peripheral circadian clocks [18]. The changes in peripheral circadian oscillations may also modify motor activity directly or indirectly via its feedbacks to the circadian neural nodes including the SCN and the dorsomedial hypothalamic nucleus [42]. Further studies are warranted to determine which pathways and control nodes are involved in fractal activity regulation.
4.2. Differences between animals under the shift work schedule and animals after the suprachiasmatic nucleus lesion
Despite the similar disruption in shift work animals and SCN-lesioned animals, we note that there are clear differences between the two cases. First, 24-h activity rhythms were still present in shift work animals (though reduced), whereas those rhythms were almost abolished in the SCN-lesioned animals even under LD cycles. Second, shift work led to decreased activity levels (figure 2), whereas SCN-lesioned animals did not have significant changes in mean activity level. The decreased activity level in shift work animals may, to a certain degree, explain the previous observation that the body weight of these animals increased despite the similar food intake [32]. Third, a certain degree of activity correlations was preserved in shift work animals at timescales more than 4 h (indicated by the scaling exponent α close to but still more than 0.5) (figure 4), whereas the SCN-lesioned animals demonstrated a complete breakdown of correlations over the same region of timescales (as indicated by α ≈ 0.5) [7]. This difference is expected because the misalignment of the behavioural cycle with respect to the circadian cycle only attenuated the SCN-imparted neural interactions between control nodes, rather than completely abolishing its function.
4.3. Scale-invariant activity correlations and 24-h activity rhythm are two complementary features of dynamics of activity control
Altered activity correlations are generally associated with or even caused by the changes in activity fluctuations or rhythms at different timescales. This is supported by our observations that, in addition to disrupted activity correlations, the 24-h activity profile and the relative weights of power densities of circadian rhythm and its harmonics were also altered in the shift work animals (figure 3). However, the 24-h rhythm per se cannot determine scale-invariant correlations from the views of both biology and mathematics. For instance, in our previous study of the SCN neural activity [24], we found that the neural activity of the SCN in vivo display both circadian rhythms and scale-invariant correlations from 0.02 to 12 h and that the patterns were completely abolished in the SCN in vitro while the circadian rhythm persisted. To further demonstrate this point, we did more simulations using the activity data of this study. Specifically, we artificially imposed an additional 24-h rhythm in the activity data of shift work animals during weekends such that the power density at 24-h was equal to the value for normal work animals. We found that the scaling behaviour at 4–12 h remained unchanged, indicated by the similar scaling exponents as compared with the values of the raw data. In addition, the correlations at less than 4 h also remained the same in the surrogate signal such that the difference in the correlations between two timescale regions persisted in the surrogate data of shift work animals (see the electronic supplementary material, figure S5).
5. Limitations
This is the first study demonstrating how shift work affects activity regulation at multiple timescales (not only at approx. 24 h). There are certain limitations of the current approach.
5.1. Differences between species
In our rat model for shift work, the animals were scheduled to work during the light phase when these nocturnal animals are normally inactive. Thus, the exposure to light during the working environment did not further interfere with the light-entrained circadian rhythm of the SCN. The lack of interference has been confirmed by intact circadian rhythms of PER1 and PER2 in the SCN under these conditions [32]. However, humans are diurnal and normally inactive during the dark phase such that light exposure during the shift work at nights will introduce additional circadian disruption via disturbed LD cycles and light-induced phase shift in the SCN. Thus, it is likely that shift work may have large impacts on humans as compared to rats. Further studies are warranted to verify our findings and to determine the possible differences between diurnal and nocturnal species.
5.2. Missing data
Another major limitation in our experimental design is missing data during the scheduled working hours. Using surrogate data generated from recordings of un-disturbed animals, we showed that missing data could not account for the altered correlation patterns in the shift work protocol. However, it is still not clear what occurred during the working hours. The similar concern applies to animals undergoing the normal work protocol. To address these concerns, continuous 24 h recordings are needed in future studies of shift work.
5.3. Lack of stable baseline
In this study, we studied the correlation properties of activity fluctuations only during the weeks in either shift or normal work protocol. No baseline data were included because activity patterns during approximately one week before the start of the protocol were not stable in terms of multiscale regulation. The underlying mechanism is not clear. We speculate that instability might be caused by the fact that the animals were still in a transitional stage when moving to a new cage. The altered correlation patterns in the shift work animal might be a combined effect of removing animals from their home cages and scheduled shift work during inactive phase. In human studies, it has been shown that depressed people had disrupted fractal activity patterns [4,12]. It is possible that the stress associated with the transition to a new environment disrupted long-range activity correlations in these animals before they fully adapted to the environment. Further studies on animals that are simply moved to another cage without scheduled work are required to test the hypothesis.
One related concern about the interpretation of our findings is whether the disrupted multiscale regulation in animals under the shift work schedule was caused by the unstable baseline instead of shift work. This is unlikely for the following reasons: (i) both shift work and normal work animals underwent the same baseline condition but normal work animals showed robust long-range activity correlations since Week 1 and throughout the work protocol; (ii) long-range correlation patterns were more disrupted in the shift work animals during Weeks 3−5 as compared with Weeks 1–2; and (iii) the disruption was significantly reduced during the weekends when the shift work schedule was temporarily suspended. However, we cannot fully exclude the possibility that long-range correlation patterns might not be stable in Weeks 1–2 when the work schedule was introduced and that the normal work schedule might help the animals to restore long-range correlations. Nevertheless, our results highlight the adverse impact of shift work on activity regulation and the importance of maintaining the normal behavioural cycles in synchrony with the LD cycles.
5.4. Adaptation to long-term shift work
We only examined the effect of shift work on activity control for up to five weeks. It is not known whether the animals can eventually adapt to the shift work schedule. In humans, it has been shown that shift workers have difficulties adjusting physiological rhythms to shift work schedules even after years of shift work experience [29,31]. Thus, it is unlikely that the disrupted correlation patterns in animals would be restored when the simulated shift work protocol lasts longer.
5.5. Technique
In this study, we only examined one statistical property, namely correlations, of activity fluctuations at different timescales. A signal with scale-invariant correlations does not necessarily imply it possesses fractal patterns in other statistical properties such as multifractality and nonlinearity [15,43]. In addition, there are many other methods for the assessment of correlations that have comparable or even better performances than that of DFA [44]. Further studies using different analytical tools should be encouraged to confirm the observed influence of shift work on multiscale motor activity control.
6. Conclusion
Our results clearly showed that shift work substantially disrupted activity regulation at multiple timescales. Multiscale activity regulation requires a network of control nodes (e.g. the SCN) with normal feedback interactions. Disrupted correlation patterns suggest that the network cannot maintain the ideal system performance during misalignment between imposed abnormal behavioural cycles and the endogenous circadian rhythm. Therefore, the synchronization between behavioural cycles and SCN-imparted circadian rhythms is crucial for the normal function of the activity control network. Moreover, multiscale activity patterns may provide a useful tool for monitoring physiological conditions and health status of individuals who engage in shift work.
Supplementary Material
The study complies with the national guidelines for the care and use of experimental animals under Mexican law (Decreto de Ley de Protección a los Animales del Distrito Federal, Gaceta Oficial del DF, 26/02/02) and was approved by the committee for ethical evaluation at the Facultad de Medicina, Universidad Nacional Autónoma de México.
Funding statement
This work was supported by National Science Council of Taiwan grant no. NSC 102–2911-I-008–001 (Center for Dynamical Biomarkers and Translational Medicine, National Central University, Taiwan) (to W.H.H, M.T.L. and K.H.), NSC 102–2221-E-008–008 and joint foundation of CGH and NCU grant nos. CNJRF-101CGH-NCU-A4 and VGHUST103-G1–3–3 (to M.T.L.), Mexican grant no. CONACYT 79797 (to R.M.B.) and CONACYT 183078 (to R.S.D.), Mexican grant DGAPA IG-200314 (to C.E. and R.M.B.), NIH grant nos. T32-HL07901 (to B.P.P.), K24-HL76446 (to S.A.S.), K99-HL102241, R00-HL102241 and P01AG009975 (to K.H.) and P30-HL101299 and R01-HL094806 (to F.A.J.L.S.).
References
- 1.Hu K, Ivanov P, Chen Z, Hilton MF, Stanley HE, Shea SA. 2004. Non-random fluctuations and multi-scale dynamics regulation of human activity. Physica A 337, 307–318. ( 10.1016/j.physa.2004.01.042) [DOI] [PMC free article] [PubMed] [Google Scholar]
- 2.Amaral LAN, et al. 2004. Power law temporal auto-correlations in day-long records of human physical activity and their alteration with disease. Europhys. Lett. 66, 448–454. ( 10.1209/epl/i2003-10227-7) [DOI] [Google Scholar]
- 3.Anteneodo C, Chialvo DR. 2009. Unraveling the fluctuations of animal motor activity. Chaos 19, 033123 ( 10.1063/1.3211189) [DOI] [PMC free article] [PubMed] [Google Scholar]
- 4.Aybek S, Ionescu A, Berney A, Chocron O, Aminian K, Vingerhoets FJ. 2012. Fractal temporal organisation of motricity is altered in major depression. Psychiatry Res. 200, 288–293. ( 10.1016/j.psychres.2012.03.047) [DOI] [PubMed] [Google Scholar]
- 5.Chiesa JJ, Cambras T, Carpentieri AR, Diez-Noguera A. 2010. Arrhythmic rats after SCN lesions and constant light differ in short time scale regulation of locomotor activity. J. Biol. Rhythms 25, 37–46. ( 10.1177/0748730409352843) [DOI] [PubMed] [Google Scholar]
- 6.Hausdorff JM, Peng CK, Ladin Z, Wei JY, Goldberger AL. 1995. Is walking a random walk? Evidence for long-range correlations in stride interval of human gait. J. Appl. Physiol. 78, 349–358. [DOI] [PubMed] [Google Scholar]
- 7.Hu K, Scheer FA, Ivanov P, Buijs RM, Shea SA. 2007. The suprachiasmatic nucleus functions beyond circadian rhythm generation. Neuroscience 149, 508–517. ( 10.1016/j.neuroscience.2007.03.058) [DOI] [PMC free article] [PubMed] [Google Scholar]
- 8.Nakamura T, Kiyono K, Yoshiuchi K, Nakahara R, Struzik ZR, Yamamoto Y. 2007. Universal scaling law in human behavioral organization. Phys. Rev. Lett. 99, 138103 ( 10.1103/PhysRevLett.99.138103) [DOI] [PubMed] [Google Scholar]
- 9.Peng CK, Havlin S, Hausdorff JM, Mietus JE, Stanley HE, Goldberger AL. 1995. Fractal mechanisms and heart rate dynamics. Long-range correlations and their breakdown with disease. J. Electrocardiol. 28, 59–65. [DOI] [PubMed] [Google Scholar]
- 10.Goldberger AL, Amaral LA, Hausdorff JM, Ivanov P, Peng CK, Stanley HE. 2002. Fractal dynamics in physiology: alterations with disease and aging. Proc. Natl Acad. Sci. USA 99(Suppl. 1), 2466–2472. ( 10.1073/pnas.012579499) [DOI] [PMC free article] [PubMed] [Google Scholar]
- 11.Hu K, Van Someren EJ, Shea SA, Scheer FA. 2009. Reduction of scale invariance of activity fluctuations with aging and Alzheimer's disease: involvement of the circadian pacemaker. Proc. Natl Acad. Sci. USA 106, 2490–2494. ( 10.1073/pnas.0806087106) [DOI] [PMC free article] [PubMed] [Google Scholar]
- 12.Indic P, Salvatore P, Maggini C, Ghidini S, Ferraro G, Baldessarini RJ, Murray G. 2011. Scaling behavior of human locomotor activity amplitude: association with bipolar disorder. PLoS ONE 6, e20650 ( 10.1371/journal.pone.0020650) [DOI] [PMC free article] [PubMed] [Google Scholar]
- 13.Ohashi K, Bleijenberg G, van der Werf S, Prins J, Amaral LA, Natelson BH, Yamamoto Y. 2004. Decreased fractal correlation in diurnal physical activity in chronic fatigue syndrome. Methods Inf. Med. 43, 26–29. ( 10.1267/meth04010026) [DOI] [PubMed] [Google Scholar]
- 14.Hu K, Harper DG, Shea SA, Stopa EG, Scheer FA. 2013. Noninvasive fractal biomarker of clock neurotransmitter disturbance in humans with dementia. Sci. Rep. 3, 2229 ( 10.1038/srep02229) [DOI] [PMC free article] [PubMed] [Google Scholar]
- 15.Ivanov PC, Amaral LA, Goldberger AL, Havlin S, Rosenblum MG, Struzik ZR, Stanley HE. 1999. Multifractality in human heartbeat dynamics. Nature 399, 461–465. ( 10.1038/20924) [DOI] [PubMed] [Google Scholar]
- 16.Huikuri HV, Makikallio TH, Peng CK, Goldberger AL, Hintze U, Moller M. 2000. Fractal correlation properties of R–R interval dynamics and mortality in patients with depressed left ventricular function after an acute myocardial infarction. Circulation 101, 47–53. ( 10.1161/01.CIR.101.1.47) [DOI] [PubMed] [Google Scholar]
- 17.Makikallio AM, Makikallio TH, Korpelainen JT, Sotaniemi KA, Huikuri HV, Myllyla VV. 2004. Heart rate dynamics predict poststroke mortality. Neurology 62, 1822–1826. ( 10.1212/01.WNL.0000125190.10967.D5) [DOI] [PubMed] [Google Scholar]
- 18.Reppert SM, Weaver DR. 2002. Coordination of circadian timing in mammals. Nature 418, 935–941. ( 10.1038/nature00965) [DOI] [PubMed] [Google Scholar]
- 19.Weaver DR. 1998. The suprachiasmatic nucleus: a 25-year retrospective. J. Biol. Rhythms 13, 100–112. ( 10.1177/074873098128999952) [DOI] [PubMed] [Google Scholar]
- 20.Hastings MH, Reddy AB, Maywood ES. 2003. A clockwork web: circadian timing in brain and periphery, in health and disease. Nat. Rev. Neurosci. 4, 649–661. ( 10.1038/nrn1177) [DOI] [PubMed] [Google Scholar]
- 21.Erzberger A, Hampp G, Granada AE, Albrecht U, Herzel H. 2013. Genetic redundancy strengthens the circadian clock leading to a narrow entrainment range. J. R. Soc. Interface. 10, 20130221 ( 10.1098/rsif.2013.0221) [DOI] [PMC free article] [PubMed] [Google Scholar]
- 22.Buijs RM, Kalsbeek A. 2001. Hypothalamic integration of central and peripheral clocks. Nat. Rev. Neurosci. 2, 521–526. ( 10.1038/35081582) [DOI] [PubMed] [Google Scholar]
- 23.Pittman-Polletta BR, Scheer FA, Butler MP, Shea SA, Hu K. 2013. The role of the circadian system in fractal neurophysiological control. Biol. Rev. Camb. Philos. Soc. 88, 873–894. ( 10.1111/brv.12032) [DOI] [PMC free article] [PubMed] [Google Scholar]
- 24.Hu K, Meijer JH, Shea SA, vanderLeest HT, Pittman-Polletta B, Houben T, Oosterhout F, Scheer FAJL. 2012. Fractal patterns of neural activity exist within the suprachiasmatic nucleus and require extrinsic network interactions. PLoS ONE 7, e48927 ( 10.1371/journal.pone.0048927) [DOI] [PMC free article] [PubMed] [Google Scholar]
- 25.de la Iglesia HO, Cambras T, Schwartz WJ, Diez-Noguera A. 2004. Forced desynchronization of dual circadian oscillators within the rat suprachiasmatic nucleus. Curr. Biol. 14, 796–800. ( 10.1016/j.cub.2004.04.034) [DOI] [PubMed] [Google Scholar]
- 26.Granada AE, Cambras T, Diez-Noguera A, Herzel H. 2010. Circadian desynchronization. J. R. Soc. Interface Focus 1, 153–66. ( 10.1098/rsfs.2010.0002) [DOI] [PMC free article] [PubMed] [Google Scholar]
- 27.Akerstedt T, Kecklund G, Johansson SE. 2004. Shift work and mortality. Chronobiol. Int. 21, 1055–1061. ( 10.1081/LCBI-200038520) [DOI] [PubMed] [Google Scholar]
- 28.Davis S, Mirick DK, Stevens RG. 2001. Night shift work, light at night, and risk of breast cancer. J. Natl Cancer Inst. 93, 1557–1562. ( 10.1093/jnci/93.20.1557) [DOI] [PubMed] [Google Scholar]
- 29.Knutsson A. 2003. Health disorders of shift workers. Occup. Med. 53, 103–108. ( 10.1093/occmed/kqg048) [DOI] [PubMed] [Google Scholar]
- 30.Scheer FA, Hilton MF, Mantzoros CS, Shea SA. 2009. Adverse metabolic and cardiovascular consequences of circadian misalignment. Proc. Natl Acad. Sci. USA 106, 4453–4458. ( 10.1073/pnas.0808180106) [DOI] [PMC free article] [PubMed] [Google Scholar]
- 31.Weibel L, Brandenberger G. 1998. Disturbances in hormonal profiles of night workers during their usual sleep and work times. J. Biol. Rhythms 13, 202–208. ( 10.1177/074873098129000048) [DOI] [PubMed] [Google Scholar]
- 32.Salgado-Delgado R, Angeles-Castellanos M, Buijs MR, Escobar C. 2008. Internal desynchronization in a model of night-work by forced activity in rats. Neuroscience 154, 922–931. ( 10.1016/j.neuroscience.2008.03.066) [DOI] [PubMed] [Google Scholar]
- 33.Peng CK, Buldyrev SV, Havlin S, Simons M, Stanley HE, Goldberger AL. 1994. Mosaic organization of DNA nucleotides. Phys. Rev. E. Stat. Phys. Plasmas Fluids Relat. Interdiscip. Topics 49, 1685–1689. ( 10.1103/PhysRevE.49.1685) [DOI] [PubMed] [Google Scholar]
- 34.Chen Z, Ivanov P, Hu K, Stanley HE. 2002. Effect of nonstationarities on detrended fluctuation analysis. Phys. Rev. E Stat. Nonlin. Soft Matter Phys. 65, 041107 ( 10.1103/PhysRevE.65.041107) [DOI] [PubMed] [Google Scholar]
- 35.Hu K, Ivanov PC, Chen Z, Carpena P, Stanley HE. 2001. Effect of trends on detrended fluctuation analysis. Phys. Rev. E Stat. Nonlin. Soft Matter Phys. 64, 011114 ( 10.1103/PhysRevE.64.011114) [DOI] [PubMed] [Google Scholar]
- 36.Taqqu MS, Teverovsky V, Willinger W. 1995. Estimators for long-range dependence: an empirical study. Fractals 3, 785–788. ( 10.1142/S0218348X95000692) [DOI] [Google Scholar]
- 37.Penzel T, Kantelhardt JW, Grote L, Peter JH, Bunde A. 2003. Comparison of detrended fluctuation analysis and spectral analysis for heart rate variability in sleep and sleep apnea. IEEE Trans. Biomed. Eng. 50, 1143–1151. ( 10.1109/TBME.2003.817636) [DOI] [PubMed] [Google Scholar]
- 38.Scheer FA, Pirovano C, Van Someren EJ, Buijs RM. 2005. Environmental light and suprachiasmatic nucleus interact in the regulation of body temperature. Neuroscience 132, 465–477. ( 10.1016/j.neuroscience.2004.12.012) [DOI] [PubMed] [Google Scholar]
- 39.Leenaars CH, Dematteis M, Joosten RN, Eggels L, Sandberg H, Schirris M, Feenstra MG, Van Someren EJ. 2011. A new automated method for rat sleep deprivation with minimal confounding effects on corticosterone and locomotor activity. J. Neurosci. Methods 196, 107–117. ( 10.1016/j.jneumeth.2011.01.014) [DOI] [PubMed] [Google Scholar]
- 40.Novati A, Roman V, Cetin T, Hagewoud R, den Boer JA, Luiten PG, Meerlo P. 2008. Chronically restricted sleep leads to depression-like changes in neurotransmitter receptor sensitivity and neuroendocrine stress reactivity in rats. Sleep 31, 1579–1585. [DOI] [PMC free article] [PubMed] [Google Scholar]
- 41.Deboer T, Vansteensel MJ, Detari L, Meijer JH. 2003. Sleep states alter activity of suprachiasmatic nucleus neurons. Nat. Neurosci. 6, 1086–1090. ( 10.1038/nn1122) [DOI] [PubMed] [Google Scholar]
- 42.Acosta-Galvan G, et al. 2011. Interaction between hypothalamic dorsomedial nucleus and the suprachiasmatic nucleus determines intensity of food anticipatory behavior. Proc. Natl Acad. Sci. USA 108, 5813–5818. ( 10.1073/pnas.1015551108) [DOI] [PMC free article] [PubMed] [Google Scholar]
- 43.Ashkenazy Y, Ivanov PC, Havlin S, Peng CK, Goldberger AL, Stanley HE. 2001. Magnitude and sign correlations in heartbeat fluctuations. Phys. Rev. Lett. 86, 1900–1903. ( 10.1103/PhysRevLett.86.1900) [DOI] [PubMed] [Google Scholar]
- 44.Makarava N, Benmehdi S, Holschneider M. 2011. Bayesian estimation of self-similarity exponent. Phys. Rev. E Stat. Nonlin. Soft Matter Phys. 84, 021109 ( 10.1103/PhysRevE.84.021109) [DOI] [PubMed] [Google Scholar]
Associated Data
This section collects any data citations, data availability statements, or supplementary materials included in this article.