Figure 5.

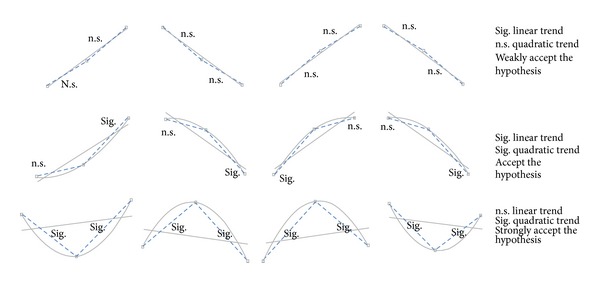
Schema of the listed situations and graphical representations of the linear-quadratic trend coexistence. Here, we illustrate linear or quadratic relationships among the three states regardless of Cartesian representation.

Schema of the listed situations and graphical representations of the linear-quadratic trend coexistence. Here, we illustrate linear or quadratic relationships among the three states regardless of Cartesian representation.