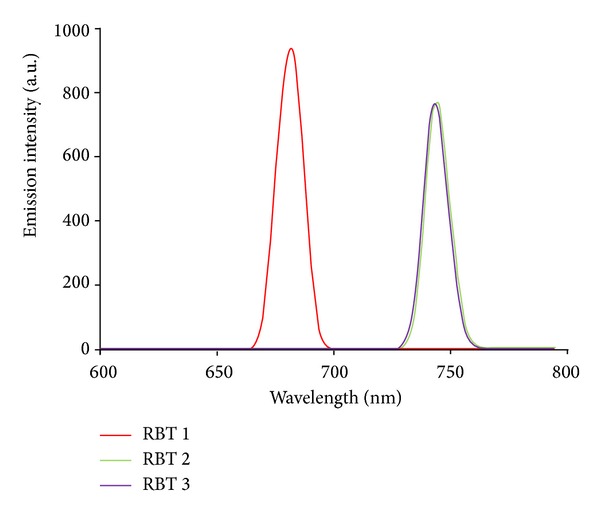
Figure 2.

Emission spectra of the RBT1 (red), RBT2 (green), and RBT3 (purple) complexes at a concentration of 0.001 g/dm−3 in (CH3Cl/MeOH, 1 : 1, v/v).

Emission spectra of the RBT1 (red), RBT2 (green), and RBT3 (purple) complexes at a concentration of 0.001 g/dm−3 in (CH3Cl/MeOH, 1 : 1, v/v).