Abstract
α-Keto acid of pefloxacin mesylate (PFLX) can form the complex with Terbium(III). The intramolecular energy from PFLX to Terbium(III) ion takes place when excited, and thus Terbium(III) excited state is formed and then emits the characteristic fluorescence of Terbium(III), locating at 490, 545, 580, and 620 nm. The second-order scattering (SOS) peak at 545 nm also appears for the complex with the exciting wavelength of 273 nm. When the silver nanoparticles are added to the system, the luminescence intensity at 545 nm greatly increased. So, with the adding of nanoparticles to the Terbium(III)-PFLX complex, not only is the intramolecular energy promoted but also the SOS intensity is enhanced. The experimental results show that it is the silver nanoparticles with certain size and certain concentration which can greatly enhance the fluorescence-SOS intensity, and the relative intensity at 545 nm is proportional to the amount of PFLX. Based on this phenomenon, a novel method for the determination of PFLX has been developed and applied to the determination of PFLX in capsule and serum samples.
1. Introduction
In recent years, researches on noble metals nanoparticles have got considerable attention in chemistry and physics [1–3] especially silver nanoparticles, which exhibit an enhancement of some potential properties including electrical conductivity [4], catalysis [5, 6], magnetic and optical polarizability [7], photonic technologies [8–11], and antimicrobial activity in surface-enhanced Raman scattering (SERS) [12]. Particle size may influence the physical properties of silver nanoparticles [13–15]. With the progress of nanotechnologies and the spectrum theories, more studies have been attracted to the luminescence of the role of silver nanoparticles [16, 17].
Terbium ions have unique fluorescent properties when complexed with organic ligands. The strong ion emission of these complexes originates from an intrachelate energy transfer from the triplet state of the ligand to the excited energy levels of the lanthanide ion. Methods for the determination of several organic compounds, which serve as energy donors to Terbium ions, have been developed [24].
Ofloxacin (OFLX), (±)9-fluoro-2,3-dihydro-3-methyl-10-(4-methyl-1-piperaziny)-7H-oxo-7H-pyrido[1,2,3-de]-1,4-benzoxazine-6-carboxylic acid (as shown in Figure 1), is one of the third-generation members of quinolone synthetic antibiotics, with a broad spectrum of activity against Gram-positive and Gram-negative bacteria [25, 26]. It is widely used in therapies against inflammation [27]. The drug's effect is concentration dependent and its antibacterial effect is closely related to its plasma concentration.
Figure 1.

Structural formulae of the PFLX (I) and OFLX (II).
Pefloxacin mesylate (PFLX), 1-ethyl-6-fluoro-1, 4-dihydro-7-(4-methylpiperazin-1-yl)-4-oxoquinolone-3-carboxylic acid (as shown in Figure 1), is a fluoroquinolone antibacterial agent. It is used for the treatment for diseases of the skin and various kinds of urinary tract infections [28] and has been widely applied in clinical medicine. Determination methods for PFLX include spectrofluorometry [24, 29, 30], HPLC [31], TLC-fluorescence [32], and capillary electrophoresis [33, 34]. But using the silver nanoparticlessensitized fluorescence and second-order scattering (SOS) for the determination of PFLX has not been reported.
In this paper, the influence of silver nanoparticles on the SOS and fluorescence of Terbium(Tb)(III)-PFLX complex is studied through using the SOS and fluorescence spectrum. The results show that the size and concentration of nanoparticles can greatly affect the fluorescence-SOS intensity of the complex. Based on this phenomenon, a novel method has been developed for the determination of PFLX, and the determination comparison between PFLX and OFLX is also proposed.
2. Material and Methods
2.1. Apparatus
A transmission electron microscopy (TEM) image of the silver nanoparticles was acquired using a Hitachi H-600 (Japan) transmission electron microscope. A Shimadzu RF-5301 PC spectrofluorometer (Japan) was used for fluorometric and SOS measurements. All absorption spectra were recorded with a Cintra 10e UV-vis spectrophotometer (GBC). A 420A plus pH meter (Orion Research Inc) is used to measure pH of the solutions. All reagents were of analytical reagents grade and doubly distilled water was used throughout.
Stock standard solution (1.0 × 10⁻³ M) of PFLX and OFLX (Institute of Medical Biotechnology, Beijing, China) was prepared by dissolving them in proper solvent (dilute acid or alkali) and then was diluted to the desired concentration with water.
2.2. Reagents
A standard stock solution of the Tb(III) ion (1.0 × 10⁻² M) is prepared by dissolving 934.5 mg Tb4O7 in 15 mL HCl (12 M) at 100°C and evaporating the solution to be almost dry; it is then diluted to 500 mL with water.
The preparation of the silver colloids followed the same procedure as originally proposed by Lee and Meisel [35]. AgNO3 is used as precursor of silver nanoparticles and sodium citrate is used as both reducing and protecting reagent. A concentration of 1.0 × 10⁻⁴ M colloidal solution is prepared in terms of the silver atoms. The morphology and size distribution of silver nanoparticles are obtained by a transmission electron microscopy (TEM) and were shown in Figure 2. The particles are almost spherical with a mean diameter of 42 nm, and the silver nanoparticles had an absorption maximum at 420 nm, which is consistent with the literature [35].
Figure 2.
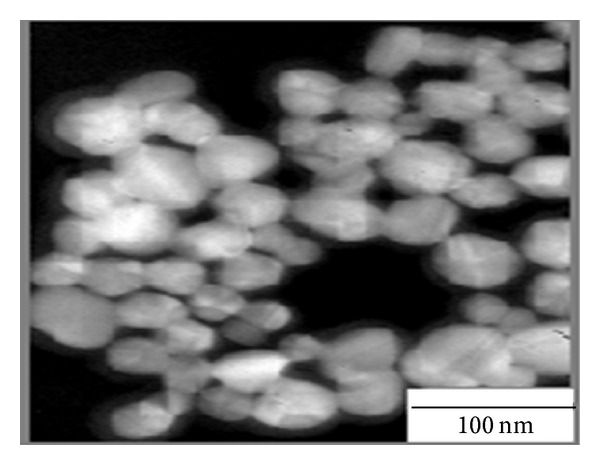
TEM image of the silver nanoparticles.
The drug content of five capsules is weighed, finely powdered, and mixed. The average mass per capsule can be determined. Transfer an accurately weighted amount of the powder equivalent to 200 mg corresponding to one capsule into a 100 mL calibrated dark flask, in which the deionized water is added to dissolve the powder. The solution is then filtered so as to separate out the insoluble excipients. The desired concentration for the drug thus is obtained by accurate dilution with deionized water and the analysis is followed up as the general analytical procedure.
2.3. Procedures
As for a 10 mL test tube, 1.0 mL of HAc-NaAc buffer solution, 0.2 mL of 1.0 × 10⁻² M Tb(III) ion solution, and an appropriate working solution or sample solution of PFLX, followed by 0.5 mL of 1.0 × 10⁻⁴ M silver nanoparticles are added. This mixture is diluted to 10 mL with water, mixed thoroughly, and stood for 25 min.
The SOS intensity is recorded with the different excited wavelength from 220 to 400 nm and reached the maximum at 545 nm with λ ex = 273 nm. The enhanced SOS and fluorescence intensities are represented as ΔI = I − I0; here, I and I0 are the intensities of the system with and without PFLX or OFLX. All the data are obtained with 5.0 nm excitation and emission silt-widths.
3. Results and Discussion
3.1. UV-Vis Spectrum
UV-vis absorption spectra of the system (Figure 3) are recorded. It can be found that the absorption peaks at 275 nm and 323 nm for Tb(III)-PFLX complex increased along with adding silver nanoparticles to the system, and the absorption peak at 420 nm for the nanoparticles appeared. The results indicate that there exist interactions between Tb(III)-PFLX and silver nanoparticles and it can be concluded that silver nanoparticles incorporate with the complex of Tb(III)-PFLX, while the particle aggregates are formed in the ternary complex [16].
Figure 3.
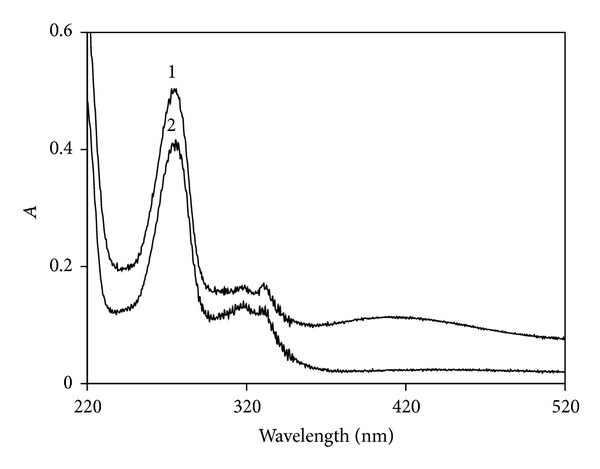
UV-vis absorption spectra. (1) Silver nanoparticles-Tb(III)-PFLX; (2) Tb(III)-PFLX. Conditions: silver nanoparticles, 5.0 × 10⁻⁶ M; Tb(III), 2.0 × 10⁻⁴ M; PFLX, 1.0 × 10⁻⁶ M.
3.2. Second-Order Scattering Spectra and Fluorescence Spectra
α-Keto acid of PFLX supplies a coordination site binding to Tb(III) ion and has two aromatic rings that can absorb energy, resulting in intramolecular energy from PFLX to Tb(III) ions; thus, Tb(III) excited state is formed and then emits the characteristic emission of Tb(III), locating at 490, 545, 580, and 620 nm, corresponding to the transitions of the Tb(III) 5D4 → 7F6, 5D4 → 7 F5, 5D4 → 7F4, and 5D4 → 7F3, respectively [36]. The maximum fluorescence peak locates at 545 nm when it is excited; the silver nanoparticles can enhance the fluorescence of Tb(III)-PFLX complex, especially at 545 nm. At the same time, the SOS peak is also enhanced at 545 nm when the excited wavelength is at 273 nm, so the intensities conclude the fluorescence and SOS intensity. Figure 4 shows the fluorescence and SOS spectra, and the UV-35 filter is added to eliminate the scattering of the system [37].
Figure 4.
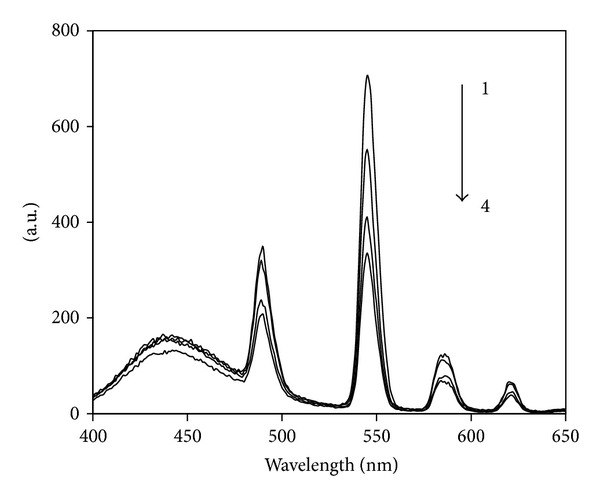
The fluorescence and second-order scattering spectra. (1) Silver nanoparticles-Tb(III)-PFLX (without filter), (2) silver nanoparticles-Tb(III)-PFLX (with filter), (3) Tb(III)-PFLX (without filter), and (4) Tb(III)-PFLX (with filter); λ ex = 273 nm. Conditions: silver nanoparticles, 5.0 × 10⁻⁶ M; Tb(III), 2.0 × 10⁻⁴ M; PFLX, 1.0 × 10⁻⁶ M.
3.3. Comparison between Silver Nanoparticles-Tb(III)-PFLX and Silver Nanoparticles-Tb(III)-OFLX System
From the fluorescence-SOS spectra above, the difference between silver nanoparticles-Tb(III)-PFLX and silver nanoparticles-Tb(III)-OFLX system could be observed (as shown in Figure 5). Silver nanoparticles can enhance the fluorescence-SOS intensity at 545 nm of Tb(III)-PFLX complex, while it can slightly increase the intensity of Tb(III)-OFLX system.
Figure 5.
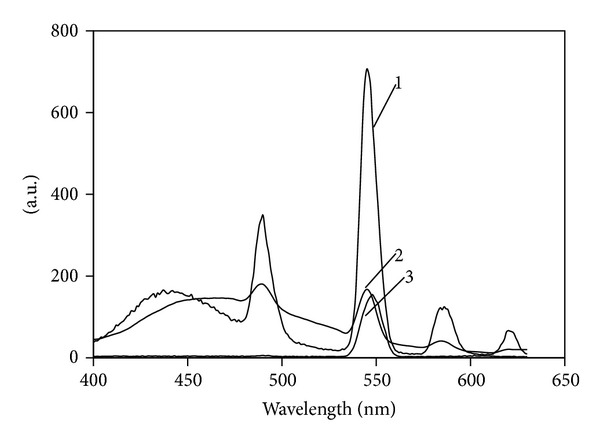
The fluorescence and second-order scattering spectra of PFLX and OFLX. (1) Silver nanoparticles-Tb(III)-PFLX, (2) silver nanoparticles-Tb(III)-OFLX, and (3) silver nanoparticles-Tb(III). Conditions: silver nanoparticles, 5.0 × 10⁻⁶ M; Tb(III), 2.0 × 10⁻⁴ M; PFLX and OFLX, 1.0 × 10⁻⁶ M.
The observed spectral differences seem to be dependent on the structural variation of the fluoroquinolone and especially on the nature of the N1 substituent. The benzoxazine group of OFLX appears as an efficient electron-attracting system acting as a quencher of the fluorescence process. In contrast, the PFLX system has strong intensity owing to the electron-donating character of the N1 ethyl substituent [38]. The molecular structures of PFLX and OFLX are shown in Figure 1.
On the other hand, according to the theory of “the trivial of radiative mechanism for electronic energy transfer” [39], the efficiency of energy transfer is related to the capability of absorbing photon (ε) for donor and the overlap of the emission spectrum of donor and the absorption spectrum of acceptor. In Tb(III)-PFLX and Tb(III)-OFLX complexes, ε PFLX > ε OFLX, at the same time, the emission spectrum of PFLX has a larger overlap with the absorption spectrum of Tb(III) than that of OFLX (see Figure 6); thus the efficiency of energy transfer of Tb(III)-PFLX system is much higher than that of Tb(III)-OFLX system, resulting in notable difference between them when the silver nanoparticles are added.
Figure 6.
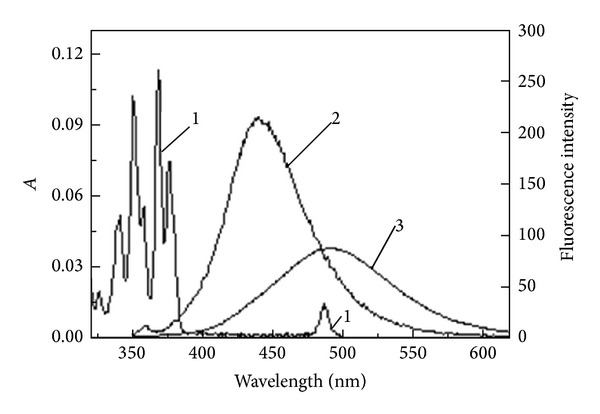
Absorption spectrum of Tb(III) (1) and emission spectra of PFLX (2) and OFLX (3) Conditions: Tb(III), 2.0 × 10⁻⁴ M; PFLX and OFLX, 1.0 × 10⁻⁶ M.
3.4. Influence of pH
Fluorescence and SOS intensity of the system is pH dependent. The effect of pH was investigated over the range of 3.0–8.0, and the optimum pH is about 6.0. Then a HAc-NaAc buffer solution of pH 6.0 with a concentration of 0.1 M was found to be suitable for the measurements. Maybe the reason is that Ac− replaces H2O which quenches fluorescence of the Tb(III) complex and incorporates with Tb(III)-PFLX complex [40].
3.5. Effect of Tb(III) Ion Concentration
The effect of Tb(III) ion concentration in the range from 1.0 × 10⁻⁵ to 5.0 × 10⁻⁴ M on the analytical signal for the system was studied. As the concentration of Tb(III) ion increased, the relative intensity was enhanced; when the concentration was over 2.0 × 10⁻⁴ M, the relative intensity remains constant. So a Tb(III) ion concentration of 2.0 × 10⁻⁴ M was selected for further research.
3.6. Effect of Silver Nanoparticles Concentration
From the experiments, it can be inferred that not only the size but also the concentration of nanoparticles (namely, the numbers of particles in the unit volume) can affect the luminescence intensity of the system. The silver nanoparticles are prepared by AgNO3 solutions of 1.0 × 10⁻³ M, 1.0 × 10⁻⁴ M, and 1.0 × 10⁻⁵ M, respectively. The results show that if AgNO3 was 1.0 × 10⁻³ M, the silver nanoparticles have very high SOS scattering and the relative intensity is not proportional to the concentration of drug; if AgNO3 is 1.0 × 10⁻⁵ M, the scattering intensity of silver nanoparticles was very low and the fluorescence-SOS could not be enhanced by the silver nanoparticles. The silver nanoparticles are suitable for this system if AgNO3 is 1.0 × 10⁻⁴ M and the mean diameter is 42 nm, and thus they are chosen in the experiments.
Fixing the size of silver nanoparticles mentioned above, the effects of the concentration on the intensity of SOS and fluorescence are also studied. A concentration of 5.0 × 10⁻⁶ M of silver nanoparticles is used for further experiments.
4. Stability
Under the optimum conditions, the results showed that ΔI reached a maximum after all reagents were mixed for 25 min and the intensity was stable for at least 3 h, so that 25 min was set as the standard for all the SOS and fluorescence measurements.
4.1. Tolerance of Foreign Substances
In order to assess the possibility of analytical application of the method, the effects of some common excipients, metal ions, and organic compounds on signals intensity are investigated. The tolerable concentration ratios for the interference are <±5%. The results are presented in Table 1. It can be seen from Table 1 that most of metal ions can be allowed at higher concentrations, but some organic species such as myoglobin, Vitamin B1, and uric acid have a relatively high interference. In sample determinations, starch and dextrin which exist in capsules can be eliminated through filtration, while in the serum samples, ZnSO4 and Ba(OH)2 can be added in order to precipitate the interference before the determination [40]. So it can be successfully applied to determine PFLX in capsules and serum samples.
Table 1.
Tolerance of coexisting substancea.
| Substance | Concentration coexisting (×10−6 M) | Intensity change (%) | Substance | Concentration coexisting (×10−6 M) | Intensity change (%) |
|---|---|---|---|---|---|
| Hemoglobin | 10b | +0.4 | Fe3+, NO3 − | 10 | +3.4 |
| Myoglobin | 1b | −0.1 | Mg2+, SO4 2− | 1000 | +2.4 |
| Vitamin B1 | 5b | −4.7 | NH4 +, Cl− | 10000 | +4.5 |
| Glucose | 500b | +4.8 | K+, Cl− | 1000 | −1.3 |
| Fructose | 500b | +4.4 | Co2+, SO4 2− | 100 | −1.1 |
| Starch | 100b | +4.0 | Na+, Cl− | 10000 | +4.6 |
| β-alanine | 100b | −0.7 | Mn2+, SO4 2− | 1000 | +4.8 |
| β-CD | 100b | +2.7 | Cd2+, Ac− | 100 | −3.2 |
| Uric acid | 5 | −2.6 | Zn2+, SO4 2− | 100 | −0.7 |
| β-dextrin | 50 | +1.2 | Pb2+, NO3 − | 100 | +1.9 |
| Al3+, SO4 2− | 10 | +5.1 | K+, H2PO4 − | 10 | +4.1 |
| Ni2+, NO3 − | 10 | +3.0 | Cr3+, Cl− | 100 | −4.0 |
| Cu2+, SO4 2− | 10 | −4.9 | Ca2+, Cl− | 1000 | +4.8 |
aConditions: PFLX, 1.0 × 10⁻⁶ M; Tb(III) ion, 2.0 × 10⁻⁴ M; silver nanoparticles, 5.0 × 10⁻⁶ M; pH, 6.0 × 10⁻⁶ g mL−1.
4.2. Calibration and Detection Limitation
The calibration graphs for the determination of PFLX are conducted under the optimal conditions, and the results are given in Table 2. The detection limit (3σ) is 2.5 × 10⁻¹⁰ M for PFLX.
Table 2.
Analytical parameters for the determination of PFLX.
| Linear range (×10−7 M) | Linear regression equation (c × 10−7 M)a | r b | LODc (3σ, ×10−10 M) | |
|---|---|---|---|---|
| PFLX | 0.008~10.0 | ΔI = 7229.5c − 9.2828 | 0.9991 | 2.5 |
| 10.0~80.0 | ΔI = 4653c + 419.95 | 0.9973 |
aΔI is the enhanced intensity of SOS and fluorescence.
bCorrelation coefficient.
cDetection limit.
4.3. Samples Determination
The proposed method is applied to the determination of PFLX in capsules and compared with UV-vis method; the results are given in Table 3. There are no significant differences between labeled contents and those obtained by this method. Recoveries range from 98.8% to 104.0%.
Table 3.
Results for the determination of PFLX in capsules (n = 5).
| Sample | Labeled (mg) | Amount found ± R.S.D.% | Added (×10−7 M) | Found (×10−7 M) | Recovery ± R.S.D (%) | |
|---|---|---|---|---|---|---|
| This method | UV-method | |||||
| PFLX (capsule 1) | 200.0 | 200.4 ± 3.6 | 197.2 ± 1.2 | 1.00 | 1.04 | 104.0 ± 3.60 |
| 2.00 | 2.04 | 102.0 ± 2.90 | ||||
| 4.00 | 4.06 | 101.5 ± 2.92 | ||||
|
| ||||||
| PFLX (capsule 2) | 200.0 | 200.2 ± 1.5 | 196.9 ± 3.9 | 6.00 | 6.10 | 101.7 ± 2.46 |
| 8.00 | 8.20 | 102.5 ± 3.63 | ||||
| 10.00 | 9.88 | 98.8 ± 3.92 | ||||
Moreover, analytical recoveries were assessed by analyzing serum samples which contain PFLX and required only separation of the precipitated protein with centrifugation [41]. In order to make the sample concentrations of the drug within the linear range of the determination, serum samples were properly diluted and the recoveries were determined by the standard addition method [42]. The results are shown in Table 4.
Table 4.
Analytical recoveries of PFLX in serum samples (n = 5).
| PFLX | Added (×10−8 M) | Found (×10−8 M) | Recovery ± R.S.D. (%) |
|---|---|---|---|
| Serum 1 | 1.00 | 1.03 | 103.0 ± 3.21 |
| 2.00 | 2.03 | 101.5 ± 3.89 | |
| 3.00 | 3.02 | 100.7 ± 4.53 | |
|
| |||
| Serum 2 | 3.00 | 3.12 | 104.0 ± 3.96 |
| 5.00 | 4.79 | 95.8 ± 2.43 | |
| 7.00 | 6.92 | 98.8 ± 3.36 | |
5. Conclusion
The proposed silver nanoparticles sensitized fluorescence and SOS method for the determination of PFLX is simple, rapid, and could be easily automated. At the same time, this method shows high sensitivity and wide linear response for the determination of PFLX; the sensitivity of this method is higher than that of most other methods summarized in Table 5. Since nanoparticles have unique physical and chemical properties, applications of nanoparticles in analytical chemistry are very potential. But the mechanism needs further study.
Table 5.
Common methods for the determination of PFLX.
| probe | Limit of determination (3σ) | Method of detection | Reference |
|---|---|---|---|
| Water-soluble CdTe quantum dots | 1.3 × 10⁻⁸ g/mL | Fluorescence | [18] |
| Terbium(III) | 3.2 × 10⁻⁹ g/mL | Fluorescence | [19] |
| La(III) | 2.8 × 10⁻⁹ g/mL | Fluorescence | [20] |
| Ce4+-Na2SO3-H2SO4 | 2.0 × 10⁻⁸ g/mL | Chemiluminescence | [21] |
| SDS-Terbium(III) | 3.0 × 10⁻⁹ mol/L | Fluorescence | [22] |
| (1 × 10⁻⁹ g/mL) | |||
| Charge-transfer reaction | 5.46 × 10⁻⁶ g/mL | Spectrophotometry | [23] |
| Silver nanoparticle-Terbium(III) | 2.5 × 10⁻¹⁰ mol/L | Fluorescence and second-order scattering | This paper |
| (0.8 × 10⁻¹⁰ g/mL) |
Acknowledgments
The project is supported by the National Nature Science Foundation of China (20331010), and the author is thankful to Beijing Normal University for providing laboratory and computational facilities.
Conflict of Interests
No conflict of interests is involved in this paper.
References
- 1.Grover VA, Hu J, Engates KE, Shipley HJ. Adsorption and desorption of bivalent metals to hematite nanoparticles. Environmental Toxicology and Chemistry. 2012;31(1):86–92. doi: 10.1002/etc.712. [DOI] [PubMed] [Google Scholar]
- 2.De Giacomo A, Dell'Aglio M, Santagata A, Gaudiuso R, De Pascale O, Wagener P. Cavitation dynamics of laser ablation of bulk and wire-shaped metals in water during nanoparticles production. Physical Chemistry Chemical Physics. 2013;15:3083–3092. doi: 10.1039/c2cp42649h. [DOI] [PubMed] [Google Scholar]
- 3.Ivask A, Bondarenko O, Jepihhina N, Kahru A. Profiling of the reactive oxygen species-related ecotoxicity of CuO, ZnO, TiO2, silver and fullerene nanoparticles using a set of recombinant luminescent Escherichia coli strains: differentiating the impact of particles and solubilised metals. Analytical and Bioanalytical Chemistry. 2010;398(2):701–716. doi: 10.1007/s00216-010-3962-7. [DOI] [PubMed] [Google Scholar]
- 4.Wang H, Qiao X, Chen J, Ding S. Preparation of silver nanoparticles by chemical reduction method. Colloids and Surfaces A: Physicochemical and Engineering Aspects. 2005;256(2-3):111–115. [Google Scholar]
- 5.Jose Luis M-M, Maria del Mar G-M, Francisco G-M, et al. Catalysis and inactivation of tyrosinase in its action on o-diphenols, o-aminophenols and o-phenylendiamines: potential use in industrial applications. Journal of Molecular Catalysis B: Enzymatic. 2013;91:17–24. [Google Scholar]
- 6.Hayes SJ, Knight DW, Menzies MD, O’Halloran M, Tan W-F. An efficient furan synthesis using heterogeneous catalysis. Tetrahedron Letters. 2007;48(43):7709–7712. [Google Scholar]
- 7.Liu F-K, Ko F-H, Huang P-W, Wu C-H, Chu T-C. Studying the size/shape separation and optical properties of silver nanoparticles by capillary electrophoresis. Journal of Chromatography A. 2005;1062(1):139–145. doi: 10.1016/j.chroma.2004.11.010. [DOI] [PubMed] [Google Scholar]
- 8.Fu HY, Chen DR, Cai ZP. Fiber sensor systems based on fiber laser and microwave photonic technologies. Sensors. 2012;12:5395–5419. doi: 10.3390/s120505395. [DOI] [PMC free article] [PubMed] [Google Scholar]
- 9.Ullah MH, Il K, Ha C-S. Preparation and optical properties of colloidal silver nanoparticles at a high Ag+ concentration. Materials Letters. 2006;60(12):1496–1501. [Google Scholar]
- 10.Lai CP, Alan N, Peter O, et al. Energy-efficient colourless photonic technologies for next-generation DWDM metro and access networks. Proceedings of the International Conference on Photonics in Switching (PS '12); September 2012. [Google Scholar]
- 11.Tuthill P, Jovanovic N, Lacour S, et al. Photonic technologies for a pupil remapping interferometer. Optical and Infrared Interferometry II; July 2010; [Google Scholar]
- 12.Dong C, Yan Z, Kokx J, Chrisey DB, Dinu CZ. Antibacterial and surface-enhanced Raman scattering (SERS) activities of AgCl cubes synthesized by pulsed laser ablation in liquid. Applied Surface Science. 2012;258:9218–9222. [Google Scholar]
- 13.Mwilu SK, El Badawy AM, Karen B, et al. Changes in silver nanoparticles exposed to human synthetic stomach fluid: effects of particle size and surface chemistry. Science of the Total Environment. 447:90–98. doi: 10.1016/j.scitotenv.2012.12.036. [DOI] [PubMed] [Google Scholar]
- 14.Hegde S, Kapoor S, Joshi S, Mukherjee T. Self-assembly of Ag nanoparticle-biotin composites into long fiberlike microstructures. Journal of Colloid and Interface Science. 2006;297(2):637–643. doi: 10.1016/j.jcis.2005.11.029. [DOI] [PubMed] [Google Scholar]
- 15.Oliveira MM, Ugarte D, Zanchet D, Zarbin AJG. Influence of synthetic parameters on the size, structure, and stability of dodecanethiol-stabilized silver nanoparticles. Journal of Colloid and Interface Science. 2005;292(2):429–435. doi: 10.1016/j.jcis.2005.05.068. [DOI] [PubMed] [Google Scholar]
- 16.Nabika H, Deki S. Enhancing and quenching functions of silver nanoparticles on the luminescent properties of europium complex in the solution phase. Journal of Physical Chemistry B. 2003;107(35):9161–9164. [Google Scholar]
- 17.Jiménez JA, Lysenko S, Liu H, Fachini E, Cabrera CR. Investigation of the influence of silver and tin on the luminescence of trivalent europium ions in glass. Journal of Luminescence. 2010;130(1):163–167. [Google Scholar]
- 18.Zhao Y, Gao LJ, Sun XH, Chai HM. Determination of pefloxacin mesylate by water-soluble CdTe quantum dots. Chinese Journal of Spectroscopy Laboratory. 2012;29:1749–1752. [Google Scholar]
- 19.Li GZ, Li GZ. Fluorescence characteristics of Tb3+-pefloxacin and its application. Chinese Rare Earths. 2002;6:21–23. [Google Scholar]
- 20.Li GZ, Liu YM, Li GZ. Study on fluorescence characteristics of Pefloxaein-La(III) complex and its application. Spetrooscopy and Spectral Analysis. 2004;24:1086–1088. [PubMed] [Google Scholar]
- 21.Wang R-P, Wu Y-J, Zhai S-M, Li J-J, Zheng W. Chemiluminescent determination of pefloxacin mesylate. Chinese Journal of Antibiotics. 2009;34(6):383–384. [Google Scholar]
- 22.Liao L, Cao XM, Du LM, Wu H. Determination of Pefloxaein by terbium(III) ion fluorescence probe sensitized by the surfaetant. Journal of Analytical Science. 2008;24:95–97. [Google Scholar]
- 23.Zhang SB, Lin HH. Spectrophotometric determination of pefloxacin mesylate based on the charge-transfer reaction. Huaxue Shi. 2009;31:625–627. [Google Scholar]
- 24.Veiopoulou CJ, Ioannou PC, Lianidou ES. Application of terbium sensitized fluorescence for the determination of fluoroquinolone antibiotics pefloxacin, ciprofloxacin and norfloxacin in serum. Journal of Pharmaceutical and Biomedical Analysis. 1997;15(12):1839–1844. doi: 10.1016/s0731-7085(96)02041-9. [DOI] [PubMed] [Google Scholar]
- 25.Swoboda S, Oberdorfer K, Klee F, Hoppe-Tichy T, von Baum H, Geiss HK. Tissue and serum concentrations of levofloxacin 500 mg agministered intravenously or orally for antibiotic prophylaxis in biliary surgery. Journal of Antimicrobial Chemotherapy. 2003;51(2):459–462. doi: 10.1093/jac/dgk056. [DOI] [PubMed] [Google Scholar]
- 26.Samanidou VF, Demetriou CE, Papadoyannis IN. Direct determination of four fluoroquinolones, enoxacin, norfloxacin, ofloxacin, and ciprofloxacin, in pharmaceuticals and blood serum by HPLC. Analytical and Bioanalytical Chemistry. 2003;375(5):623–629. doi: 10.1007/s00216-003-1749-9. [DOI] [PubMed] [Google Scholar]
- 27.Ooishi M, Miyao M. Antibiotic sensitivity of recent clinical isolates from patients with ocular infections. Ophthalmologica. 1997;211(1):15–24. doi: 10.1159/000310881. [DOI] [PubMed] [Google Scholar]
- 28.Beltagi AM. Determination of the antibiotic drug pefloxacin in bulk form, tablets and human serum using square wave cathodic adsorptive stripping voltammetry. Journal of Pharmaceutical and Biomedical Analysis. 2003;31(6):1079–1088. doi: 10.1016/s0731-7085(02)00656-8. [DOI] [PubMed] [Google Scholar]
- 29.El-Kommos ME, Saleh GA, El-Gizawi SM, Abou-Elwafa MA. Spectrofluorometric determination of certain quinolone antibacterials using metal chelation. Talanta. 2003;60(5):1033–1050. doi: 10.1016/S0039-9140(03)00171-1. [DOI] [PubMed] [Google Scholar]
- 30.Du LM, Yao HY, Fu M. Spectrofluorimetric study of the charge-transfer complexation of certain fluoroquinolones with 7,7,8,8-tetracyanoquinodimethane. Spectrochimica Acta A: Molecular and Biomolecular Spectroscopy. 2005;61(1-2):281–286. doi: 10.1016/j.saa.2004.04.016. [DOI] [PubMed] [Google Scholar]
- 31.Santoro MIRM, Kassab NM, Singh AK, Kedor-Hackmam ERM. Quantitative determination of gatifloxacin, levofloxacin, lomefloxacin and pefloxacin fluoroquinolonic antibiotics in pharmaceutical preparations by high-performance liquid chromatography. Journal of Pharmaceutical and Biomedical Analysis. 2006;40(1):179–184. doi: 10.1016/j.jpba.2005.06.018. [DOI] [PubMed] [Google Scholar]
- 32.Wang P-L, Feng Y-L, Chen L. Simultaneous determination of trace norfloxacin, pefloxacin, and ciprofloxacin by TLC-fluorescence spectrodensitometry. Microchemical Journal. 1997;56(2):229–235. [Google Scholar]
- 33.Yang Z, Wang X, Qin W, Zhao H. Capillary electrophoresis-chemiluminescence determination of norfloxacin and prulifloxacin. Analytica Chimica Acta. 2008;623(2):231–237. doi: 10.1016/j.aca.2008.06.023. [DOI] [PubMed] [Google Scholar]
- 34.Fierens C, Hillaert S, Van den Bossche W. The qualitative and quantitative determination of quinolones of first and second generation by capillary electrophoresis. Journal of Pharmaceutical and Biomedical Analysis. 2000;22(5):763–772. doi: 10.1016/s0731-7085(99)00282-4. [DOI] [PubMed] [Google Scholar]
- 35.Lee PC, Meisel D. Adsorption and surface-enhanced Raman of dyes on silver and gold sols. Journal of Physical Chemistry. 1982;86(17):3391–3395. [Google Scholar]
- 36.Tieli Z, Huichun Z, Linpei J. Photochemical fluorescence enhancement of the terbium-lomefloxacin complex and its application. Talanta. 1999;49(1):77–82. doi: 10.1016/s0039-9140(98)00364-6. [DOI] [PubMed] [Google Scholar]
- 37.Chen GZ, Huang XZ, Zheng ZZ, Xu JG, Wang ZB. Fluorescence Analysis Method. Beijing, China: Science Press; 1990 (Chinese) [Google Scholar]
- 38.Rieutorda A, Vazquezb L, Soursaca M, et al. Fluoroquinolones as sensitizers of lanthanide fluorescence: application to the liquid chromatographic determination of ciprofloxacin using terbium. Analytica Chimica Acta. 1994;290:215–225. [Google Scholar]
- 39.Turro NJ. Modern Molecular Photochemistry. Benjamin/Cummings Publishing; 1978. [Google Scholar]
- 40.DiBella EE, Weissman JB, Joseph MJ, Schultz JR, Wenzel TJ. Lanthanide ions as luminescent chromophores for liquid chromatographic detection. Journal of Chromatography A. 1985;328:101–109. doi: 10.1016/s0021-9673(00)94587-4. [DOI] [PubMed] [Google Scholar]
- 41.Huang Y, Zhang C, Zhang X, Zhang Z. Chemiluminescence analysis of menadione sodium bisulfite and analgin in pharmaceutical preparations and biological fluids. Journal of Pharmaceutical and Biomedical Analysis. 1999;21(4):817–825. doi: 10.1016/s0731-7085(99)00191-0. [DOI] [PubMed] [Google Scholar]
- 42.Kenner CT, Bush KW. Quantitative Analysis. New York, NY, USA: Macmillan; 1979. [Google Scholar]


