

Abstract
Most malaria infections contain complex mixtures of distinct parasite lineages. These multiple-genotype infections (MGIs) impact virulence evolution, drug resistance, intra-host dynamics, and recombination, but are poorly understood. To address this we have developed a single-cell genomics approach to dissect MGIs. By combining cell sorting and whole-genome amplification (WGA), we are able to generate high-quality material from parasite-infected red blood cells (RBCs) for genotyping and next-generation sequencing. We optimized our approach through analysis of >260 single-cell assays. To quantify accuracy, we decomposed mixtures of known parasite genotypes and obtained highly accurate (>99%) single-cell genotypes. We applied this validated approach directly to infections of two major malaria species, Plasmodium falciparum, for which long term culture is possible, and Plasmodium vivax, for which no long-term culture is feasible. We demonstrate that our single-cell genomics approach can be used to generate parasite genome sequences directly from patient blood in order to unravel the complexity of P. vivax and P. falciparum infections. These methods open the door for large-scale analysis of within-host variation of malaria infections, and reveal information on relatedness and drug resistance haplotypes that is inaccessible through conventional sequencing of infections.
Infections with micro-organisms almost uniformly show within-host genetic diversity. This impacts disease pathology and influences a wide range of life-history traits (Frank 1996). In malaria, multiple genotype infections (MGIs) are ubiquitous in regions of high endemicity (Anderson et al. 2000; Arnott et al. 2012), whereas both human and nonhuman primate infections may contain multiple genotypes of several malaria species (Lee et al. 2011). MGIs are predicted to drive the spread of drug resistance (Hastings 2006; Huijben et al. 2011), the evolution of virulence (Bell et al. 2006), and determine the rate of recombination (Conway et al. 1999) and intrahost dynamics (de Roode et al. 2005). Accurate description of the component genotypes within MGIs is therefore critical. However, this is a major challenge. Genotyping or deep sequencing of infections provides only limited information, because haplotypes cannot be accurately reconstructed. Although diversity at individual loci provides a minimum estimate of genotypes present, the actual numbers of genotypes present, and their relationships and relative abundance within infections cannot currently be determined. Furthermore, most malaria species cannot be maintained in a long-term culture (e.g., P. vivax [Noulin et al. 2013], P. ovale, and P. malariae), precluding dilution cloning of component parasites, and this approach is extraordinarily cumbersome even for readily cultivable species such as P. falciparum (e.g., Rosario 1981; Nkhoma et al. 2012).
During ongoing infections, the malaria parasite resides in a haploid state within red blood cells (RBCs). Over a 48-h period, the parasite replicates within an RBC, forming between 22 and 26 haploid merozoites (Reilly et al. 2007) that rupture from the host cell and invade further uninfected RBCs. Alternatively, a parasite may commit to developing into a sexual stage gametocyte. Following a mosquito blood meal, male and female gametes present in the consumed blood rapidly fuse in the mosquito midgut, undergo meiosis, and in the presence of genetically distinct gametes generate novel recombinant progeny. While this process can potentially generate complex patterns of relatedness within infections, we know little about their actual composition, and models of malaria transmission generally assume that component parasites are unrelated and result from independent mosquito bites (Hill and Babiker 1995).
Single-cell genotyping provides a promising approach for dissecting malaria infections (Boissiere et al. 2012). This approach requires that a single infected RBC is uniquely captured, followed by whole-genome amplification and genotyping. Single cells can be captured by laser microdissection (Schutze and Lahr 1998), microfluidics (Wang et al. 2012), or micromanipulation (Kirkness et al. 2013), though cell sorting is becoming increasingly popular. In cell sorting, cells of interest are defined using fluorescent dyes or antibodies and can be individually captured by deflection into tubes or plates. Cell sorting-based approaches are particularly appropriate for Plasmodium-infected RBCs, because it allows infected RBCs to be distinguished from those that are uninfected. Furthermore, cell sorting is rapid and can be performed with sufficient sterility for downstream purposes. Due to the technical hurdles of WGA on single cells, it has been suggested that multiple protocols be comprehensively evaluated to identify an optimal approach (Blainey 2013; Shapiro et al. 2013). Malaria parasites represent an extremely challenging target for single-cell genomics because each parasite resides within an RBC, requiring that three membranes be breached to reach the parasite DNA. Furthermore, P. falciparum possesses the most AT-rich genome sequenced to date (Gardner et al. 2002). Here, we describe extensive optimization of an accurate single-cell genomics methodology for malaria parasites that can be applied to both cultivable and noncultivable malaria species to uncover within-host variation.
Results
High-throughput capture of parasite-infected RBCs
To develop a method suitable for single-cell genotyping, we first tested whether we could isolate parasite-infected RBCs from uninfected, non-nucleated RBCs using cellular dyes and cell sorting. Commonly used DNA dyes either bind DNA irreversibly or require fixation or permeabilization of cells which compromises DNA amplification. We therefore used two live cell dyes that passively enter cells without prior permeabilization or fixation to discriminate infected RBCs (iRBCs); Vybrant DyeCycle Green (VB) which noncovalently binds DNA and has previously been shown to efficiently isolate iRBCs in P. falciparum cultures (Philipp et al. 2012) and has previously been used in single-cell WGA and genomic profiling experiments (Van der Aa et al. 2013); and MitoTracker Green which targets active mitochondria. Using the protocol outlined in Figure 1A, we saw no difference in the ability of dyes to isolate iRBCs, each performing with >97% accuracy (Fig. 1B) and capturing all lifecycle stages present in the starting culture.
Figure 1.

Validation of single-cell genotyping in P. falciparum. (A) The single-cell sorting protocol. (B) We validated that live cell dyes specifically isolate iRBCs from malaria parasite cultures by making giemsa stained smears of cells passing through gates R2 (iRBCs) and R3 (uninfected RBCs)—the full sorting strategy is shown in Supplemental Figure 1. (C) Accuracy (gray bars) and percentage of SNPs called (black dots) of SCG approaches were determined using mixtures of known parasite genotypes. The dyes, WGA kits (PicoPLEX [NEB], REPLI-g Midi and Mini), and analysis parameters are shown below the graph. The rightmost bar shows the optimal protocol determined during our validation. The dashed line denotes 95% accuracy. (D) This optimal protocol accurately clustered single-cell genotypes as 3D7 or Hb3 genotypes without discrepancies. Single-cell genotypes are prefixed “SC” and parental lines named in full and highlighted by arrows. We also include four laboratory strains as genotyping controls: Dd2, 7G8, K1, and D6.
Developing a single-cell genotyping platform for P. falciparum
We tested these two dyes in combination with WGA protocols for their ability to generate high-quality DNA for downstream genotyping. The 3D7 (Gardner et al. 2002), Dd2, and Hb3 (Volkman et al. 2007) P. falciparum parasite lines are well-characterized, fully sequenced isolates that are readily grown in the laboratory. We cultured these lines independently and generated artificial mixed genotype cultures before the sorting of single cells and WGA (Fig. 1). For each experiment, we genotyped 25–50 cells using a custom 96 SNP VeraCode assay (Phyo et al. 2012) that distinguishes these isolates with 36–53 discriminatory SNPs for each comparison.
By using artificial mixtures of parasites with known genotypes in our experiments, we can unambiguously determine the accuracy and coverage of our approach. Sorting in the absence of any dye (as in Miao and Cui 2011) produced inaccurate genotypes. VB had superior accuracy and coverage to MitoTracker Green and was used for subsequent experiments (Fig. 1C). It is unclear why VB was superior; however, we observed that the concentration of MitoTracker Green necessary for clear staining (100 nM) appeared to be cytotoxic after prolonged incubation. Comparisons of three major WGA kits (PicoPLEX/REPLI-g Midi/Mini) showed that each performs with comparable accuracy. Accuracy was further increased by collating the results of replicate genotyping runs and removing cells with more than five mixed genotype calls (as in Nkhoma et al. 2012). These were considered situations in which the WGA product contained more than one parasite genome. We further improved performance by freeze–thaw cell lysis. This resulted in complete concordance between single-cell genotypes and the parental lines used in the mixture experiment (Fig. 1D). Freeze–thaw lysis also improved the genotyping coverage produced by WGA to a mean of 45.4% SNPs per cell (Fig. 1C, black dots), comparable to that observed in genotyping of single human sperm cells (Wang et al. 2012). This is remarkable given the extreme AT content of the P. falciparum genome (∼80% AT) (Gardner et al. 2002). Hence, after systematic testing of 14 different combinations of cell sorting, WGA, and analytical approaches involving 260 single-cell amplifications, we were able to validate a protocol with comparable coverage to state-of-the-art single-cell methods (Wang et al. 2012; Kirkness et al. 2013) with high accuracy (Supplemental Table 1).
Determining single-cell genotypes from malaria infections
We applied this optimized protocol to determine within-host heterogeneity of P. falciparum and P. vivax infections from patients. To identify MGIs, we genotyped blood-spots from single-species infections of either P. falciparum (Cheeseman et al. 2012; Phyo et al. 2012) or P. vivax (n = 95) using custom species-specific VeraCode platforms (Phyo et al. 2012; Supplemental Table 2 using SNPs from Chan et al. 2012). We then selected cryo-preserved MGIs from each species. We applied our single-cell genotyping approach to 25 cells from each infection. As it was not possible to directly measure the accuracy of genotyping for P. vivax, we also applied our approach to a putatively monoclonal infection (VHX0333) and saw perfect concordance between single-cell genotyping and the parent infection (Fig. 2A,B). Our goal was to genotype single cells directly from infections and minimize bias due to ex vivo culture. We therefore applied cell sorting <18 h after thawing cryopreserved vials of each infection. For P. falciparum, and to a lesser extent P. vivax, parasites present in the peripheral blood are predominantly in early “ring” stages (<12-h post-invasion). Because this is the only stage resilient to cryopreservation, flow-sorted parasites will be midway through the cell cycle, at the beginning of DNA replication, and will likely contain one to four genome copies per cell (Arnot et al. 2011).
Figure 2.

Application of SCG to P. vivax infections. (A) UPGMA tree of pairwise allele sharing of P. vivax infections on the Thai-Burmese border. Single-cell genotypes are highlighted (WPP1494: blue, VHX059: red, and VHX0333: green); all other branches are from putatively single-clone P. vivax infections. (B) Within-infection haplotypes from single-cell genotypes. Single-cell genotypes are shown as rows and individual SNPs as columns. Major alleles are shown in red, minor alleles in black, mixed calls are in blue, and missing data in gray. Uncloned infection genotypes are shown by a P and polymorphic markers by triangles. For clarity, only VeraCode SNPs called by >40% of single cells are shown. Haplotypes (black bars on the left) are defined by single-cell genotypes that differ by <5% of SNPs. These haplotype abundances were used as an input to rarefaction analysis, and curves were used to estimate how deeply infections were sampled (C). Mean values are shown by lines (where data has been extrapolated the line is dashed); 95% confidence limits are shown in light blue/pink corresponding to each line. For either infection there is little reward for sampling deeper than 40–50 single cells from an infection.
In both species, multiple distinct haplotypes were detected (Fig. 2A) and patterns of haplotype sharing within a P. falciparum infection (MKK2664; Supplemental Fig. 2) were similar to recent reports using laborious dilution cloning (Nkhoma et al. 2012). P. vivax cannot be cultured long-term in vitro (Noulin et al. 2013). Therefore, it has not been possible to directly examine within-infection heterogeneity in this species. To our knowledge this is the first report that unambiguously characterizes the number and relatedness structure of component haplotypes of a P. vivax infection.
To estimate the efficiency of haplotype sampling from infections, we utilized rarefaction curves, an ecological method used to determine the efficiency with which the species richness of a habitat has been sampled (Juliano et al. 2010; Colwell et al. 2012). For both P. falciparum and P. vivax infections, the major (nonsingleton) haplotypes in each infection were captured after sampling 10–15 cells with VeraCode assays. Extrapolation of these curves suggests there is little reward from an increased sampling effort after 50 cells (Fig. 2C; Supplemental Fig. 2). To determine how well we had captured the relative frequency of haplotypes within infections, we deep sequenced the uncloned P. vivax infection VHX059 on an Illumina HiSeq 2000 in duplicate (65×–101× coverage) and estimated allele frequencies from read depth at alternate alleles. We observed strong correlation between replicate sequencing of the uncloned infection (r2 > 0.99). We also observed strong correlation between deep-sequence and single-cell estimates for both P. vivax (r2 > 0.86) and P. falciparum (r2 > 0.82) (Fig. 3). Hence, single-cell genotyping effectively captures the haplotypes present within infections and their relative frequency.
Figure 3.

Within-host allele frequency and genome-wide coverage from single-cell sequencing. Using VeraCode genotypes for MKK2664 (A) and VHX059 (B), we estimated the within-host allele frequency of all SNPs that are polymorphic within these respective infections. MKK2664 and VHX059 were also sequenced prior to single-cell sorting and the within-host allele frequencies estimated at each of these loci. We observed a strong correlation (r2 > 0.8) between each of these estimates of within-host allele frequencies in both infections. We estimated the genome-wide coverage we obtained from single-cell sequencing of P. falciparum (C) and P. vivax (D). For each species, the observed coverage profile for a bulk parasite sequence is shown by a solid black line. Full sequencing statistics are given in Supplemental Table 2.
Single-genome sequencing of P. vivax and P. falciparum infections
The ultimate goal of single-cell genomics is to obtain genome sequences from individual cells. We sequenced two unsorted patient infections (VHX059 and VHX0333) and 11 single cells from three P. vivax isolates (VHX059 [n = 1]; VHX0333 [n = 5]; WPP1494 [n = 5]), seven single cells from a P. falciparum infection (MKK2664), and four single cells from mixture experiments in Figure 1D on the Illumina HiSeq 2000 platform. To identify WGA reactions with sufficient parasite DNA for sequencing, we developed a qPCR assay targeting a routinely amplified locus in either the P. vivax or P. falciparum genome (Supplemental Fig. 3).
Sequencing P. vivax single cells
After aligning 101-bp paired-end reads to the P. vivax SalI reference (Carlton et al. 2008), we obtained >10× coverage for a mean of 32.4% (7.6%–48.5%) of the genome for 11 P. vivax single-genome sequences (Fig. 3; Supplemental Table 3). By comparison, 96.5%–99.0% of the assembled P. vivax nuclear genome had ≥10× coverage for the unsorted patient infections. We called an average of 59,857 (22,034–86,329 SNPs) high-quality (Q30) SNPs in single-cell genome sequences (compared with 121,606–158,785 in the unsorted patient infections). There was complete concordance between the genome sequence data and VeraCode SNP calls from single cells for WPP1494 and VHX0333 (Supplemental Table 4). Furthermore, pairwise comparisons of fixed SNPs in the VHX0333 infection and VHX0333 single-cell sequences showed 99.0% concordance (n = 36,136 comparisons). We also assessed whether single-cell sequences contained observable contamination from other lines by using read-depth data at deeply sequenced (20–300×) SNPs. Our expectation is that single-cell sequences with no contamination that are polymorphic in the starting infection will be invariant in single-cell sequences (Fig. 4A). By examining the proportion of reads showing alternative alleles, we found little evidence for contamination. There was no significant difference between single genome sequences from the monoclonal VHX0333 and polyclonal WPP1494 in the proportion of SNPs with evidence of contamination (two-sample proportions-test with continuity correction, P = 0.59, χ2 = 0.28, df = 1). This is well illustrated by the within-sample minor allele frequencies, where single genome sequencing and sequence from a single genotype infection (SGI) are expected to show similarly low levels of unfixed alleles, due to low level sequencing/alignment errors, and conversely an MGI will show a peak in the allele frequency spectra around genuine (non-error) unfixed SNPs. This well describes what we see in P. vivax single-cell sequencing (Fig. 4B). Hence, multiple lines of evidence support the accuracy of our single-cell approach.
Figure 4.

Purity of single-cell genome sequence data. SNPs with 30–250× read depth were used to estimate the purity of single-cell data. (A) At variant sites we expect to detect both alleles in deep-sequence data from an uncloned infection (bottom) while these sites should be invariant in single-cell sequence (top). The within-host minor allele frequency (MAF) was estimated from all Q30 SNPs after exclusion of regions of the genome with known high error rates (i.e., vir/var gene clusters and nonexonic regions for P. falciparum). (B) Genome sequencing from single P. vivax cells shows a similar distribution of mixed sites to a putatively single clone infection (SGI; VHX0333). Genome sequence from an MGI (VHX059) is shown to highlight the clear difference from clonal lines. (C) Genome sequencing from single P. falciparum cells from both mixture experiments and a genuine infection (MKK2664) shows a similar proportion of sites showing multiple alleles as other putatively clonal genome sequences. For comparison, genome sequence from the Hb3 and 3D7 laboratory lines used in mixture experiments are shown.
Sequencing P. falciparum single cells
We obtained slightly more complete coverage for sequencing of P. falciparum single genomes, with an average of 51.1% (43.3%–69.7%) of the genome sequenced to ≥10× coverage for the MKK2664 infection. We additionally sequenced the laboratory isolates Hb3 and 3D7 and four single-cell sequences derived from mixture experiments in Figure 1D, obtaining ≥10× coverage for 59.3% (30.6%–78.3%) of the genome. Because we had ascertained the putative source (3D7 or Hb3) of each of these cells, we could directly assess the accuracy of our single-cell sequencing by examining known, fixed differences between Hb3 and 3D7. Using this approach, 98.90% of SNPs perfectly matched their source genome. This rose to 99.95% when mixed base calls were removed, as would be performed in most downstream analytical methods.
We obtained complete concordance between VeraCode and genome sequence data for P. falciparum (Supplemental Table 5). To evaluate the purity of single-cell sequences obtained from mixed clone infections and mixture experiments, we compared P. falciparum single-genome sequences to genome sequencing obtained from bulk cultures of Hb3 and 3D7 and the uncloned infection of MKK2664. Single genome sequencing showed a comparable level of mixed base calls to these two clonal lines, suggesting minimal cross contamination from other lines (Fig. 4C).
We also noted an intrinsic difference between genome sequences from Hb3 and the reference strain 3D7: Hb3 has more polymorphic SNPs than 3D7. This is likely due to the differences in aligning sequences against a perfect matching reference (in the case of 3D7) and a more diverged sequence (i.e., Hb3 or any non-3D7 sequence) increasing the technical error of alignment and SNP calling. This will be important for assessing within-host variation from deep sequencing, where divergence from the reference sequence should be accounted for.
Read depth and GC content in single-cell sequence data
Read depth is strongly biased according to GC content in P. falciparum genome sequencing (Oyola et al. 2012). We explored whether similar biases exist when sequencing single cells from both P. falciparum and P. vivax. Contrary to our expectations, we saw little evidence that the GC content of amplified fragments impacted the depth of their coverage (Supplemental Fig. 4). Single-cell sequences were closer to the unbiased expectation of a uniform distribution (P. falciparum; D = 0.31–0.46, P = 0.0002–0.03, P. vivax; D = 0.28, P = 0.07, two-sided Kolmogorov-Smirnov test) than in uncloned controls (P. falciparum; D = 0.45, P = 1.3 × 10⁻¹⁵, P. vivax; D = 1, P = 2 × 10⁻¹⁶), which are consistent with recent P. falciparum genome sequencing projects (Oyola et al. 2012). Shared regions between single-cell sequences instead correspond well to what would be expected if ∼50% of the genome were randomly selected from each cell (Supplemental Fig. 4).
A fine-scale map of haplotype sharing in malaria infections
A major application of single-cell sequencing of malaria infections is to understand the recent history of the parasites that compose an infection. Parasite genomes separated by few meioses will share long unbroken tracts of DNA, though these will be rare for unrelated parasite genomes in a population. As such, these chromosomal regions that are identical-by-descent (IBD) are informative about the common ancestry of parasites within an infection. Single-cell sequencing can be used to infer haplotype blocks shared between individual parasites within an infection. We examined SNPs (n = 6757) typed in four or more single cells from the P. vivax MGI WPP1494 that were polymorphic across our P. vivax isolates (Supplemental Fig. 5). We observed blocks of contiguous, identical SNPs between strains, consistent with common ancestry (i.e., IBD) (Browning and Browning 2012). The mean length of these IBD blocks between parasite genomes is 617 kb (510–854 kb) with a mean of 50.7% (31%–79%) of the genome shared IBD within infections (Fig. 5A; Supplemental Fig. 5).
Figure 5.

Inferring relatedness within malaria infections. We identified tracts of chromosomes with shared IBD between two parasites for P. vivax (A) and P. falciparum (B) infections using GERMLINE. For P. vivax, between-infection data were generated using both single-cell and bulk sequence from VHX059, VHX333, and WPP1494; and within-host data from WPP1494 alone. For P. falciparum, between-infection data comprises 66 published sequences from western Thailand malaria infections and within-infection data from MKK2664. For clarity, a representative sample of pairwise IBD length distribution is shown in gray with the median and 25th/75th percentiles for the whole population shown by dotted lines. (C) Because we had a sufficiently large population sample for P. falciparum, we used these IBD length distributions to estimate the degree of relatedness between pairs of isolates both between infections and within-infection MKK2664. This showed genomes from within MKK2664 to be significantly more related than population data (χ2 test, χ = 1056.985, P = 8.8 × 10−222).
We additionally examined haplotype sharing in the P. falciparum MGI MKK2664. Using the same criteria (typed in four single cells) and additionally excluding SNPs outside of exons as these are typed with lower confidence (Manske et al. 2012), and limiting to SNPs catalogued in PlasmoDB, we scored 5796 SNPs. The mean length of IBD blocks in the infection were 414.2 kb (152.0–779.3 kb), with 60.7% (47.7%–78.7%) of the genome shared IBD within infections (Fig. 5B). We were interested to know whether this distribution of IBD regions is unusually long for P. falciparum and would be expected should unrelated parasites infect a single patient, as expected in a superinfection model. We additionally explored IBD patterns in genome sequences from unrelated parasites from western Thailand (Manske et al. 2012). Regions that shared IBD within infections were longer than those between infections, consistent with a recent common ancestry for resident parasites of MKK2664. We inferred the pedigree relationship of these parasites using the estimation of a recent shared ancestry (ERSA) program (Huff et al. 2011) using data from Thai malaria infections in Manske et al. (2012) as a population control. This suggested that parasites from within-infection MKK2664 were closely related (median third-degree relatives) (Fig. 5C). While close relatives, including parent-offspring, were also observed in the population sample, single genomes from MKK2664 were significantly more related to one another than from the population sample (χ2 test, χ = 1056.985, P = 8.8 × 10−222).
Within host heterogeneity of drug resistance mutations
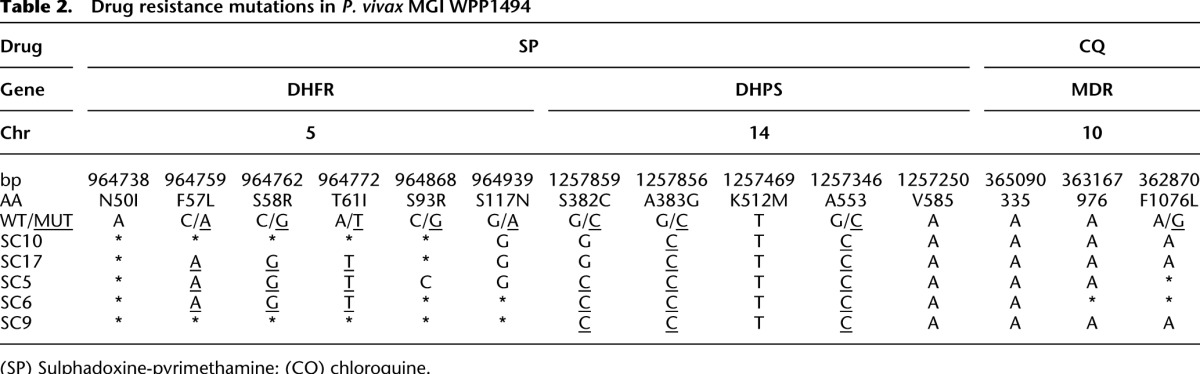
Drug-resistance mutations in the malaria parasite genome compromise our ability to efficaciously treat patients. While we know much about the distribution of resistance alleles throughout parasite populations, little is known about how resistance mutations coexist within an infection, though this will undoubtedly impact the outcome of treatment. We examined known (or proposed) resistance mutations in the dhps, dhfr, and mdr genes of P. falciparum and P. vivax and the crt and kelch genes of P. falciparum in our single-cell sequences (Tables 1, 2). Most resistance alleles were fixed within infections (9/13 in MKK2664 and 11/12 in WPP1494) consistent with the high prevalence of resistance in western Thailand. However, dhps alleles in WPP1494 and mdr, dhfr, dhps, and kelch alleles in MKK2664 exhibited within-host polymorphism. Interestingly, the dhps gene in MKK2664 contained multiple mutations affecting amino acid 540 (K540E/K540N) in different haplotypes. We also observed a point mutation in the kelch propeller domain, PF3D7_1343700. Mutations in the propeller domain of this gene have been recently shown to underlie emerging resistance to artemisinin (Ariey et al. 2014). MKK2664 was isolated from a patient in 2006, after the emergence of artemisinin resistance in western Thailand (Phyo et al. 2012).
Table 1.
Drug resistance mutations in P. falciparum MGI MKK2664

Table 2.
Drug resistance mutations in P. vivax MGI WPP1494
Discussion
Single-cell genomics has multiple applications for malaria biology, ranging from detailed examination of within-host diversity (Nkhoma et al. 2012) to phylogenetic analyses of noncultivable parasites from complex multispecies infections in human and nonhuman primates (Prugnolle et al. 2010; Lee et al. 2011). A major barrier preventing detailed analysis of malaria infections is the inability to culture many malaria parasite species on a long-term basis. Our approach is not reliant on ex vivo parasite growth and can be applied effectively to infections with low parasitaemia (both VHX0333 and WPP1494 had post-thaw parasitaemias of ∼0.025%), countering many of these difficulties. Furthermore, we obtained sequence coverage comparable to single-cell genomics approaches in sperm or single cancer cells (Wang et al. 2012; Kirkness et al. 2013).
There is a risk of capturing multiple target genomes during cell isolation. This may arise from various sources including free DNA in the culture or contamination during handling. However, this can generally be assessed easily through the identification of mixed genotype calls, as has been performed for WGA of sperm cells (Lu et al. 2012; Wang et al. 2012; Kirkness et al. 2013) and in our initial VeraCode assay here. While cross-contamination will reduce the sample size for downstream analysis, we were able to generate high-quality genotypes for 60%–70% of cells from both cultured and ex vivo parasite material. Our single-cell sequences also suggest minimal evidence for contaminating parasite DNA as there is no excess of mixed bases when compared with clonal laboratory lines (Fig. 4).
WGA suffers from random dropout of alleles during genotyping experiments. This is due to chromosomal fragments being lost during the initial capture and lysis of a cell and well-known biases in the MDA reaction itself that lead to uneven amplification across the genome and correlate with genomic features such as GC content and repetitive DNA tracts (Pinard et al. 2006). However, we did not see a clear correlation between GC content and read depth in our single-cell sequences in this work. The GC/read depth profiles are less biased than unamplified controls (Supplemental Fig. 4). The resulting shared sequence between single cells is consistent with the random amplification of 50% of the genome in each single-cell reaction. This is encouraging for efforts to improve the proportion of the genome jointly captured across single cells in an experiment. It suggests that a modest increase in the proportion of each cell randomly captured would greatly impact the amount of shared genomes for downstream analysis (i.e., capturing a random 60% of the genome would double the proportion of the genome sequenced in 80% of cells assayed) (Supplemental Fig. 4F). This may be achieved by modifications to WGA, such as AT-biased primers and dNTPs in the reaction, by improving the delicacy with which DNA is obtained from single cells, or by novel approaches (Zong et al. 2012; Gole et al. 2013).
In the development of a single-cell genotyping platform for malaria parasites, we have focused exclusively on exploring SNPs. Copy-number variation (CNV) has been described in both P. vivax and P. falciparum and underlies several clinically relevant phenotypes (Anderson et al. 2009). There are notable issues with calling CNV from sequence data, particularly regarding the AT bias in the P. falciparum genome (Sepulveda et al. 2013). While other researchers have successfully explored CNV detection in human cells (Navin et al. 2011; Zong et al. 2012; McConnell et al. 2013), the resolution of CNV calling (hundreds to thousands of kilobases) far exceeds the sizes of observed CNV in malaria parasite genomes (generally <10 kb) (Anderson et al. 2009). The development of single-cell approaches with greater resolution will no doubt enable the exploration of such mutational classes in the near future.
Our analysis of single-cell sequences from P. vivax and P. falciparum infections provides insights into the biology and composition of malaria infections, because the component haplotypes within infections can be determined. Anti-malarial chemotherapy is central to treatment and control strategies, but drug resistance can drastically undermine these efforts. We discovered four distinct drug resistance haplotypes within the P. falciparum infection MKK2664. There was within-host variation in resistance alleles to five anti-malarials, including the proposed artemisinin resistance gene (Ariey et al. 2014). This parasite infection was collected from a patient in 2006, consistent with the emergence and spread of artemisinin resistance in western Thailand over the last decade (Phyo et al. 2012). Complete haplotypes of drug resistance mutations are particularly informative. For instance, should resistance mutations for different drugs be present on different genetic backgrounds, combination treatment will be effective, whereas if they are on the same parasite haplotype, it will not. Deep sequencing alone cannot distinguish between these situations, because parasite haplotypes cannot be determined.
We also explored the extent to which IBD haplotypes are shared among parasite genomes in an infection. The length of IBD fragments shared between individuals in a population has been previously used to estimate their degree of relatedness (Huff et al. 2011; Gusev et al. 2012). The IBD sharing found within the P. falciparum infection MKK2664 (414 kb) suggested component genotypes within an infection to be closely related, and are most likely separated by two meioses (equivalent to relatedness between uncles and nephews). This is consistent with recent findings (Nkhoma et al. 2012), where within-host relatedness was explored using infections from the same Thai clinics and which demonstrated that infections contain parasite genomes ranging in relatedness from full siblings to unrelated. The advent of large-scale population genomic data for P. vivax populations will allow similar analyses to be performed for this parasite.
Performing single-cell genomic analysis remains challenging for most organisms. These experiments verify that such an approach is technically feasible for malaria parasites and provides accurate data and novel insights into malaria population biology. We believe that these methods have enormous potential to enhance the understanding of malaria biology and are broadly applicable across the apicomplexan phylum.
Methods
Parasites
P. falciparum laboratory strains 3D7, Dd2, and Hb3 were obtained from MR4 (http://www.mr4.org/). Parasites were cultured in O-positive human erythrocytes using RPMI 1640 media (Gibco) supplemented with 0.02 M HEPES (Gibco), 5% albumax II (Invitrogen), and 0.01 mg/mL gentamicin (Gibco) in a 37°C incubator containing 4% O2, 3% CO2, and 93% N2. P. vivax isolates were cultured using McCoy’s 5A media (Gibco), 0.5% glucose (Sigma), 0.02 M HEPES (Gibco), 0.01 mg/mL gentamycin (Gibco), 25% Human AB serum (Invitrogen) and incubated as above. We screened 95 bloodspots from P. vivax infections from patients presenting to clinics run by the Shoklo Malaria Research Unit along the Thai–Burmese border to identify single- and multiple-genotype infections for further work. Parasite DNA from bloodspots was extracted using GenSolve kits (GenVault) and purified using QIAamp DNA Mini kits (Qiagen). We selected P. falciparum samples based on previous genotyping experiments (Cheeseman et al. 2012; Phyo et al. 2012). Cryopreserved infections were thawed using standard malaria methods (Trager and Jensen 1976) and cultured for less than 18 h. This is insufficient time for the ∼48-h parasite lifecycle to complete, after which the invasion of new RBCs occurs. Our assay is therefore applicable to uncultivable parasites that cannot reinvade RBCs in laboratory conditions and are not viable for long-term culture ex vivo.
Staining
Cultured parasites were centrifuged and washed in autoclaved and filter-sterilized 1× PBS. Eight microliters of pellet (105–106 cells) were added to 5 mL of PBS with 2.5 µL of Vybrant Dye Cycle Green (Invitrogen, cat. no. V35004, 5 nM) or 0.5 µL of MitoTracker Green (Invitrogen, cat. no. M-7512, 1 mM) and incubated at 37°C in the dark for 30 min. The tubes were mixed gently every 5 min to ensure uniform staining. The cells were centrifuged and washed twice in PBS, resuspended in 8 mL of PBS, and transferred to the flow-sorting facility at the University of Texas Health Science Center San Antonio.
Fluorescence-activated cell sorting
FACS was performed on a MoFlo Astrios (Beckman-Coulter). Prior to sorting the machine was sterilized with 25% white vinegar. Single cells from each infection were sorted into sterile 0.2-mL PCR tubes containing 5 µL of 1× PBS from the REPLI-g Midi kit. PCR tubes with closed caps were preferred to an open 96-well plate to prevent contamination between wells. In addition to our initial fluidics sterilization, the nozzle access area was wiped with 80% EtOH between single-cell sorts and a single open tube was present in the machine at one time. The gating strategy to sort infected parasites is shown in Supplemental Figure 1. The sorted cells were placed immediately on dry ice for transportation and stored frozen at −80°C overnight. Accuracy of cell capture was measured by flow sorting 500,000 cells from the parasite-positive fraction (gate R2 in Fig. 1B) and making a giemsa stained microscope slide, as in Figure 1B. Accuracy was defined as the percentage of RBCs visibly containing a parasite. To minimize the potential for doubles, a doublet discrimination gating strategy was used during the sort (Supplemental Fig. 1). In addition, the Astrios sorter was set to single-cell sorting mode with a drop envelope of 0.5 to help ensure that only one RBC was in a sorted drop. To verify single-cell error, extensive testing of the Astrios was performed prior to carrying out the study with single-cell iRBCs. In short, Flow Check fluorescent beads (Beckman Coulter) and PC3 cells stained with CellTracker Green (Life Technologies) were individually sorted into 384-well plates. Using an inverted fluorescent microscope, each well was checked to determine the accuracy of single cells and to observe potential doublets or wells with no beads or cells. This testing was repeated several times. In the 384-well plates, only one to two wells (0.26%–0.5%) contained doublets, on average.
Whole-genome amplification
Several kits were used during the optimization period to amplify single-cell DNA: PicoPLEX WGA (New England Biolabs) and REPLI-g Mini and Midi kits (Qiagen). All kits were used following the manufacturer’s protocols. Our optimal protocol used the REPLI-g Midi kit (Qiagen, cat. no. 150043). The only addition was an initial freeze–thaw step before the chemical lysis that greatly increased the success rate of amplification of the single cell. Amplified DNA was cleaned using the Genomic DNA Cleanup and Concentrator columns (Zymo Research, cat no. D4010) and concentrations measured on a Qubit fluorometer (Invitrogen).
Precautions to avoid contamination
We adopted several measures to limit potential DNA contamination throughout the experiment. All work areas were decontaminated before and after each experiment with 2% bleach, 80% EtOH, and DNAZap (Ambion), then rinsed in distilled water. We used disposable lab coats, masks, and surgical caps and discarded these each time we moved between work areas. Gloves were frequently changed and sprayed with 80% EtOH before entering PCR hoods. We used Gilson positive displacement pipettes to eliminate aerosols inside the PCR hoods. We maintained four dedicated areas for single-cell work:
The culture hood for handling parasite cultures.
PCR hood-1 (ISC BIOEXPRESS AirClean 600 PCR Workstation) located in a laboratory where no DNA was being handled. Here preamplification reagents were mixed and cocktails prepared.
PCR hood-2 (ISC BIOEXPRESS AirClean 600 PCR Workstation) where WGA reactions were performed. Reagents were only moved from the malaria DNA-free lab into the malaria DNA lab.
Dedicated PCR machine decontaminated before and after each run.
SNP typing
Genotyping with Illumina’s VeraCode technology was undertaken for all of the single cells amplified. This platform is a flexible, preoptimized assay that uses a discriminatory DNA polymerase and ligase to interrogate 96 loci in a single well of a standard 96-well microplate. We adapted the standard 2-d protocol for more effective genotyping of the AT-rich P. falciparum genome by increasing the allele-specific extension step to 16 h, as opposed to the 2-h standard protocol (which was used for the less AT-rich P. vivax genome). Additional plate changes were introduced during the assay to prevent build-up of residue from adhesive PCR covers; these were repeatedly changed during the assay and were a risk factor for between-well contamination. In addition, duplicate samples were randomized on the 96-well plates. The Illumina BeadXpress reader was used to scan the beads and data analyzed on the Genome Studio v2010.3. SNPs are called by clustering data by log R and B allele frequency, with SNPs that are monomorphic within a sample (either bulk parasite or single cell) clustering at the extremes of the B allele frequency spectrum and polymorphic sites with an infection between. Clusters were initially classified on bulk DNA samples, though additional stringency was introduced by increasing the minimum log R value to call a genotype to account for the higher amount of uncalled SNPs in single cell data. The P. vivax Veracode array design is shown in Supplemental Table 1; the P. falciparum design has been previously published (Phyo et al. 2012).
Single genome sample purity
qPCR was performed on samples prior to genome sequencing to check for purity of parasite DNA. We designed primers (PviS_CM000450-F; GAAGCGGGTTCTGCCTCT, PviS_CM000450-R; CTTTATGTCTGTCCCCTTGG) based on preliminary genome sequences of single cells from P. vivax infection VHX059. A region on chromosome 9 was reliably amplified in single cells and could effectively discriminate samples with sufficient purity for genome sequencing (Supplemental Fig. 3A). We followed a similar strategy to design primers to check for purity of P. falciparum WGA products (Supplemental Fig. 3B; pfCH13_1_F, CTTCTACTATATTATATGAAAAACTGT, pfCH13_1_R CATTGATGTAGCTTTATTGG).
Sequencing library preparation
A total of 750 ng to 2 µg of DNA was sheared using a Covaris S-series sonicator (Covaris) with the following settings: duty cycle 20%, time 180 sec, intensity 5, cycle burst 200, power 37W, temperature 7°C, mode freq sweeping. Sheared DNA was end-repaired, A-tailed, and multiplex-indexed adaptors ligated using NEBNext library preparation kits for Illumina. Following Oyola et al. (2012) and Quail et al. (2011), we replaced the DNA polymerase with Kapa HiFi (Kapa Biosystems) and used Agencourt AMPure XP beads (Beckman Coulter) for sample purification between sample preparation steps. The Kapa SYBR Fast ABI Prism qPCR kit (Kapa Biosystems) was used to quantify templates before they were multiplexed (12 samples/lane) and sequenced on an Illumina HiSeq 2000. Raw sequence data were de-multiplexed and .fastq files generated using CASAVA 3.0 before further analysis.
Sequence analysis
A total of 101-bp paired-end reads from .fastq files were mapped against either the P. vivax genome reference strain Sal1 (Carlton et al. 2008) version 9.2 (http://plasmodb.org/common/downloads/release-9.2/PvivaxSaI1/fasta/data/) or the P. falciparum genome reference strain 3D7 v9.2 (http://plasmodb.org/common/downloads/release-9.2/Pfalciparum3D7/fasta/data/) using BWA v0.6.1 (Li and Durbin 2009). The resulting BAM files were cleaned to remove reads that map off chromosomes and PCR duplicates removed using Picard v1.56 (http://picard.sourceforge.net/). The Genome Analysis Toolkit v2.3-9 (DePristo et al. 2011) was used to realign around indels and generate/recalibrate base quality scores before final SNP calling was performed using the Unified Genotyper. Variant quality scores were then recalibrated and variants removed if they failed any of the following quality metrics (QUAL < 100.0, FS < 50, BaseQRankSum −2 > X > 2, MQRankSum −2 > X > 2, QD < 10). For P. falciparum analysis, well-annotated SNPs were used for variant quality score recalibration and generating haplotype sharing maps; these were downloaded from http://plasmodb.org/plasmo/. Chromosome level coverage plots for P. vivax and P. falciparum were generated using the Integrated Genome Viewer 2.1.6 (Thorvaldsdottir et al. 2013; Supplemental Figs. 6, 7).
Sampling depth of infections
We applied rarefaction and extrapolation curves to haplotype abundances from VeraCode data with the program EstimateS v9.0.0 (http://viceroy.eeb.uconn.edu/estimates/) using individual based curves and sampling without replacement to estimate the number of haplotypes in an infection. This approach provides an approximation of the asymptotic species richness in a sample based on subsampling of the known data and extrapolating this data based on observed frequency data along with log-linear 95% confidence intervals {under the assumption that log([observed species richness]−[estimated species richness])} is normally distributed.
Statistical and population genetic analysis
All statistical analysis was performed in R v2.15.0 (R Development Core Team 2013). For VeraCode analysis, SNPs with mixed base calls and single cells with <30 SNPs called and more than mixed base calls were excluded. UPGMA trees were created in PHYLIP v3.69 (http://evolution.genetics.washington.edu/phylip.html) from one-pairwise allele sharing matrices (generated using custom R scripts) and drawn in FigTree v1.3.1 (http://tree.bio.ed.ac.uk/software/figtree/). Accuracy was determined as (true positive + true negative)/(true positive + false positive + true negative + false negative). Accuracy was determined for mixture experiments for each single-cell genotype. The likely origin of the single-cell genotype was first determined as the “parental” strain with the largest number of perfectly matching SNPs that equates to true positives + true negatives, and accuracy expressed as the fraction of perfectly matching SNPs to all called SNPs (true positives + true negatives + false positives + false negatives). IBD estimates were performed using GERMLINE v1.5.1 (settings -bits 20, -err_hom 4, -err_het 2, min_m 0.001, w_extend, -h_extend) (Gusev et al. 2009) and ERSA 1.0 (settings –rec 19.9, -nc 14) (Huff et al. 2011) using a uniform genetic map estimated from Jiang et al. ( 2011). Prior to estimating IBD, missing genotypes in samples from Manske et al. (2012) were imputed using BEAGLE v3.3.2 (Browning and Browning 2009).
Data access
Raw sequence data have been submitted to the NCBI Sequence Read Archive (SRA; http://www.ncbi.nlm.nih.gov/sra/) under accession numbers PRJNA227205 and PRJNA227254. VeraCode genotyping data for P. vivax and P. falciparum are included in Supplemental Datasets 1 and 2.
Acknowledgments
We thank Roy Garcia (Illumina sequencing) and Marina McDew-White, Frédéric Chevalier, Lai Zhao, and Dawn Garcia (library preparation). We also thank Dominic Kwiatkowski and colleagues at the Wellcome Trust Sanger Institute for access to Thai P. falciparum read data. This work was supported by Texas Biomedical Forum Grant 11-4313 (I.H.C.), and US National Institutes of Health Grant R37AI048071 (T.J.C.A.). I.H.C. was supported by a Cowles Postdoctoral Training Fellowship. S.C.N. is supported by the Wellcome Trust (099992/Z/12/Z). The Shoklo Malaria Research Unit is part of the Mahidol Oxford University Research Unit, supported by the Wellcome Trust of Great Britain. The AT&T Genomics Computing Center supercomputing facilities were supported by the AT&T Foundation and National Center for Research Resources Grant number S10 RR029392. This investigation was conducted in facilities constructed with support from Research Facilities Improvement Program grant C06 RR013556 and National Center for Research Resources of the National Institutes of Health grant RR017515. Analysis and identification of P. vivax SNPs was funded by a Cleveland CTSC Pilot award to D.S. and a National Institute of Allergy and Infectious Diseases (NIAID) award to P.A.Z. (R21 AI093922). Data was generated in the Flow Cytometry Shared Resource Facility which is supported by UTHSCSA, NIH-NCI P30 CA54174 (CTRC at UTHSCSA), and UL1RR025767 (CTSA grant).
Author contributions: S.N., T.J.C.A., and I.H.C. designed the experiments; S.N., S.C.N., K.G., B.J.D., and I.H.C. performed the experiments; S.N. and I.H.C. analyzed the data; F.N. collected the samples; D.S. and P.A.Z. contributed SNP data; S.N., T.J.C.A., and I.H.C. wrote the paper.
Footnotes
[Supplemental material is available for this article.]
Article published online before print. Article, supplemental material, and publication date are at http://www.genome.org/cgi/doi/10.1101/gr.168286.113.
References
- Anderson TJ, Haubold B, Williams JT, Estrada-Franco JG, Richardson L, Mollinedo R, Bockarie M, Mokili J, Mharakurwa S, French N, et al. 2000. Microsatellite markers reveal a spectrum of population structures in the malaria parasite Plasmodium falciparum. Mol Biol Evol 17: 1467–1482 [DOI] [PubMed] [Google Scholar]
- Anderson TJ, Patel J, Ferdig MT 2009. Gene copy number and malaria biology. Trends Parasitol 25: 336–343 [DOI] [PMC free article] [PubMed] [Google Scholar]
- Ariey F, Witkowski B, Amaratunga C, Beghain J, Langlois AC, Khim N, Kim S, Duru V, Bouchier C, Ma L, et al. 2014. A molecular marker of artemisinin-resistant Plasmodium falciparum malaria. Nature 505: 50–55 [DOI] [PMC free article] [PubMed] [Google Scholar]
- Arnot DE, Ronander E, Bengtsson DC 2011. The progression of the intra-erythrocytic cell cycle of Plasmodium falciparum and the role of the centriolar plaques in asynchronous mitotic division during schizogony. Int J Parasitol 41: 71–80 [DOI] [PubMed] [Google Scholar]
- Arnott A, Barry AE, Reeder JC 2012. Understanding the population genetics of Plasmodium vivax is essential for malaria control and elimination. Malar J 11: 14. [DOI] [PMC free article] [PubMed] [Google Scholar]
- Bell AS, de Roode JC, Sim D, Read AF 2006. Within-host competition in genetically diverse malaria infections: parasite virulence and competitive success. Evolution 60: 1358–1371 [PubMed] [Google Scholar]
- Blainey PC 2013. The future is now: single-cell genomics of bacteria and archaea. FEMS Microbiol Rev 37: 407–427 [DOI] [PMC free article] [PubMed] [Google Scholar]
- Boissiere A, Arnathau C, Duperray C, Berry L, Lachaud L, Renaud F, Durand P, Prugnolle F 2012. Isolation of Plasmodium falciparum by flow-cytometry: implications for single-trophozoite genotyping and parasite DNA purification for whole-genome high-throughput sequencing of archival samples. Malar J 11: 163. [DOI] [PMC free article] [PubMed] [Google Scholar]
- Browning BL, Browning SR 2009. A unified approach to genotype imputation and haplotype-phase inference for large data sets of trios and unrelated individuals. Am J Hum Genet 84: 210–223 [DOI] [PMC free article] [PubMed] [Google Scholar]
- Browning SR, Browning BL 2012. Identity by descent between distant relatives: detection and applications. Annu Rev Genet 46: 617–633 [DOI] [PubMed] [Google Scholar]
- Carlton JM, Adams JH, Silva JC, Bidwell SL, Lorenzi H, Caler E, Crabtree J, Angiuoli SV, Merino EF, Amedeo P, et al. 2008. Comparative genomics of the neglected human malaria parasite Plasmodium vivax. Nature 455: 757–763 [DOI] [PMC free article] [PubMed] [Google Scholar]
- Chan ER, Menard D, David PH, Ratsimbasoa A, Kim S, Chim P, Do C, Witkowski B, Mercereau-Puijalon O, Zimmerman PA, et al. 2012. Whole genome sequencing of field isolates provides robust characterization of genetic diversity in Plasmodium vivax. PLoS Negl Trop Dis 6: e1811 [DOI] [PMC free article] [PubMed] [Google Scholar]
- Cheeseman IH, Miller BA, Nair S, Nkhoma S, Tan A, Tan JC, Al Saai S, Phyo AP, Moo CL, Lwin KM, et al. 2012. A major genome region underlying artemisinin resistance in malaria. Science 336: 79–82 [DOI] [PMC free article] [PubMed] [Google Scholar]
- Colwell RK, Chao A, Gotelli NJ, Lin S, Mao CX, Chazdon RL, Longino JT 2012. Models and estimators linking individual-based and sample-based rarefaction, extrapolation and comparison of assemblages. J Plant Ecol 5: 3–21 [Google Scholar]
- Conway DJ, Roper C, Oduola AM, Arnot DE, Kremsner PG, Grobusch MP, Curtis CF, Greenwood BM 1999. High recombination rate in natural populations of Plasmodium falciparum. Proc Natl Acad Sci 96: 4506–4511 [DOI] [PMC free article] [PubMed] [Google Scholar]
- de Roode JC, Helinski ME, Anwar MA, Read AF 2005. Dynamics of multiple infection and within-host competition in genetically diverse malaria infections. Am Nat 166: 531–542 [DOI] [PubMed] [Google Scholar]
- DePristo MA, Banks E, Poplin R, Garimella KV, Maguire JR, Hartl C, Philippakis AA, del Angel G, Rivas MA, Hanna M, et al. 2011. A framework for variation discovery and genotyping using next-generation DNA sequencing data. Nat Genet 43: 491–498 [DOI] [PMC free article] [PubMed] [Google Scholar]
- Frank SA 1996. Models of parasite virulence. Q Rev Biol 71: 37–78 [DOI] [PubMed] [Google Scholar]
- Gardner MJ, Hall N, Fung E, White O, Berriman M, Hyman RW, Carlton JM, Pain A, Nelson KE, Bowman S, et al. 2002. Genome sequence of the human malaria parasite Plasmodium falciparum. Nature 419: 498–511 [DOI] [PMC free article] [PubMed] [Google Scholar]
- Gole J, Gore A, Richards A, Chiu YJ, Fung HL, Bushman D, Chiang HI, Chun J, Lo YH, Zhang K 2013. Massively parallel polymerase cloning and genome sequencing of single cells using nanoliter microwells. Nat Biotechnol 31: 1126–1132 [DOI] [PMC free article] [PubMed] [Google Scholar]
- Gusev A, Lowe JK, Stoffel M, Daly MJ, Altshuler D, Breslow JL, Friedman JM, Pe’er I 2009. Whole population, genome-wide mapping of hidden relatedness. Genome Res 19: 318–326 [DOI] [PMC free article] [PubMed] [Google Scholar]
- Gusev A, Palamara PF, Aponte G, Zhuang Z, Darvasi A, Gregersen P, Pe’er I 2012. The architecture of long-range haplotypes shared within and across populations. Mol Biol Evol 29: 473–486 [DOI] [PMC free article] [PubMed] [Google Scholar]
- Hastings IM 2006. Complex dynamics and stability of resistance to antimalarial drugs. Parasitology 132: 615–624 [DOI] [PubMed] [Google Scholar]
- Hill WG, Babiker HA 1995. Estimation of numbers of malaria clones in blood samples. Proc Biol Sci 262: 249–257 [DOI] [PubMed] [Google Scholar]
- Huff CD, Witherspoon DJ, Simonson TS, Xing J, Watkins WS, Zhang Y, Tuohy TM, Neklason DW, Burt RW, Guthery SL, et al. 2011. Maximum-likelihood estimation of recent shared ancestry (ERSA). Genome Res 21: 768–774 [DOI] [PMC free article] [PubMed] [Google Scholar]
- Huijben S, Sim DG, Nelson WA, Read AF 2011. The fitness of drug-resistant malaria parasites in a rodent model: multiplicity of infection. J Evol Biol 24: 2410–2422 [DOI] [PMC free article] [PubMed] [Google Scholar]
- Jiang H, Li N, Gopalan V, Zilversmit MM, Varma S, Nagarajan V, Li J, Mu J, Hayton K, Henschen B, et al. 2011. High recombination rates and hotspots in a Plasmodium falciparum genetic cross. Genome Biol 12: R33 [DOI] [PMC free article] [PubMed] [Google Scholar]
- Juliano JJ, Porter K, Mwapasa V, Sem R, Rogers WO, Ariey F, Wongsrichanalai C, Read A, Meshnick SR 2010. Exposing malaria in-host diversity and estimating population diversity by capture-recapture using massively parallel pyrosequencing. Proc Natl Acad Sci 107: 20138–20143 [DOI] [PMC free article] [PubMed] [Google Scholar]
- Kirkness EF, Grindberg RV, Yee-Greenbaum J, Marshall CR, Scherer SW, Lasken RS, Venter JC 2013. Sequencing of isolated sperm cells for direct haplotyping of a human genome. Genome Res 23: 826–832 [DOI] [PMC free article] [PubMed] [Google Scholar]
- Lee KS, Divis PC, Zakaria SK, Matusop A, Julin RA, Conway DJ, Cox-Singh J, Singh B 2011. Plasmodium knowlesi: reservoir hosts and tracking the emergence in humans and macaques. PLoS Pathog 7: e1002015. [DOI] [PMC free article] [PubMed] [Google Scholar]
- Li H, Durbin R 2009. Fast and accurate short read alignment with Burrows-Wheeler transform. Bioinformatics 25: 1754–1760 [DOI] [PMC free article] [PubMed] [Google Scholar]
- Lu S, Zong C, Fan W, Yang M, Li J, Chapman AR, Zhu P, Hu X, Xu L, Yan L, et al. 2012. Probing meiotic recombination and aneuploidy of single sperm cells by whole-genome sequencing. Science 338: 1627–1630 [DOI] [PMC free article] [PubMed] [Google Scholar]
- Manske M, Miotto O, Campino S, Auburn S, Almagro-Garcia J, Maslen G, O’Brien J, Djimde A, Doumbo O, Zongo I, et al. 2012. Analysis of Plasmodium falciparum diversity in natural infections by deep sequencing. Nature 487: 375–379 [DOI] [PMC free article] [PubMed] [Google Scholar]
- McConnell MJ, Lindberg MR, Brennand KJ, Piper JC, Voet T, Cowing-Zitron C, Shumilina S, Lasken RS, Vermeesch JR, Hall IM, et al. 2013. Mosaic copy number variation in human neurons. Science 342: 632–637 [DOI] [PMC free article] [PubMed] [Google Scholar]
- Miao J, Cui L 2011. Rapid isolation of single malaria parasite-infected red blood cells by cell sorting. Nat Protoc 6: 140–146 [DOI] [PMC free article] [PubMed] [Google Scholar]
- Navin N, Kendall J, Troge J, Andrews P, Rodgers L, McIndoo J, Cook K, Stepansky A, Levy D, Esposito D, et al. 2011. Tumour evolution inferred by single-cell sequencing. Nature 472: 90–94 [DOI] [PMC free article] [PubMed] [Google Scholar]
- Nkhoma SC, Nair S, Cheeseman IH, Rohr-Allegrini C, Singlam S, Nosten F, Anderson TJ 2012. Close kinship within multiple-genotype malaria parasite infections. Proc Biol Sci 279: 2589–2598 [DOI] [PMC free article] [PubMed] [Google Scholar]
- Noulin F, Borlon C, Van Den Abbeele J, D’Alessandro U, Erhart A 2013. 1912–2012: a century of research on Plasmodium vivax in vitro culture. Trends Parasitol 29: 286–294 [DOI] [PubMed] [Google Scholar]
- Oyola SO, Otto TD, Gu Y, Maslen G, Manske M, Campino S, Turner DJ, Macinnis B, Kwiatkowski DP, Swerdlow HP, et al. 2012. Optimizing Illumina next-generation sequencing library preparation for extremely AT-biased genomes. BMC Genomics 13: 1 [DOI] [PMC free article] [PubMed] [Google Scholar]
- Philipp S, Oberg HH, Janssen O, Leippe M, Gelhaus C 2012. Isolation of erythrocytes infected with viable early stages of Plasmodium falciparum by flow cytometry. Cytometry A 81: 1048–1054 [DOI] [PubMed] [Google Scholar]
- Phyo AP, Nkhoma S, Stepniewska K, Ashley EA, Nair S, McGready R, ler Moo C, Al-Saai S, Dondorp AM, Lwin KM, et al. 2012. Emergence of artemisinin-resistant malaria on the western border of Thailand: a longitudinal study. Lancet 379: 1960–1966 [DOI] [PMC free article] [PubMed] [Google Scholar]
- Pinard R, de Winter A, Sarkis GJ, Gerstein MB, Tartaro KR, Plant RN, Egholm M, Rothberg JM, Leamon JH 2006. Assessment of whole genome amplification-induced bias through high-throughput, massively parallel whole genome sequencing. BMC Genomics 7: 216. [DOI] [PMC free article] [PubMed] [Google Scholar]
- Prugnolle F, Durand P, Neel C, Ollomo B, Ayala FJ, Arnathau C, Etienne L, Mpoudi-Ngole E, Nkoghe D, Leroy E, et al. 2010. African great apes are natural hosts of multiple related malaria species, including Plasmodium falciparum. Proc Natl Acad Sci 107: 1458–1463 [DOI] [PMC free article] [PubMed] [Google Scholar]
- Quail MA, Otto TD, Gu Y, Harris SR, Skelly TF, McQuillan JA, Swerdlow HP, Oyola SO 2011. Optimal enzymes for amplifying sequencing libraries. Nat Methods 9: 10–11 [DOI] [PubMed] [Google Scholar]
- R Development Core Team. 2013. R: A language and environment for statistical computing. R Foundation for Statistical Computing, Vienna, Austria [Google Scholar]
- Reilly HB, Wang H, Steuter JA, Marx AM, Ferdig MT 2007. Quantitative dissection of clone-specific growth rates in cultured malaria parasites. Int J Parasitol 37: 1599–1607 [DOI] [PMC free article] [PubMed] [Google Scholar]
- Rosario V 1981. Cloning of naturally occurring mixed infections of malaria parasites. Science 212: 1037–1038 [DOI] [PubMed] [Google Scholar]
- Schütze K, Lahr G 1998. Identification of expressed genes by laser-mediated manipulation of single cells. Nat Biotechnol 16: 737–742 [DOI] [PubMed] [Google Scholar]
- Sepulveda N, Campino SG, Assefa SA, Sutherland CJ, Pain A, Clark TG 2013. A Poisson hierarchical modelling approach to detecting copy number variation in sequence coverage data. BMC Genomics 14: 128 [DOI] [PMC free article] [PubMed] [Google Scholar]
- Shapiro E, Biezuner T, Linnarsson S 2013. Single-cell sequencing-based technologies will revolutionize whole-organism science. Nat Rev Genet 14: 618–630 [DOI] [PubMed] [Google Scholar]
- Thorvaldsdottir H, Robinson JT, Mesirov JP 2013. Integrative Genomics Viewer (IGV): high-performance genomics data visualization and exploration. Brief Bioinform 14: 178–192 [DOI] [PMC free article] [PubMed] [Google Scholar]
- Trager W, Jensen JB 1976. Human malaria parasites in continuous culture. Science 193: 673–675 [DOI] [PubMed] [Google Scholar]
- Van der Aa N, Cheng J, Mateiu L, Zamani Esteki M, Kumar P, Dimitriadou E, Vanneste E, Moreau Y, Vermeesch JR, Voet T 2013. Genome-wide copy number profiling of single cells in S-phase reveals DNA-replication domains. Nucleic Acids Res 41: e66. [DOI] [PMC free article] [PubMed] [Google Scholar]
- Volkman SK, Sabeti PC, DeCaprio D, Neafsey DE, Schaffner SF, Milner DA Jr, Daily JP, Sarr O, Ndiaye D, Ndir O, et al. 2007. A genome-wide map of diversity in Plasmodium falciparum. Nat Genet 39: 113–119 [DOI] [PubMed] [Google Scholar]
- Wang J, Fan HC, Behr B, Quake SR 2012. Genome-wide single-cell analysis of recombination activity and de novo mutation rates in human sperm. Cell 150: 402–412 [DOI] [PMC free article] [PubMed] [Google Scholar]
- Zong C, Lu S, Chapman AR, Xie XS 2012. Genome-wide detection of single-nucleotide and copy-number variations of a single human cell. Science 338: 1622–1626 [DOI] [PMC free article] [PubMed] [Google Scholar]