

Abstract
The development of the human malaria parasite Plasmodium falciparum is controlled by coordinated changes in gene expression throughout its complex life cycle, but the corresponding regulatory mechanisms are incompletely understood. To study the relationship between genome architecture and gene regulation in Plasmodium, we assayed the genome architecture of P. falciparum at three time points during its erythrocytic (asexual) cycle. Using chromosome conformation capture coupled with next-generation sequencing technology (Hi-C), we obtained high-resolution chromosomal contact maps, which we then used to construct a consensus three-dimensional genome structure for each time point. We observed strong clustering of centromeres, telomeres, ribosomal DNA, and virulence genes, resulting in a complex architecture that cannot be explained by a simple volume exclusion model. Internal virulence gene clusters exhibit domain-like structures in contact maps, suggesting that they play an important role in the genome architecture. Midway during the erythrocytic cycle, at the highly transcriptionally active trophozoite stage, the genome adopts a more open chromatin structure with increased chromosomal intermingling. In addition, we observed reduced expression of genes located in spatial proximity to the repressive subtelomeric center, and colocalization of distinct groups of parasite-specific genes with coordinated expression profiles. Overall, our results are indicative of a strong association between the P. falciparum spatial genome organization and gene expression. Understanding the molecular processes involved in genome conformation dynamics could contribute to the discovery of novel antimalarial strategies.
Malaria remains a major contributor to the global burden of disease, with an estimated 219 million infected individuals and 660,000 deaths annually (World Health Organization 2012). One of the main limiting factors for the development of novel therapies is our poor understanding of mechanisms regulating the parasite’s complex life cycle, which involves several distinct parasitic stages in the human and mosquito hosts. Regulation of these developmental stages is thought to be controlled by coordinated changes in gene expression. In addition, virulence associated with the human malaria parasite, Plasmodium falciparum, is known to be directly linked to the parasite’s ability to tightly control the expression of genes involved in antigenic variations on the surface of infected red blood cells. Some progress has been made in elucidating mechanisms controlling the expression of these virulence genes (Duraisingh et al. 2005; Freitas-Junior et al. 2005). Furthermore, a limited number of putative sequence-specific transcription factors (TFs) has been identified in the parasite genome (Coulson et al. 2004; Balaji et al. 2005), including 27 ApiAP2 plant-like TFs, and drastic changes in chromatin structure related to transcriptional activity have been observed throughout the parasite erythrocytic cycle (Ponts et al. 2010). However, general and specific mechanisms controlling the expression of the 6372 parasite genes remain poorly understood.
In higher eukaryotes, several analyses have emphasized the role of genome architecture in regulating transcription. Compartmentalization of the nucleus, chromatin loops, and long-range interactions contribute to a complex regulatory network (Lieberman-Aiden et al. 2009; Kalhor et al. 2011; Dixon et al. 2012; Homouz and Kudlicki 2013). In P. falciparum, little is known about the effect of genome organization on gene expression. Recent data indicate that genes involved in the control of parasite virulence (var genes) are associated with repressive centers at the nuclear periphery (Duraisingh et al. 2005; Dzikowski et al. 2007; Lopez-Rubio et al. 2009) and that ribosomal DNA gene clusters are also colocalized (Mancio-Silva et al. 2010; Lemieux et al. 2013). However, a global picture of the nuclear architecture throughout the parasite erythrocytic cycle progression and its role in transcriptional regulation is not yet available.
Chromosome conformation capture coupled with next-generation sequencing (Hi-C) measures the population average frequency of contacts between pairs of DNA fragments in 3D space and can be used to model the spatial architecture of the genome (Lieberman-Aiden et al. 2009; Duan et al. 2010; Kalhor et al. 2011). Here, we performed a variant of the Hi-C protocol, tethered conformation capture (Kalhor et al. 2011), to model at 10-kb resolution the spatial organization of the P. falciparum genome throughout its erythrocytic cycle. Our results indicate that the P. falciparum genome is highly structured, with strong colocalization of centromeres, telomeres, active rDNA genes, and virulence gene clusters. These virulence genes exhibit distinctive contact patterns and may therefore contribute to establishing the three-dimensional structure of the P. falciparum genome. We identified discrete chromosomal territories during the early and late stages of the parasite erythrocytic cycle, which are partially lost in the highly transcriptionally active trophozoite stage. Global chromosome movements during the erythrocytic cycle are coherent with levels of transcriptional activity during the different stages, and the three-dimensional genome architecture shows strong correlation with gene expression levels. Collectively, our results suggest that the P. falciparum genome organization and gene expression are strongly interconnected.
Results
Assaying genome architecture of P. falciparum at three stages using Hi-C
To study the genome architecture of P. falciparum, we harvested parasites at three stages of the infected red blood cell cycle: after invasion of red blood cells at the ring stage (0 h), during high transcriptional activity at the trophozoite stage (18 h), and near the end of the cycle at the schizont stage (36 h), just before the newly formed parasites are released into the bloodstream. Next, we applied the Hi-C protocol (Kalhor et al. 2011) with modifications to accommodate the extremely AT-rich genome of the malaria parasite (Fig. 1A; Supplemental Note 1; Supplemental File 1). As a control, we prepared a sample for which chromatin contacts were not preserved by cross-linking of DNA and proteins.
Figure 1.
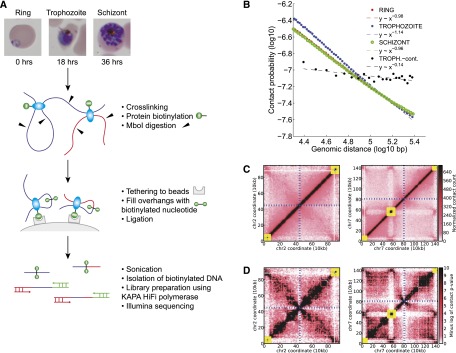
Tethered conformation capture of the Plasmodium falciparum genome. (A) Experimental protocol. (B) Contact probability as a function of genomic distance, with log-linear fits for the three erythrocytic stages, as well as an experimental control. (C) Normalized contact count matrices at 10-kb resolution for chromosome 2 and chromosome 7 in the schizont stage. (D) Contact P-values (negative log10 scale) for chromosome 2 and chromosome 7 in the schizont stage. In C and D, yellow boxes denote clusters of VRSM genes, and blue dashed lines indicate the centromere location.
We evaluated the quality of the resulting data for each sample. First, we confirmed that the contact probability between two intrachromosomal loci exhibits a log-linear decay with increasing genomic distance (Fig. 1B; Supplemental Fig. 1). Second, we obtained lower numbers of interchromosomal contacts from cross-linked samples relative to both random expectation and our control sample (Supplemental Table 1). Third, we observed that the percentage of long-range contacts (either interchromosomal or intrachromosomal >20 kb) was significantly higher than control and comparable to the numbers observed in yeast (Duan et al. 2010; Supplemental Table 1). Together, these results indicated that we successfully assayed the P. falciparum genome architecture with a high signal-to-noise ratio. We then coalesced the mapped read pairs into a raw contact count matrix at 10-kb resolution, and we corrected for potential technical and experimental biases (Fig. 1C; Supplemental Fig. 2; Imakaev et al. 2012). The resulting normalized contact maps were used to identify a subset of high-confidence contacts for each stage (Methods; Supplemental Note 2; Supplemental File 2; Ay et al. 2014). We identified pairs of genes that show evidence of stage-specific contacts (Methods) and then applied gene set enrichment analysis to the set of genes that participate in such contacts. This analysis identified significant enrichment of VRSM genes for the ring and trophozoite stages (Supplemental Table 2). This observation suggests that the proximity between some VRSM clusters changes from the ring to trophozoite stages, even though both stages show overall colocalization of VRSM clusters. A similar enrichment analysis conducted using contacts that are specific to two out of three stages resulted in no significant enrichment due to the small number of genes involved in such contacts.
Normalized contact count and confidence score matrices exhibit a canonical “X” shape, indicative of a folded chromosome architecture anchored at the centromere, as previously observed in yeast (Duan et al. 2010; Tanizawa et al. 2010) and the bacterium C. crescentus (Fig. 1C,D; Supplemental Fig. 3; Umbarger et al. 2011). However, chromosomes that harbor nonsubtelomeric clusters of genes involved in antigenic variation and immune evasion (Supplemental File 3) (VRSM genes: var, rifin, stevor and Pfmc-2tm)—chromosomes 4, 6, 7, 8, and 12—exhibit additional folding structure (Fig. 1C,D; Supplemental Fig. 3).
Three-dimensional modeling recapitulates known organizational principles of Plasmodium genome
To better characterize the genome architecture, we generated 100 consensus 3D structures for each stage, each of which summarizes the population average (Fig. 2A; Methods), using multidimensional scaling (MDS) with two primary constraints (Duan et al. 2010): (1) the DNA must lie within a sphere with a specified diameter (Bannister et al. 2005; Weiner et al. 2011), and (2) adjacent 10-kb loci must not be separated by more than 91 nm (Bystricky et al. 2004). P. falciparum undergoes an atypical form of cell division, resulting in schizont stage parasites with multiple independent nuclei, each containing 1n chromosomes. Note that our model assumes that a single copy of each chromosome is present in each structure, thus averaging the signal from these multiple nuclei per cell.
Figure 2.

3D modeling and validation with DNA FISH. (A) 3D structures of all three stages. The nuclear radii used to model ring, trophozoite, and schizont stages were 350, 850, and 425 nm, respectively. Centromeres and telomeres are indicated with light-blue and white spheres, respectively. Midpoints of VRSM gene clusters are shown with green spheres. (B) Validation of colocalization between a pair of interchromosomal loci with VRSM genes (chr7: 550,000–560,000 that harbors internal VRSM genes and chr8: 40,000–50,000 that harbors subtelomeric VRSM genes) by DNA FISH (left) and by the three-dimensional model for the corresponding stage (right). The location of the loci in the 3D model is shown with light-blue spheres and indicated by black arrows. (C) Validation same as in B for a pair of interchromosomal loci that harbor no VRSM genes (chr7: 810,000–820,000 and chr11: 820,000–830,000).
We performed a series of experiments to assess the robustness of our 3D inference procedure. Our results showed only slight changes in the inferred 3D models when we varied the parameter used in conversion of contact counts to expected distances (Supplemental Table 3). This was also true when we removed from the inference the two types of spatial constraints related to nuclear volume and to distances between adjacent beads (Supplemental Table 4). Finally, our experiments on the impact of the initialization step (Methods) showed that structures inferred from different initial configurations are highly similar (Supplemental Fig. 4), do not fall into discrete clusters (Supplemental Fig. 5) and all such structures exhibit common organizational hallmarks (Supplemental Fig. 6). Because of the stability of our inference procedure, hereafter we generally present and discuss the results for only one representative structure per stage.
Although the modeling procedure contains no explicit constraints on telomere or centromere locations, we observe strong colocalization of both sets of loci across all three stages (Fig. 2A; Supplemental Fig. 7; Supplemental Table 5), with centromeres and telomeres localizing in distal regions of the nucleus. To understand further the colocalization patterns of centromeres and telomeres in each stage, we divided each chromosome into three compartments (left–mid–right or telomeric–centromeric–telomeric) using eigenvalue decomposition (Methods) and then performed hierarchical clustering on the matrix of pairwise distances between compartments (Supplemental Fig. 8). At each stage, we observed clusters that are comprised primarily of either centromeric or telomeric compartments. In particular, during the trophozoite stage, all of the centromeric compartments fall into two main clusters suggesting strong colocalization of all centromeres for this stage (Supplemental Fig. 8D). Such strong colocalization has previously been observed by immunofluoresence microscopy at the trophozoite and schizont stages but not at the early ring stage (Hoeijmakers et al. 2012). However, when the size of the nucleus is used as a marker of the parasite asexual cycle stage (Bannister et al. 2005; Weiner et al. 2011), the cells that are presented as trophozoites in this previous study (Hoeijmakers et al. 2012) are more similar to our ring-stage parasites, indicating that centromere clustering also occurs early in the erythrocytic cycle. Furthermore, if the centromeres are stochastically distributed between a small number of foci within a population, then an assay that measures average signal, such as Hi-C, will indeed demonstrate an aggregate clustering for the centromeres and not complete dispersion as suggested by a recent study (Lemieux et al. 2013). These results suggest that P. falciparum nuclei are highly structured around centromeres and telomeres, consistent with known organizational principles gathered through multiple independent microscopy experiments (Duraisingh et al. 2005; Dzikowski et al. 2007; Lopez-Rubio et al. 2009; Hoeijmakers et al. 2012).
Virulence gene clusters on different chromosomes colocalize in 3D
In addition to centromeres and telomeres, we observed for all VRSM gene clusters, both internal and subtelomeric, a significant colocalization with one another (Fig. 2A; Supplemental Table 5). The significant colocalization for VRSM clusters as well as for centromeres and telomeres were all reproducible when we used contact counts instead of 3D distances to perform colocalization tests similar to Supplemental Table 5 (data not shown). Given colocalization of the telomeres, colocalization of subtelomeric clusters is not surprising. However, the proximity of internal VRSM clusters with one another and with subtelomeric clusters is unexpected under the random polymer looping model and, to the best of our knowledge, observed experimentally for the first time. To further validate these results inferred from our 3D models, we performed DNA fluorescence in situ hybridization (FISH) (Methods; Supplemental Note 3) on an interchromosomal pair of strongly interacting (at 10-kb resolution) VRSM clusters: the internal cluster from chromosome 7 and a subtelomeric cluster from chromosome 8. We observed strong colocalization by FISH (>90% of cells) (Fig. 2B; Supplemental Fig. 9A; Supplemental Table 6), providing independent support for the clustering of VRSM genes. Although previous FISH results indicated that var genes form two to five clusters in 3D per cell (Freitas-Junior et al. 2000; Lopez-Rubio et al. 2009), others recently showed single foci for the VRSM gene-associated repressive histone mark H3K9me3 and heterochromatin protein 1 (PfHP1) (Dahan-Pasternak et al. 2013), as well as for H3K36me3 that marks both active and silenced var genes (Ukaegbu et al. 2014). Because our experimental strategy (Hi-C) captures a population average, we are unable to distinguish between multiple VRSM gene clusters in 3D if the genes are randomly distributed among clusters from cell to cell. Using FISH experiments, we also observed strong colocalization (>90% of cells) (Fig. 2C; Supplemental Fig. 9B) for a pair of interchromosomal loci located outside VRSM clusters with consistent strong interactions at all three stages, while colocalization was not observed for a pair of noninteracting interchromosomal loci (<10% of cells, Supplemental Fig. 9C). These results demonstrate that our population average Hi-C data agrees with a majority of single cell FISH images.
Highly transcribed rDNA units colocalize in 3D during the ring stage
Similar to VRSM genes, the rDNA genes are strictly regulated during the parasite life cycle. In P. falciparum, these genes are dispersed on different chromosomes in five rDNA units containing the 18S, 5.8S, and 28S genes and one repeat unit consisting of three copies of the 5S gene. A previous FISH study suggested that all rDNA units localize at a single nucleolus but also claimed that the two units on chromosomes 5 and 7 that are actively transcribed during the ring stage (A-type units) are dispersed in the ring stage (Mancio-Silva et al. 2010). However, a more recent Hi-C study of ring-stage parasites demonstrated strong clustering of these two A-type units in multiple strains (Lemieux et al. 2013). Analysis of our Hi-C data confirmed overall enrichment of contacts between chromosomes 5 and 7 in all three stages and showed a particular peak of enrichment centered at the rDNA unit on chromosome 5 among all interchromosomal contact partners of the rDNA unit on chromosome 7 in the ring stage (3.32×) (Fig. 3A). We observed less striking enrichment of contacts that are not specific to or centered on the rDNA units for the other two stages (trophozoites [1.99×], schizonts [1.23×]) (Fig. 3B,C) during which the two rDNA units are not transcribed (Mancio-Silva et al. 2010). Reanalysis of the Lemieux et al. (2013) data using our processing pipeline also showed this enrichment consistently in three different NF54-derived strains in the ring stage (6.06×, 4.47×, and 4.61×, respectively, Supplemental Fig. 10A–C). Control libraries from both studies do not exhibit this enrichment (Fig. 3D; Supplemental Fig. 10D). Our 3D models for the ring stage place these two A-type rDNA units near the nuclear periphery. Together with the strong colocalization between A-type rDNA, these results suggest the existence of perinuclear transcriptionally active compartments. Such compartments may play a role in separating out the single active var gene per cell from compact chromatin around (sub)telomeric regions marked by the repressive H3K9me3 modification (Lopez-Rubio et al. 2009). We did not observe an overall colocalization between all rDNA units in the ring stage, including the three 18S, 5.8S, 28S units and one 5S unit that are not expressed during asexual erythrocytic cycle (Supplemental Table 5). This observation suggests that genomic location may influence rDNA expression by the preferential colocalization of the expressed rDNA units, away from the nonexpressed units.
Figure 3.

Colocalization of highly transcribed rDNA units. Virtual 4C plots generated at 25-kb resolution using as bait the A-type rDNA unit on chromosome 7 from cross-linked Hi-C libraries of ring (A), trophozoite (B), schizont stages (C), and from the trophozoite control library (D). Vertical red line indicates the midpoint of the A-type rDNA unit on chromosome 5. Normalized contact counts from 50 kb upstream of and downstream from the 25-kb bin containing the rDNA unit are used, omitting the rDNA-containing window itself to exclude repetitive DNA. For each window w on chromosome 5, the contact enrichment is calculated by dividing the contact count between the bait and w to the average interchromosomal contact count for the bait locus.
Transcriptionally active trophozoite stage exhibits an open chromatin structure
Assaying three different time points, we observed significant changes in chromatin structure throughout the erythrocytic cycle. To visualize high-level changes, we generated animations showing the movement of chromosomes as the parasite progresses through its cell cycle (Supplemental Files 4–18). We then characterized global chromatin changes by analyzing the relationship between contact frequency and genomic distance (Fig. 1B; Supplemental Fig. 1). The gradient of the log-linear fit is very close to −1 in both the ring and schizont stages (−0.98 and −0.96, respectively), indicative of a fractal globule genome architecture that is usually found in higher eukaryotes (Lieberman-Aiden et al. 2009). Intriguingly, the intermediate and most active transcriptional stage yields a log-linear fit value with gradient −1.14, a value between the fractal (−1) and the equilibrium globule (−1.5) model suggested in yeast (Fudenberg and Mirny 2012) and indicative of more chromosomal intermingling. Indeed, a value of −1.17 has been demonstrated to correspond to a state of “unentangled rings” similar to the fractal globule state, in which the rings may correspond to long chromosomal regions looped on or anchored to a nuclear scaffold (Vettorel et al. 2009). It is important to note that the value of the gradient is determined solely by Hi-C contact counts and, therefore, the above-mentioned difference is independent of our 3D modeling and the change in the nuclear radius from one stage to another. Furthermore, the difference in the gradient value for trophozoites compared with the two other stages is consistent for each chromosome, suggesting that all chromosomes change their folding behavior during the trophozoite stage (Supplemental Table 7).
In order to further investigate whether trophozoites show a more open chromatin structure than the two other stages, we systematically compared our data across all three stages. First, we computed and compared intra- and interchromosomal contact probabilities for each stage (Supplemental Fig. 11). We observed that intrachromosomal contacts, even at very large distances, are more prevalent than interchromosomal contacts for all three stages, suggesting the existence and preservation of chromosome territories throughout the erythrocytic cycle. However, the enrichment in intrachromosomal contacts was the lowest for trophozoite stage for distances above 300 kb, suggesting a relative loss of territories in this stage compared with the other two. Second, we quantified how preserved the chromosomal territories are at each stage by estimating the degree of chromosome intermingling in our 3D models. We randomly sampled small spheres in the nucleus and asked, for each chromosome i, what percentage of the spheres that contain any locus from chromosome i also contain a locus from another chromosome j. Our results using different sphere sizes, and controlling for the varying nuclear diameter, consistently exhibited the highest amount of intermingling for the trophozoite stage and the highest territory preservation for the schizont stage (Supplemental Fig. 12).
To understand the architectural dynamics responsible for the systematic changes in chromatin compaction, we computed the relative movements among chromosome compartments during the erythrocytic cycle. Despite the increase in nuclear volume, many interchromosomal compartment pairs came closer together in the transition from the ring to the trophozoite stage (Supplemental Fig. 13A, red). Subsequently, most interchromosomal compartments moved away from each other in the transition to the schizont stage (Supplemental Fig. 13B, blue), resulting in more compact chromatin that favors formation of chromosome territories. These results are consistent with a previously proposed model, in which the P. falciparum nucleus exhibits a more open chromatin configuration at the trophozoite stage, enabling interchromosomal contacts and high levels of transcriptional activity (Ponts et al. 2010).
Plasmodium genome architecture cannot be explained by volume exclusion
We next assessed whether the primary architectural features in P. falciparum arise from a population of constrained but otherwise random configurations of chromatin following a simple volume exclusion (VE) model, as recently shown for Saccharomyces cerevisiae (Tjong et al. 2012). We therefore repeated the Tjong et al. simulations using the same set of constraints and successfully recovered the strong correlation between the simulated map and the experimentally observed yeast contact map (raw correlation of 0.91; normalized correlation of 0.57) (Fig. 4A; Methods; Supplemental Note 4; Supplemental Fig. 14). In contrast, our simulations for the ring, trophozoite and schizont stages of P. falciparum yielded markedly lower correlations (normalized correlation of 0.34, 0.39, and 0.49, respectively) and strikingly different contact maps compared with the experimentally observed maps (Fig. 4B). One significant reason for the observed discrepancy between yeast and P. falciparum is the lack of structure around clusters of VSRM genes in the simulated data (Fig. 4B). Accordingly, we conclude that the simple volume exclusion model, which so convincingly explains the yeast genome architecture, is insufficient to explain the observed architecture of P. falciparum genome, highlighting the need for a genome-wide assay such as Hi-C to obtain accurate structural models.
Figure 4.

Volume exclusion modeling. Observed/expected contact frequency matrices illustrate, for each locus, either the depletion (blue) or enrichment (red) of interaction frequencies compared with what would be expected given their genomic distances. (A) Observed/expected contact frequency matrices derived from S. cerevisiae chr 7 from volume exclusion modeling (left) and Hi-C data (right). (B) Observed/expected matrices from volume exclusion modeling (left) and Hi-C data (right) for P. falciparum chr 7 during the trophozoite stage.
VRSM gene clusters form domain-like structures
Our results from the volume exclusion modeling and from visual inspection of the contact maps suggest that the internal VRSM gene clusters are associated with distinctive structural features. All eight of the internal VRSM clusters induce a striking cross-like shape, both in the contact count and 3D distance matrices (Fig. 5A,B; Supplemental Fig. 3). Quantification of this phenomenon revealed a consistent contact pattern across all eight internal VRSM clusters (Supplemental Fig. 15), suggesting that VRSM gene clusters adopt a compact, domain-like structure. Although these domain-like structures resemble topologically associated domains (TADs) described in mammals (Dixon et al. 2012; Nora et al. 2012), the VSRM domains are much smaller (10–50 kb) compared with TADs (0.1–1 Mb). Furthermore, because VRSM genes have no orthologs in human and mouse, mechanisms regulating these domain-like structures likely differ from those in mammalian genomes. Further understanding of how these VRSM domains are formed in Plasmodium would shed light on genome architecture associated regulation of VRSM gene expression.
Figure 5.

Role of internal VRSM gene clusters in shaping genome architecture. (A–D) Heatmaps of scaled pairwise Euclidean distances derived from the 3D model at 10-kb resolution for two chromosomes that harbor internal VRSM gene clusters (A,B) and two chromosomes that do not (C,D). Yellow boxes indicate locations of VRSM clusters.
Another interesting pattern involving internal VRSM clusters emerged from further inspection of chromosome compartments. Five of the eight internal VRSM clusters (two on chromosome 4, one on chromosome 7, and both clusters on chromosome 12) occur at compartment boundaries (third and fourth rows of Supplemental Fig. 3). This striking overlap suggests that VRSM genes may contribute to or rely upon the boundaries of chromosomal compartments. Taken together with the domain-like structures around these VRSM clusters, these results confirm that genome architecture is likely to be involved in the strict regulation of virulence genes during the erythrocytic cycle.
Expression is highly concordant with 3D localization for Plasmodium genes
Next, we investigated the relationship between the three-dimensional genome structure and gene expression using four published expression data sets (Le Roch et al. 2003; Otto et al. 2010; Lopez-Barragan et al. 2011; Bunnik et al. 2013). First, we observed that, for each of the three stages, interchromosomal pairs of genes that strongly interact (contact counts within the top 20%) as well as gene pairs that are in close proximity (<20% of the nuclear diameter) showed more correlated expression profiles than genes that are far apart (Fig. 6A,B), as previously observed in yeast (Homouz and Kudlicki 2013). To assess whether these observed trends are confounded by similarly expressed VRSM genes that strongly interact with each other and are placed together near telomeres by our 3D model, we repeated the above analyses by excluding all VRSM genes (Supplemental Fig. 16). Even though the observed trends are weakened by exclusion of VRSM genes, the decrease in 3D distance and increase in contact count with increasing expression correlation remained significant (Supplemental Fig. 16). It is also important to note that, for these analyses, we excluded intrachromosomal gene pairs to only focus on the relationship between 3D proximity and gene expression by eliminating the confounding effect caused by genes that lie nearby on a chromosome and show similar expression profiles. Second, we analyzed gene expression in relation to the repressive subtelomeric clusters (Duraisingh et al. 2005; Dzikowski et al. 2007; Lopez-Rubio et al. 2009) and other nuclear landmarks. The subset of genes that lie within 20% of the nuclear diameter to the centroid of the telomeres showed significantly lower expression levels than more distal genes (Fig. 6C). The repressive effect of the subtelomeric clusters is apparent in all three stages and is strongest at the trophozoite stage, in which subtelomeric VRSM clusters are known to be tightly repressed (Chen et al. 1998). If we remove the VRSM genes from the analysis, the repressive effect is still significant at the trophozoite stage, which is known to be the most active transcriptional stage of the erythrocytic cycle (Supplemental Fig. 17A,B). Similar analysis showed higher expression levels for genes located near the nuclear center, as well as for genes close to the centroid of the centromeres (Supplemental Fig. 17C,D). Furthermore, we observed significant and consistent colocalization across all three stages for 11 of the 15 expression clusters identified in Le Roch et al. (2003) (Supplemental Table 5). Strikingly, the trophozoite stage showed significant colocalization for clusters associated with genes that are repressed during this stage (clusters 1, 3, 4, and 13–15) as well as genes that exhibit high levels of expression (clusters 6, 9, 10, and 12), confirming the strong relationship between 3D location and gene expression.
Figure 6.

Relationship between 3D architecture and gene expression. (A) Correlation between expression profiles of pairs of interchromosomal genes as a function of number of contacts linking the two genes. To generate this plot, all interchromosomal gene pairs are first sorted in increasing order of their expression correlation and then binned into 20 equal width quantiles (fifth, 10th, …, 100th). For each bin, the average expression correlation between gene pairs (x-axis) and the average normalized contact count linking the genes in each pair together with its standard error (y-axis) are computed and plotted. Interchromosomal gene pairs that have contact counts within the top 20% for each stage have more highly correlated expression profiles than the remaining gene pairs (Wilcoxon rank-sum test, P-values 2.48 × 10−206 [ring], 0 [trophozoite], and 0 [schizont]). (B) Correlation between expression profiles of pairs of interchromosomal genes as a function of 3D distance between the genes. This plot is generated similarly to A but using 3D distances instead of contact counts (y-axis). In order to summarize results from multiple 3D structures per each stage, we plot the median value among 100 structures with a red line and shade the region corresponding to the interval between the fifth and 95th percentile with gray. Interchromosomal gene pairs closer than 20% of the nuclear diameter have more highly correlated expression profiles than genes that are far apart (Wilcoxon rank-sum test, P-values 7.17 × 10−221 [ring], 0 [trophozoite], and 1.57 × 10−88 [schizont]). (C) Gene expression as a function of distance to telomeres. To generate this plot all genes are first sorted by increasing distance to the centroid of telomeres (x-axis) and then binned similar to A into 20 equal width quantiles. The average log expression value (Bunnik et al. 2013) together with its standard error (y-axis) is plotted for genes in each bin. In order to summarize results from multiple 3D structures per each stage, we plot the median value among 100 structures with a red line and shade the region corresponding to the interval between fifth and 95th percentile with gray. Genes that lie within 20% of the nuclear diameter to the centroid of the telomeres showed significantly lower expression levels (Wilcoxon rank-sum test, P-values 1.54 × 10⁻¹² [ring], 1.69 × 10⁻³² [trophozoite], 3.37 × 10⁻²⁰ [schizont]). (D) First KCCA expression profile component score, corresponding to the projection of the gene expression profile onto the extracted KCCA profile for the trophozoite stage.
To further explore the relationship between gene expression and 3D structure, we utilized an unsupervised learning method known as “kernel canonical correlation analysis” (KCCA) (Bach and Jordan 2002). This methodology identifies a set of orthogonal gene expression profiles that exhibit coherence with respect to the 3D structure (Methods). For all stages, the projection of gene expression patterns onto the first extracted profile exhibits a striking transcriptional gradient across the 3D structure, from the telomere cluster to the opposite side of the nucleus (Fig. 6C; Supplemental Fig. 18A,C,E). The coherence with 3D structure drops significantly in the second component of the KCCA (Supplemental Fig. 18B,D,F), suggesting that gene expression is strongly influenced by distance to the subtelomeric repressive center. To further interpret the KCCA results we used gene set enrichment analysis (Subramanian et al. 2005) on the ranked lists of projections onto the first KCCA component. The results showed, for all three stages, significant enrichment (Q-value < 0.01) of gene sets related to antigenic variation and translation (i.e., ribosome proteins) on the telomeric and nontelomeric side, respectively, of the extracted KCCA expression profile (Supplemental Tables 8, 9, 10). Similar to the colocalization test results for expression clusters of Le Roch et al. (2003), clusters of genes that are repressed (clusters 4, 13, and 14) and expressed (clusters 6 and 9–12) in the trophozoite stage showed consistent enrichment in the strongest KCCA profile (Supplemental Table 11). In addition, genes exclusively expressed in sporozoites (cluster 1) and gametocytes (cluster 3) were also strongly enriched, indicating that the repression of these genes during the asexual erythrocytic cell cycle may be related to their localization within the nucleus. Finally, for GO terms related to parasite invasion (rhoptry, myosin complex, motor activity; Q-value < 0.1) and for the cluster of invasion genes (cluster 15), we observed an enrichment relative to the second KCCA component, suggesting that expression of invasion genes may also be regulated by the 3D genome structure (Supplemental Tables 11, 12).
Discussion
This study presents the first analysis of genome architecture during the cell cycle of a eukaryotic pathogen. Overall, our data demonstrate that the genome of P. falciparum exhibits a higher degree of organization than the similarly sized budding yeast genome. Although localization of chromosomes within the P. falciparum nucleus is partially dictated by size constraints, the simple volume exclusion model observed in yeast is insufficient to explain the 3D architecture of the P. falciparum genome. In particular, a striking spatial complexity is added by clusters of virulence genes, which function as critical structural elements that shape the genome architecture. Furthermore, our model correlates well with expression levels of parasite-specific gene sets and shows strong clustering of repressed genes and highly transcribed rDNA units, indicative of a nonrandom genomic organization that contributes to gene regulation during the asexual erythrocytic cycle. Considering the strong association between nuclear architecture and gene expression as well as the observed domain-like structures, Plasmodium species may be excellent model organisms to study the impact of genome structure on gene regulation. The lower complexity of genome organization in organisms with similarly sized genomes, such as yeast, may indeed be less informative for such investigations.
Assaying multiple time points during the parasite’s erythrocytic cycle revealed intriguing changes in genome structure between the different developmental stages. Our results show that the genome adopts a more open conformation during the trophozoite stage consistent with high transcriptional activity in this stage of the erythrocytic cycle, followed by compaction of chromosomes into discrete chromosome territories before reinvasion of a new host cell. A similar pattern was observed previously for nucleosome occupancy, with strong histone depletion at the trophozoite stage and nucleosome replacement at the schizont stage (Ponts et al. 2010). Based on these observations, we hypothesize that the spatial genome organization of P. falciparum, coupled with its dynamic chromatin structure, acts as an important alternative mechanism of transcriptional regulation, possibly compensating for the lack of a diverse collection of specific transcription factors (Coulson et al. 2004; Balaji et al. 2005) and the low capacity of the parasite to regulate gene expression in response to metabolic stress (Ganesan et al. 2008; Le Roch et al. 2008). These changes in genome architecture could mainly be indicative of differences between the various developmental stages of the parasite, but could also be related to cell cycle progression itself. Given the importance of nuclear architecture for regulation of gene expression, disruption of its genome organization is likely to interfere with parasite development through the erythrocytic cycle and could therefore be lethal to the parasite. Compounds targeting proteins involved in establishing and maintaining the three-dimensional genome structure in P. falciparum may thus have potent antimalarial activity.
A recently published Hi-C study suggested that chromosomal territories are absent in the ring-stage parasites, especially for larger chromosomes (Lemieux et al. 2013). In contrast, our data provides multiple lines of evidence for the existence of chromosome territories throughout the erythrocytic cell cycle. In particular, we observed that intrachromosomal contacts, even at very large distances, are more prevalent than interchromosomal contacts. This observation is supported by our own Hi-C data in three stages as well as by our reanalysis of the Lemieux et al. (2013) data (Supplemental Fig. 11B–E). The difference between the two analyses can be traced to our improved method for discretizing the genomic distance axis, which avoids bins with few observations and, hence, high variance (Supplemental Fig. 11, A vs. B). Even though further experiments may be necessary to reconcile these differences, our results strongly suggest that P. falciparum chromosomes occupy distinct territories, similar to other eukaryotic genomes.
Clustering of virulence gene families into a distinct nuclear compartment is likely to play an important role in the formation of repressive heterochromatin that controls the silencing of these genes. Heterochromatin around virulence genes is characterized by histone modifications H3K36me3 (Jiang et al. 2013) and H3K9me3 (Duraisingh et al. 2005; Lopez-Rubio et al. 2009), both of which were shown to be essential for maintaining var gene repression. The formation of heterochromatin is directed by the interaction of PfSIP2 with specific DNA motifs in promoters of virulence genes and in subtelomeric domains (Flueck et al. 2010), but additional factors are likely to contribute to this process. The question remains, however, how the formation of this repressive center is regulated and whether the colocalization of virulence gene clusters is a cause or a consequence of their transcriptional silencing. One experiment that would shed light on this issue would be to relocate a var gene to a different location in the genome and to monitor how the introduction of this novel var gene locus influences genome structure, although technical challenges that come with manipulation of the P. falciparum genome may prevent such procedures. Virulence genes are expressed on the surface of red blood cells and are therefore important antigens for the humoral immune system. A better understanding of virulence gene silencing will provide us with more opportunities to interfere with this process, which would ultimately benefit vaccine development.
In this study, we modeled the P. falciparum genome architecture based on the average signal from a population of parasites. However, it can be expected that considerable variability in genome conformation exists from cell to cell, as recently demonstrated in mouse (Nagano et al. 2013). While challenging, it would be interesting to perform Hi-C analysis on individual parasites to reveal the extent of intercellular variation in P. falciparum genome architecture. This experiment would also allow a more detailed analysis of the clustering of var genes in one or multiple repressive centers, as well as the differential localization of the single active var gene.
In conclusion, this study demonstrates the unique role of genome organization in transcriptional regulation in the human malaria parasite. In other eukaryotes such as human and mouse, genome organization has been shown to participate in gene regulation through formation of specific chromatin loops that bring enhancers and enhancer-like elements in proximity to their target promoters. However, a global reorganization of the entire genome correlated with changes in transcriptional capacity, as described here for P. falciparum, has not been observed for any of the genomes studied so far. Therefore, our data proposes a novel mechanism of gene regulation for P. falciparum that can operate without relying on specific transcription factors or enhancer elements. Similar to other eukaryotes, gene expression in P. falciparum is likely to be regulated by multiple layers of control at both transcriptional and translational levels. However, the necessity to transcriptionally repress distinct groups of parasite-specific genes may have driven P. falciparum to adopt this exceptional genome organization.
Methods
Experimental protocols
P. falciparum strain and culture conditions
P. falciparum strain 3D7 was maintained in human O+ erythrocytes in 5% haematocrit according to a previously described protocol (Trager and Jensen 1976). Cultures were synchronized twice at ring stage with 5% D-sorbitol treatments performed 8 h apart (Lambros and Vanderberg 1979). Parasites were harvested 48 h after the first sorbitol treatment (0 h; ring stage), and then 18 h (early trophozoite stage) and 36 h (late schizont stage) thereafter. The developmental stage of the parasites was verified by microscopy using Giemsa-stained blood smears prior to harvesting.
Cross-linking
Aspirated P. falciparum cultures were pooled into 50-mL centrifuge tubes and filled up to 35 mL with phosphate buffered saline (PBS) warmed to 37°C. Cultures were treated with 3 mL 16% formaldehyde (1.25% final concentration) and incubated for 25 min at 37°C while rocking. Formaldehyde was quenched with 5.2 mL 1.25 M glycine (final concentration 150 mM) for 15 min at 37°C while rocking, followed by 15 min at 4°C while rocking. PBS was used instead of formaldehyde and glycine for the not cross-linked control. Cultures were spun at 660g for 20 min at 4°C. Not cross-linked control parasites were treated with 5 volumes 0.15% saponin in water and incubated 10 min at 4°C while rocking. PBS was used instead of saponin for the cross-linked parasites. Parasites were spun at 660g for 15 min at 4°C. Pellets were washed multiple times until clean and stored at −80°C.
Tethered conformation capture procedure
We applied an adapted Hi-C method referred to as tethered conformation capture (TCC) (Kalhor et al. 2011) to map the intra- and interchromosomal contacts in Plasmodium falciparum. For a detailed description of the overall protocol see Supplemental Note 1.
DNA-FISH
For each 10-kb locus of interest, we determined the location for which, on average, the highest number of contact counts were observed and designed DNA probes targeting the 2-kb region surrounding this location. Probes were prepared using Fluorescein-High Prime and Biotin-High Prime kits (Roche) according to manufacturer’s instructions. Template DNA was prepared by PCR (5 min at 95°C, 35 cycles of 30 sec at 98°C, followed by 150 sec at 62°C, and 5 min at 62°C) using the KAPA HiFi DNA Polymerase HotStart ReadyMix. Sequences of primers used for probe generation are shown in Supplemental Table 6. For a detailed description of the DNA-FISH protocol, see Supplemental Note 3. The percentage of colocalization was determined by visual inspection of >100 cells per condition.
Computational methods
Mapping and filtering of sequence data
We first trimmed each end of the paired-end reads from all samples to 40 bp. We used FastQC (Andrews 2010) reports of aggregate read qualities for each sample to determine the amount of trimming required from each end of the read to keep the highest quality 40-bp region.
To filter out reads from human DNA, we mapped the trimmed paired-end reads to the human genome (UCSC hg19) using the short read alignment mode of BWA (v0.5.9) (Li and Durbin 2010) with default parameter settings. Each end of the paired reads was mapped individually. We post-processed the alignment results to extract reads that mapped with an edit distance of at most 3. We then eliminated all pairs for which at least one of the ends mapped to the human genome without any filtering on the mapping quality or uniqueness. This loose mapping criteria is used to assure that any read pair that is likely to come from human blood contamination in the parasite samples is filtered out from our further analysis of Plasmodium genome architecture.
We mapped the remaining paired-end reads to the Plasmodium falciparum 3D7 reference genome (PlasmoDB v9.0). We post-processed the alignment results further to extract the reads that mapped (1) uniquely to one location in the reference genome, (2) with an alignment quality score of at least 30 (which corresponds to a one in 1000 chance that the mapping is incorrect), and (3) with an edit distance of at most 2. We extracted the paired-end reads with both ends mapping to the Plasmodium genome. We then identified potential PCR duplicates, i.e., pairs of read-pairs with identical genomic coordinates, and retained only one copy of each. We also filtered out reads that map to intrachromosomal loci that are ≤1-kb apart. We refer to the remaining reads as “informative reads.” We computed chromosomal contact maps using only these informative reads. Supplemental File 1 summarizes the results of applying this pipeline to our sequencing libraries.
Calculating noise level and percentage of long-range contacts
We calculated two measures that provide estimates of the noise level and efficiency of the assay. The first is the interchromosomal contact probability (ICP) index (Kalhor et al. 2011):
 |
In the denominator, the intrachromosomal contact counts exclude contacts between pairs of loci ≤1-kb apart. Smaller ICP values indicate a better signal-to-noise ratio, assuming that the real data (signal) will be enriched for intrachromosomal contacts, whereas noise will be dominated by interchromosomal contacts. The second number is the percent of long-range contacts (PLRC) extracted from the initial set of paired-end reads that remain after filtering the reads that mapped to human genome:
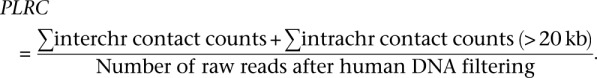 |
The bigger this percentage is, the more information the data set provides about nonadjacent chromatin contacts for the amount of sequencing in hand.
Aggregating data relative to 10-kb windows
Digesting the DNA with a frequently cutting restriction enzyme yields a very large number of possible pairs of restriction fragments (i.e., locus pairs). In our case, digesting the Plasmodium genome with MboI, which cuts at the 4-bp recognition site “GATC,” yielded 28,784 fragments (mean length 810 bp) corresponding to 33,114,193 intrachromosomal and 336,629,028 interchromosomal locus pairs. For 3D modeling, we partitioned the Plasmodium genome into a collection of nonoverlapping 10-kb windows, and we assigned each restriction fragment to the 10-kb window that covers the majority of the bases in the fragment. This operation reduced the number of possible fragments from 28,784 to 2337 and the number of possible locus pairs from 3.7 × 10⁸ to 2,715,615 (228,539 intrachromosomal and 2,487,076 interchromosomal).
Normalizing raw contact maps
For each possible pair of 10-kb loci, we refer to the total number of informative read pairs that link the two loci as the “contact count,” and we refer to the two-dimensional matrix containing these contact counts as the “raw contact map.” We normalized the raw contact maps in two steps. First, we ranked loci by their percentage of intrachromosomal contacts with zero counts, and we filtered out the top 2% of this list. This removes all loci for which the signal to noise ratio is too low (typically, regions of low mappability). Second, we applied an iterative correction and eigenvector decomposition (ICE) method (Imakaev et al. 2012) that attempts to eliminate systematic biases in Hi-C data. The method estimates a bias vector with one entry per locus. The tensor product of the bias vector with itself generates a bias matrix B that can be used to convert the raw contact map into a normalized contact map.
Estimating power-law fits to intrachromosomal contact probabilities
It has been observed in the literature that for a pair of intrachromosomal loci, the relationship between genomic distance and the expected contact count can be estimated by a log-linear model (Lieberman-Aiden et al. 2009; Fudenberg and Mirny 2012). This log-linear model is captured by a power-law fit of the form P(s) ~sα, where s denotes the genomic distance, P(s) denotes the expected contact probability at distance s, and α is the gradient of the log-linear fit. For each stage, we first calculated P(s) by segregating all intrachromosomal locus pairs into b = 50 equal-occupancy bins. This procedure involves enumerating all possible intrachromosomal locus pairs (including pairs that have a contact count of zero), sorting the pairs in increasing order according to their genomic distances, and then segregating the resulting list into b quantiles. For each bin i, we computed the average number of contact counts per locus pair  , and the average contact distance
  over all locus pairs in the bin. Then, for each bin i,
where N is the sum of all observed intrachromosomal contact counts. We then found the best linear fit to log P(s) versus log s in a given genomic distance range. Note that the control library “TROPH.-cont.” was not subjected to normalization.
Assigning statistical significance to normalized contact maps
To obtain a set of high-confidence contacts for each stage, we subjected the contact maps at 10-kb resolution to a statistical confidence estimation procedure (Ay et al. 2014). We first accounted for the effect of genomic distance on the intrachromosomal contact probability by fitting a smoothing spline to capture this effect. We then accounted for biases using the normalization procedure described above. Finally, we calculated P-values for intra- and interchromosomal contacts and corrected them jointly for multiple hypothesis testing to compute Q-values, which are used to filter contacts at a desired false discovery rate. For a detailed description of the statistical significance estimation procedure see Supplemental Note 2.
Identifying stage-specific contacts
We determined the contacts that are specific to only one stage or to two out of three stages as follows. First, we sorted the lists of contacts at 10-kb resolution according to increasing P-values computed as described above for each stage. Then, we extracted contacts that are ranked in top 1000 in each stage and checked to see whether they appear among top 10,000 contacts for the other two stages. We labeled these contacts as stage-specific because they are among the strongest contacts for one stage but not among moderately strong contacts for the other two stages. Similarly, we labeled contacts that are in the top 1000 in two out of three stages but not in the top 10,000 for the third stage. To perform gene set enrichment analysis (GSEA), we extracted the lists of genes that are involved in stage-specific contacts (only ring, only trophozoite, or only schizont) as well as contacts common to two stages (common to ring and trophozoite, common to ring and schizont, or common to trophozoite and schizont).
Inferring the 3D structures
Our method for inferring the 3D structures is based on the method of Duan et al. (2010). Each chromosome is modeled as a series of beads on a string, spaced ~10-kb apart. We associated with each pair of beads xi and xj a physical wish distance δij—i.e., the distance that we aim to capture with our 3D model—derived from the bead pair’s contact count cij. We then placed all the beads in 3D space such that the distance dij between the beads i and j is as close as possible to the wish distance δij.
Wish distances
To obtain the wish distances, we note that two proximal intrachromosomal loci are likely to come into contact due to random looping of the DNA, and that this “polymer packing” contact likelihood can be expressed as a function of the genomic distance s between the loci. We then assumed that two loci with observed contact count cij will have the same physical distance δij as two intrachromosomal loci with expected contact count cij by polymer packing. The relationship between the expected contact frequencies and the genomic distances s suggests that P. falciparum’s DNA behaves like a fractal globule polymer (Lieberman-Aiden et al. 2009) (Supplemental Fig. 1). Any crumpled polymer exhibits a well-defined relationship between its genomic length s and the physical distance d (Grosberg et al. 1988):
Therefore, using the relationship between genomic distances s and contact frequencies c, obtained by the fitting of the linear model, and the relationship between physical distances d and genomic distances s (Equation 1), we inferred a mapping between contact frequencies c and physical distances d up to a factor. We arbitrarily set the distance of the two beads with the smallest non-zero contact count cmin to be at a certain percentage β of the nucleus diameter. Note that cmin is not necessarily equal 1 since the contact counts are normalized. The β parameter hence sets the scaling of the physical distances. We then obtain
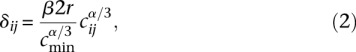 |
where r is the nucleus radius and α the coefficient obtained in the linear model fitting (range: 30–500 kb, α = −0.963 for rings, α = −1.124 for trophozoites, α = −1.013 for schizonts). We set all distances larger than the nucleus diameter to this value.
Optimization
Given the resulting physical wish distances, we defined the following optimization problem to find a structure X ∈ R3×n, where n is the number of beads:
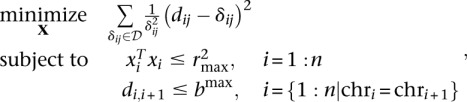 |
where dij is the Euclidean distance between beads xi and xj,  = {δij|δij ≠ 0} is the set of nonzero wish distances, and bmax is defined below.
The constraints are as follows:
All loci must lie within a spherical nucleus centered on the origin. Electron microscopy experiments show that the nucleus roughly resembles a sphere, with the radius depending on the stage of the organism. In this work, we use a nuclear radius of r = 350 nm for the ring stage, r = 850 nm for the trophozoite stage, and r = 425 nm for the schizont stage (Bannister et al. 2005; Weiner et al. 2011).
Two adjacent loci must not to be too far apart. A total of 1000 bp of chromatin occupies a distance between 6.6–9.1 nm (Berger et al. 2008). Because we use 10-kb resolution, we set bmax = 91 nm.
Initialization
We create a population of 100 independently optimized structures by initializing X randomly from a standard normal distribution.
Measuring similarities between structures
To compare pairs of structures (X, Y) we used the standard RMSD measure:
 |
where X is obtained by translating and rotating X. To compare structures of different scale (e.g., different β values), we seek, in addition of the translation and rotation factor, the scaling factor that minimizes the RMSD between structures.
Another similarity measure we use to compare two structures is the average difference of their pairwise distance matrices (at 10-kb resolution), which we denote by “distance difference”:
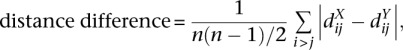 |
where dX and dY are the Euclidean distance matrices of the structures X and Y.
Clustering the population of structures
In order to see whether the structures fall into discrete groups, we computed the RMSD between pairs of structures and performed hierarchical clustering on the resulting 100 × 100 distance matrix for each stage (Supplemental Fig. 5).
Choosing the parameter β
As noted above, the parameter β controls the scaling of the inferred 3D structure. A small value of β will yield a structure with a very dense center, and a large value of β will push all beads against the nuclear envelope. The literature suggests that chromatin should abut the nuclear envelope (Weiner et al. 2011). Assuming the chromatin should also occupy the center of the nucleus, we ran the entire optimization multiple times, and we selected a value of β that yields a chromatin density as close as possible to a uniform distribution.
This procedure required that we estimate the density of chromatin at a distance ℓ from the center of the nucleus. To do so, we first created an intermediate function
where g(·) is a Gaussian (μ = 0, σ = 10 nm). The standard deviation σ of the Gaussian corresponds to the uncertainty of the position of each bead. The estimated density D(ℓ) was then computed as a generalized histogram, using discretized distance bins ℓi. To ensure that the volume was constant for each bin, the bin spacings were defined as ℓi = i1/3ℓ1, where we chose  . We then normalized the histogram to sum to one.
Let Di be the density of bin i and let nbins be the number of bins. To select β, we defined the scoring function
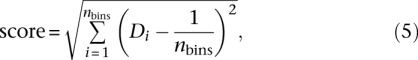 |
which corresponds to the mean squared error between the estimated density and the expected density. The resulting density scores are shown in Supplemental Table 13, with the minimal value for each stage in boldface.
Eigenvalue decomposition and chromatin compartments
To identify chromatin compartments, for each stage, we carried out eigenvalue decomposition on the matrix of Euclidean distances between locus pairs. For each chromosome we used the intrachromosomal 3D distance matrix at a resolution of 10 kb, where each 10-kb locus is represented by the 3D coordinate of its midpoint. We then calculated the Spearman correlation between each pair of rows of the 3D distance matrix and applied eigenvalue decomposition (using the eig function in MATLAB) to this correlation matrix. The sign of the first eigenvector defined a compartment assignment for each 10-kb locus at each stage. We also aggregated all three stages and calculated a set of aggregate compartments (Supplemental Fig. 3, fourth row of figures on each page) which divided each chromosome into three main compartments (i.e., telomeric-centromeric-telomeric or left[L]-mid[M]-right[R]).
Kernel canonical correlation analysis
We used an approach based on kernel canonical correlation analysis (KCCA) (Bach and Jordan 2002; Vert and Kanehisa 2003a,b) to extract gene expression profiles that simultaneously capture the variance of the gene expression data and exhibit coherence with respect to the 3D structure.
Let  be the set of n genes. Each gene g ∈
  is characterized by its log expression profile e(g) = [e1(g),…,ep(g)] ∈ ℝp at p timepoints and by its position x(g) ∈ ℝ3 in 3D space. We assume that the set of gene expression profiles is mean centered and unit variance scaled, i.e.,
 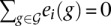 and
and
for i = 1,…, p.
Let v ∈ ℝp be a direction in the expression profile space. To assess whether v is representative of the observed expression profiles, we computed the percentage of variance explained among the gene expression profiles once they are projected onto v, defined by
 |
The larger V(v) is, the more v explains the differences between gene expression profiles, and the more likely v is to correspond to some biological event which influences the expression of many genes. V(v) is, for example, maximized by principal component analysis.
Instead of just asking the profile v to capture variance among gene expression, we simultaneously asked it to exhibit coherence with respect to the 3D structure. For that purpose, we defined for every f ∈ ℝn a function S(f) that quantifies how smoothly f varies in 3D. f can be thought of as a vector of scores, one score being assigned to each gene. Because we know the 3D coordinates of each gene we can imagine f as a set of scores in 3D. Following a standard approach in kernel methods (Schölkopf and Smola 2002), we quantified the smoothness of f with the function
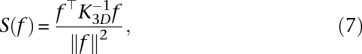 |
where K3D is the n × n matrix whose (i, j) entry is the Gaussian kernel between genes i and j, namely, exp[−‖x(i) − x(j)‖2/2σ2]. The smaller S(f) is, the more smoothly f is distributed in 3D.
We then combined the ideas of capturing variance (Equation 6) and being smooth in 3D (Equation 7) by designing a joint objective function over v and f to ensure that (1) v captures a lot of variance, (2) f is smooth in 3D, and (3) f is maximally correlated with the vector  . In other words, we aimed to ensure that genes that are positively correlated with v (and those which are negatively correlated) tend to be colocalized in 3D. We designed the function by following the approach of Bach and Jordan (2002), who show that v and f can be found by solving a KCCA problem equivalent to the following generalized eigenvalue problem:
 |
where K3D is the n × n matrix whose (i, j)-th entry is e(i)Te(j), and δ is a small regularization parameter. Once we found the generalized eigenvectors (α, β)T, ranked by decreasing eigenvalue ρ, we recovered a pair (v, f) by 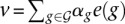 and f = K3Dβ.
We computed the profiles for several values of σ (0.01, 0.02, 0.05, 0.1) and δ (0.01, 0.02, 0.04, 0.06) and obtained highly correlated results (correlation >0.99 for all pairs of profiles). Therefore, we chose σ = 0.01 and δ = 0.02 for the rest of the analysis.
Gene set enrichment analysis
To detect set of genes highly or poorly correlated KCCA profiles, we apply gene set enrichment analysis (GSEA) (Subramanian et al. 2005). Unlike a traditional GO term enrichment analysis, this method takes as input a ranked list of genes rather than a set of genes; hence, GSEA takes full advantage of the results of the KCCA. The procedure detects sets of genes enriched at the top or at the bottom of the ranked list of genes. We applied GSEA to the ranked list of projections of expression profiles on the first and second extracted profile. Corresponding P-values were computed using 4000 permutations. We also used GSEA in our comparison gene sets that are involved in contacts that are specific to either one stage or two out of three stages.
Volume exclusion model
Following the methodology of Tjong et al. (2012), we constructed a population of three-dimensional structures by modeling chromosomes as random configurations subject to the following constraints:
Each chromosome is modeled as a series of N beads spaced 3.2-kb apart, with consecutive beads restrained to be 30-nm apart.
Overlaps between beads are prevented by imposing a volume exclusion constraint for all pairs of beads.
All chromosomes lie within a spherical nucleus of a specified radius.
All centromeres are colocalized in a small sphere of radius 50 nm abutting the nuclear envelope.
All telomeres are located within 50 nm of the nuclear envelope.
We formulated an optimization problem that includes, in addition to the constraints, a penalty term that accounts for chromatin stiffness by placing an angular restraint between three consecutive beads:
 |
where xi ∈ ℝ3 is the coordinate vector of bead i. We used the Integrated Modeling Platform (IMP) (Bau et al. 2011) to generate 5000 budding yeast structures with a nuclear radius of 1000 nm and 5000 Plasmodium structures for each of the three stages with nuclear radii of 350, 850, and 425 nm, respectively.
Following Tjong et al. (2012), we used the population of structures to generate a volume exclusion (VE) contact frequency matrix C, considering that two beads are in contact when they are ≤45-nm apart. The contact frequency matrix was then aggregated to a resolution of 32 kb and normalized following the ICE procedure as described above, resulting in a contact frequency matrix  for i, j = 1,…, N according to the VE model.
In order to compare the VE contact matrix to experimental Hi-C data, we similarly computed the Hi-C contact count matrix at a resolution of 3.2 kb, aggregated it at 32 kb, and normalized the same way as the VE contact frequency matrix to get a Hi-C contact matrix  for i, j = 1,…, N.
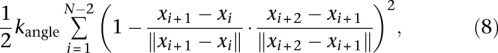
We then compared both matrices by computing the row-based Pearson correlation (Tjong et al. 2012) defined as the average Pearson correlation between their rows.
 |
Furthermore, we also computed a “normalized” row-based Pearson correlation between the matrices by replacing the counts  and
and  in Equation 9 by their ratio to an expected count
  that we would expect if there was no structural information in the matrix, besides the obvious decrease of contacts between loci at increasing genomic distance. To estimate the expected frequencies
  used to define the ratios, we fit an isotonic regression to the mapping between genomic distance and the average contact frequency at this genomic distance. The isotonic regression allows us to fit a non-increasing mapping between genomic distance and contact frequency, thus correcting the effect of enrichment of contact frequencies at chromosome ends. This mapping allowed us to define
  as the expected count corresponding to the genomic distance between loci i and j in the case of intrachromosomal contacts, and to the genome-wide average of interchromosomal counts in case of interchromosomal contacts.
Data access
The sequences and processed data files have been submitted to the NCBI Gene Expression Omnibus (GEO; http://www.ncbi.nlm.nih.gov/geo/) under accession number GSE50199. Additional supplementary data is available in the Supplemental Material and at http://noble.gs.washington.edu/proj/plasmo3d.
Acknowledgments
We thank Reza Kalhor for advice on the Hi-C protocol and Carolina Borsoi Moraes for advice on the FISH protocol; Harianto Tjong for sharing the source code for volume exclusion simulation on the yeast genome; John Weger, Rebecca Sun, and Glenn Hicks (Institute for Integrative Genome Biology, University of California Riverside) for their assistance in the library preparation and sequencing process; and Serena Cervantes for technical assistance in microscopy and image processing. The following reagents were obtained through the MR4 as part of the BEI Resources Repository, NIAID, NIH: Plasmodium falciparum strain 3D7 (MRA-102) deposited by D.J. Carucci. We thank Stanley Fields and Zhi-jun Duan for feedback on the manuscript. This study was financially supported by a Computing Research Association CIFellows award (NSF award CIF 1136996 to F.A.), the Human Frontier Science Program (grant LT000507/2011-L to E.M.B.), the National Institutes of Health (grants R01 AI85077-01A1 to K.G.L.R. and R01 AI106775-01 to W.S.N. and K.G.L.R.), the European Research Council (grant SMAC-ERC-280032 to J.-P.V.), the European Commission (grant HEALTH-F5-2012-305626 to J.-P.V. and N.V), and the French National Research Agency (grant ANR-11-BINF-0001 to J.-P.V. and N.V.).
Author contributions: W.S.N. and K.G.L.R. conceived the project. E.M.B. and S.M.B. carried out the Hi-C and FISH experiments. J.P. maintained P. falciparum cultures and assisted in experimental procedures. F.A. and N.V. analyzed the data under the supervision of W.S.N. and J.V. F.A., E.M.B., N.V., W.S.N., and K.G.L.R. wrote the manuscript. All authors discussed and edited the manuscript.
Footnotes
[Supplemental material is available for this article.]
Article published online before print. Article, supplemental material, and publication date are at http://www.genome.org/cgi/doi/10.1101/gr.169417.113.
References
- Andrews S. 2010. FastQC: a quality control tool for high throughput sequence data. http://www.bioinformatics.babraham.ac.uk/projects/fastqc.
- Ay F, Bailey TL, Noble WS 2014. Statistical confidence estimation for Hi-C data reveals regulatory chromatin contacts. Genome Res (this issue). doi: 10.1101/gr.160374.113 [DOI] [PMC free article] [PubMed] [Google Scholar]
- Bach FR, Jordan MI 2002. Kernel independent component analysis. J Mach Learn Res 3: 1–48 [Google Scholar]
- Balaji S, Babu MM, Iyer LM, Aravind L 2005. Discovery of the principal specific transcription factors of Apicomplexa and their implication for the evolution of the AP2-integrase DNA binding domains. Nucleic Acids Res 33: 3994–4006 [DOI] [PMC free article] [PubMed] [Google Scholar]
- Bannister LH, Margos G, Hopkins JM 2005. Making a home for Plasmodium post-genomics: ultrastructural organization of the blood stages. In Molecular approaches to malaria, pp. 24–49. ASM Press, Washington, DC [Google Scholar]
- Bau D, Sanyal A, Lajoie BR, Capriotti E, Byron M, Lawrence JB, Dekker J, Marti-Renom MA 2011. The three-dimensional folding of the α-globin gene domain reveals formation of chromatin globules. Nat Struct Mol Biol 18: 107–114 [DOI] [PMC free article] [PubMed] [Google Scholar]
- Berger AB, Cabal GG, Fabre E, Duong T, Buc H, Nehrbass U, Olivo-Marin JC, Gadal O, Zimmer C 2008. High-resolution statistical mapping reveals gene territories in live yeast. Nat Methods 5: 1031–1037 [DOI] [PubMed] [Google Scholar]
- Bunnik EM, Chung DW, Hamilton M, Ponts N, Saraf A, Prudhomme J, Florens L, Le Roch KG 2013. Polysome profiling reveals translational control of gene expression in the human malaria parasite Plasmodium falciparum. Genome Biol 14: R128. [DOI] [PMC free article] [PubMed] [Google Scholar]
- Bystricky K, Heun P, Gehlen L, Langowski J, Gasser SM 2004. Long-range compaction and flexibility of interphase chromatin in budding yeast analyzed by high-resolution imaging techniques. Proc Natl Acad Sci 101: 16495–16500 [DOI] [PMC free article] [PubMed] [Google Scholar]
- Chen Q, Fernandez V, Sundstrom A, Schlichtherle M, Datta S, Hagblom P, Wahlgren M 1998. Developmental selection of var gene expression in Plasmodium falciparum. Nature 394: 392–395 [DOI] [PubMed] [Google Scholar]
- Coulson RM, Hall N, Ouzounis CA 2004. Comparative genomics of transcriptional control in the human malaria parasite Plasmodium falciparum. Genome Res 14: 1548–1554 [DOI] [PMC free article] [PubMed] [Google Scholar]
- Dahan-Pasternak N, Nasereddin A, Kolevzon N, Pe’er M, Wong W, Shinder V, Turnbull L, Whitchurch CB, Elbaum M, Timgilberger W 2013. Pfsec13 is an unusual chromatin-associated nucleoporin of Plasmodium falciparum that is essential for parasite proliferation in human erythrocytes. J Cell Sci 126: 3055–3069 [DOI] [PubMed] [Google Scholar]
- Dixon JR, Selvaraj S, Yue F, Kim A, Li Y, Shen Y, Hu M, Liu JS, Ren B 2012. Topological domains in mammalian genomes identified by analysis of chromatin interactions. Nature 485: 376–380 [DOI] [PMC free article] [PubMed] [Google Scholar]
- Duan Z, Andronescu M, Schutz K, McIlwain S, Kim YJ, Lee C, Shendure J, Fields S, Blau CA, Noble WS 2010. A three-dimensional model of the yeast genome. Nature 465: 363–367 [DOI] [PMC free article] [PubMed] [Google Scholar]
- Duraisingh MT, Voss TS, Marty AJ, Duffy MF, Good RT, Thompson JK, Freitas-Junior LH, Scherf A, Crabb BS, Cowman AF 2005. Heterochromatin silencing and locus repositioning linked to regulation of virulence genes in Plasmodium falciparum. Cell 121: 13–24 [DOI] [PubMed] [Google Scholar]
- Dzikowski R, Li F, Amulic B, Eisberg A, Frank M, Patel S, Wellems TE, Deitsch KW 2007. Mechanisms underlying mutually exclusive expression of virulence genes by malaria parasites. EMBO Rep 8: 959–965 [DOI] [PMC free article] [PubMed] [Google Scholar]
- Flueck C, Bartfai R, Niederwieser I, Witmer K, Alako BT, Moes S, Bozdech Z, Jenoe P, Stunnenberg HG, Voss TS 2010. A major role for the Plasmodium falciparum ApiAP2 protein PfSIP2 in chromosome end biology. PLoS Pathog 6: e1000784. [DOI] [PMC free article] [PubMed] [Google Scholar]
- Freitas-Junior LH, Bottius E, Pirrit LA, Deitsch KW, Scheidig C 2000. Frequent ectopic recombination of virulence factor genes in telomeric chromosome clusters of P. falciparum. Nature 407: 1018–1022 [DOI] [PubMed] [Google Scholar]
- Freitas-Junior LH, Hernandez-Rivas R, Ralph SA, Montiel-Condado D, Ruvalcaba-Salazar OK, Rojas-Meza AP, Mâncio-Silva L, Leal-Silvestre RJ, Gontijo AM, Shorte S, et al. 2005. Telomeric heterochromatin propagation and histone acetylation control mutually exclusive expression of antigenic variation genes in malaria parasites. Cell 121: 25–36 [DOI] [PubMed] [Google Scholar]
- Fudenberg G, Mirny LA 2012. Higher-order chromatin structure: bridging physics and biology. Curr Opin Genet Dev 22: 115–124 [DOI] [PMC free article] [PubMed] [Google Scholar]
- Ganesan K, Ponmee N, Jiang L, Fowble JW, White J, Kamchonwongpaisan S, Yuthavong Y, Wilairat P, Rathod PK 2008. A genetically hard-wired metabolic transcriptome in Plasmodium falciparum fails to mount protective responses to lethal antifolates. PLoS Pathog 4: e10000214. [DOI] [PMC free article] [PubMed] [Google Scholar]
- Grosberg AY, Nechaev SK, Shakhnovich EI 1988. The role of topological constraints in the kinetics of collapse of macromolecules. J Phys France 49: 2095–2100 [Google Scholar]
- Hoeijmakers WA, Flueck C, Francoijs KJ, Smits AH, Wetzel J, Volz JC, Cowman AF, Voss T, Stunnenberg HG, Bártfai R 2012. Plasmodium falciparum centromeres display a unique epigenetic makeup and cluster prior to and during schizogony. Cell Microbiol 14: 1391–1401 [DOI] [PubMed] [Google Scholar]
- Homouz D, Kudlicki A 2013. The 3D organization of the yeast genome correlates with co-expression and reflects functional relations between genes. PLoS ONE 8: e54699. [DOI] [PMC free article] [PubMed] [Google Scholar]
- Imakaev M, Fudenberg G, McCord RP, Naumova N, Goloborodko A, Lajoie BR, Dekker J, Mirny LA 2012. Iterative correction of Hi-C data reveals hallmarks of chromosome organization. Nat Methods 9: 999–1003 [DOI] [PMC free article] [PubMed] [Google Scholar]
- Jiang L, Mu J, Zhang Q, Ni T, Srinivasan P, Rayavara K, Yang W, Turner L, Lavstsen T, Theander TG 2013. PfSETvs methylation of histone H3K36 represses virulence genes in Plasmodium falciparum. Nature 499: 223–227 [DOI] [PMC free article] [PubMed] [Google Scholar]
- Kalhor R, Tjong H, Jayathilaka N, Alber F, Chen L 2011. Genome architectures revealed by tethered chromosome conformation capture and population-based modeling. Nat Biotechnol 30: 90–98 [DOI] [PMC free article] [PubMed] [Google Scholar]
- Lambros C, Vanderberg JP 1979. Synchronization of Plasmodium falciparum, erythrocytic stages in culture. J Parasitol 65: 418–420 [PubMed] [Google Scholar]
- Lemieux JE, Kyes SA, Otto TD, Feller AI, Eastman RT, Pinches RA, Berriman M, Su XZ, Newbold CI 2013. Genome-wide profiling of chromosome interactions in Plasmodium falciparum characterizes nuclear architecture and reconfigurations associated with antigenic variation. Mol Microbiol 90: 519–537 [DOI] [PMC free article] [PubMed] [Google Scholar]
- Le Roch KG, Zhou Y, Blair PL, Grainger M, Moch JK, Haynes JD, de la Vega P, Holder AA, Batalov S, Carucci DJ, et al. 2003. Discovery of gene function by expression profiling of the malaria parasite life cycle. Science 301: 1503–1508 [DOI] [PubMed] [Google Scholar]
- Le Roch KG, Johnson JR, Ahiboh H, Chung DW, Prudhomme J, Plouffe D, Henson K, Zhou Y, Witola W, Yates JR, et al. 2008. A systematic approach to understand the mechanism of action of the bisthiazolium compound T4 on the human malaria parasite, Plasmodium falciparum. BMC Genomics 9: 513. [DOI] [PMC free article] [PubMed] [Google Scholar]
- Li H, Durbin R 2010. Fast and accurate long-read alignment with Burrows–Wheeler transform. Bioinformatics 26: 589–595 [DOI] [PMC free article] [PubMed] [Google Scholar]
- Lieberman-Aiden E, van Berkum NL, Williams L, Imakaev M, Ragoczy T, Telling A, Amit I, Lajoie BR, Sabo PJ, Dorschner MO, et al. 2009. Comprehensive mapping of long-range interactions reveals folding principles of the human genome. Science 326: 289–293 [DOI] [PMC free article] [PubMed] [Google Scholar]
- Lopez-Barragan MJ, Lemieux J, Quinones M, Williamson KC, Molina-Cruz A, Cui K, Barillas-Mury C, Zhao K, Su XZ 2011. Directional gene expression and antisense transcripts in sexual and asexual stages of Plasmodium falciparum. BMC Genomics 12: 587. [DOI] [PMC free article] [PubMed] [Google Scholar]
- Lopez-Rubio JJ, Mancio-Silva L, Scherf A 2009. Genome-wide analysis of heterochromatin associates clonally variant gene regulation with perinuclear repressive centers in malaria parasites. Cell 5: 179–190 [DOI] [PubMed] [Google Scholar]
- Mancio-Silva L, Zhang Q, Scheidig-Benatar C, Scherf A 2010. Clustering of dispersed ribosomal DNA and its role in gene regulation and chromosome-end associations in malaria parasites. Proc Natl Acad Sci 107: 15117–15122 [DOI] [PMC free article] [PubMed] [Google Scholar]
- Nagano T, Lubling Y, Stevens TJ, Schoenfelder S, Yaffe E, Dean W, Laue ED, Tanay A, Fraser P 2013. Single-cell Hi-C reveals cell-to-cell variability in chromosome structure. Nature 502: 59–64 [DOI] [PMC free article] [PubMed] [Google Scholar]
- Nora EP, Lajoie BR, Schulz EG, Giorgetti L, Okamoto I, Servant N, Piolot T, van Berkum NL, Meisig J, Sedat J, et al. 2012. Spatial partitioning of the regulatory landscape of the X-inactivation centre. Nature 485: 381–385 [DOI] [PMC free article] [PubMed] [Google Scholar]
- Otto TD, Wilinski D, Assefa S, Keene TM, Sarry LR, Böhme U, Lemieux J, Barrell B, Pain A, Berriman M, et al. 2010. New insights into the blood-stage transcriptome of Plasmodium falciparum using RNA-seq. Mol Microbiol 76: 12–24 [DOI] [PMC free article] [PubMed] [Google Scholar]
- Ponts N, Harris EY, Prudhomme J, Wick I, Eckhardt-Ludka C, Hicks GR, Hardiman G, Lonardi S, Le Roch KG 2010. Nucleosome landscape and control of transcription in the human malaria parasite. Genome Res 20: 228–238 [DOI] [PMC free article] [PubMed] [Google Scholar]
- Schölkopf B, Smola A 2002. Learning with kernels. MIT Press, Cambridge, MA [Google Scholar]
- Subramanian A, Tamayo P, Mootha VK, Mukherjee S, Ebert BL, Gillette MA, Paulovich A, Pomeroy SL, Golub TR, Lander ES, et al. 2005. Gene set enrichment analysis: a knowledge-based approach for interpreting genome-wide expression profiles. Proc Natl Acad Sci 102: 15545–15550 [DOI] [PMC free article] [PubMed] [Google Scholar]
- Tanizawa H, Iwasaki O, Tanaka A, Capizzi JR, Wickramasignhe P, Lee M, Fu Z, Noma K 2010. Mapping of long-range associations throughout the fission yeast genome reveals global genome organization linked to transcriptional regulation. Nucleic Acids Res 38: 8164–8177 [DOI] [PMC free article] [PubMed] [Google Scholar]
- Tjong H, Gong K, Chen L, Alber F 2012. Physical tethering and volume exclusion determine higher-order genome organization in budding yeast. Genome Res 22: 1295–1305 [DOI] [PMC free article] [PubMed] [Google Scholar]
- Trager W, Jensen JB 1976. Human malaria parasites in continuous culture. Science 193: 673–675 [DOI] [PubMed] [Google Scholar]
- Ukaegbu U, Kishore SP, Kwiatkowski DL, Pandarinath C, Dahan-Pasternak N, Dzikowski R, Deitsch KW 2014. Recruitment of PfSET2 by RNA Polymerase II to variant antigen encoding loci contributes to antigenic variation in P.falciparum. PLoS Pathog 10: e1003854. [DOI] [PMC free article] [PubMed] [Google Scholar]
- Umbarger MA, Toro E, Wright MA, Porreca GJ, Bau D, Hong S, Fero MJ, Zhu LJ, Marti-Renom MA, McAdams HH, et al. 2011. The three-dimensional architecture of a bacterial genome and its alteration by genetic perturbation. Mol Cell 44: 252–264 [DOI] [PMC free article] [PubMed] [Google Scholar]
- Vert JP, Kanehisa M 2003a. Extracting active pathways from gene expression data. Bioinformatics 19: ii238–ii244 [DOI] [PubMed] [Google Scholar]
- Vert JP, Kanehisa M 2003b. Graph-driven features extraction from microarray data using diffusion kernels and kernel CCA. In Advances in neural information processing systems 15, pp. 1425–1432. MIT Press, Cambridge, MA [Google Scholar]
- Vettorel T, Grosberg AY, Kremer K 2009. Statistics of polymer rings in the melt: a numerical simulation study. Phys Biol 6: 025013. [DOI] [PubMed] [Google Scholar]
- Weiner A, Dahan-Pasternak N, Shimoni E, Shinder V, von Huth P, Elbaum M, Dzikowski R 2011. 3D nuclear architecture reveals coupled cell cycle dynamics of chromatin and nuclear pores in the malaria parasite Plasmodium falciparum. Cell Microbiol 13: 967–977 [DOI] [PubMed] [Google Scholar]
- World Health Organization. 2012. World malaria report: 2012. World Health Organization, Geneva