

Abstract
The critical barrier in interaction analysis for rare variants is that most traditional statistical methods for testing interactions were originally designed for testing the interaction between common variants and are difficult to apply to rare variants because of their prohibitive computational time and poor ability. The great challenges for successful detection of interactions with next-generation sequencing (NGS) data are (1) lack of methods for interaction analysis with rare variants, (2) severe multiple testing, and (3) time-consuming computations. To meet these challenges, we shift the paradigm of interaction analysis between two loci to interaction analysis between two sets of loci or genomic regions and collectively test interactions between all possible pairs of SNPs within two genomic regions. In other words, we take a genome region as a basic unit of interaction analysis and use high-dimensional data reduction and functional data analysis techniques to develop a novel functional regression model to collectively test interactions between all possible pairs of single nucleotide polymorphisms (SNPs) within two genome regions. By intensive simulations, we demonstrate that the functional regression models for interaction analysis of the quantitative trait have the correct type 1 error rates and a much better ability to detect interactions than the current pairwise interaction analysis. The proposed method was applied to exome sequence data from the NHLBI’s Exome Sequencing Project (ESP) and CHARGE-S study. We discovered 27 pairs of genes showing significant interactions after applying the Bonferroni correction (P-values < 4.58 × 10⁻¹⁰) in the ESP, and 11 were replicated in the CHARGE-S study.
Epistasis is the primary factor in molecular evolution (Breen et al. 2012) and plays an important role in quantitative genetic analysis (Steen 2011). Epistasis is a phenomenon in which the effect of one genetic variant is masked or modified by one or more genetic variants and is often defined as the departure from additive effects in a linear model (Fisher 1918). Many statistical methods, including regression-based methods, have been developed to detect epistasis in quantitative genetic analysis (Cordell 2009; Chen and Cui 2010; Bocianowski 2012). However, these methods were originally designed to detect epistasis for common variants (Steen 2011) and are difficult to apply to rare variants because of their high type 1 error rates and poor ability to detect interactions between rare variants. Next-generation sequencing (NGS) data raise two serious problems. The first problem is the curse of dimensionality of the data, and the second problem comes from the low frequencies of rare variants in the data.
The recently reported average number of single nucleotide polymorphisms (SNPs) per kb in the 202 drug target genes sequenced in 12,514 European subjects is about 48 SNPs (Nelson et al. 2012). The total number of all possible pairs of SNPs across the genome for large sample sizes can reach as many as 1016. The dimension of whole-genome sequencing is extremely high. The high dimension of the data for interaction analysis poses two great challenges. The first challenge is the requirement of a prohibitive amount of computational time. Suppose that 5000 pairwise tests can be finished in 1 sec (Steen 2011), then a possible pairwise interaction test would take ∼65,956 yr to finish. The second challenge for genome-wide interaction analysis arises from the multiple statistical tests. The power of the statistics that exhaustively test all possible pairs of interaction will be severely hampered by extremely large numbers of multiple tests.
The popular strategies for reducing the dimensionality of the data, the number of tests, and the time of computations, and for improving the power to detect interactions are feature extraction, which projects the original high-dimensional data to low-dimensional space (Guyon et al. 2006; Li et al. 2009); feature selection, which selects subsets of variables of interests (Guyon and Elisseeff 2003; Saeys et al. 2007); and possibly, approximately complete testing to reduce computational time (Prabhu and Pe’er 2012).
Feature extraction in association studies with NGS data is often carried out by collapsing multiple variants into a single variable (Li and Leal 2008; Bansal et al. 2010; Luo et al. 2011; Wu et al. 2011). However, much important interaction information may be lost after the multiple variants are collapsed. The collapsing methods may lack the power to detect interactions between variants.
To address the critical barrier in detection of gene–gene interactions with NGS data, we take a genome region (or gene) as a basic unit of interaction analysis and use all the information that can be accessed to collectively test interactions between all possible pairs of SNPs within two genome regions (or genes). This will shift the paradigm of interaction studies from pairwise interaction analysis to region–region (gene–gene) interaction analysis, in which we collectively test interactions between two sets of loci within genomic regions or genes. To effectively reduce the dimension of the data, unlike the recently proposed group association tests (Li and Leal 2008; Madsen and Browning 2009), which ignore differences in genetic effects between SNPs in different locations, we use genetic variant profiles that will recognize information contained in the physical location of the SNP as a major data form. The densely distributed genetic variants across the genomes in large samples can be viewed as realizations of a Poisson process (Joyce and Tavaré 1995). The densely typed genetic variants in a genomic region for each individual are so close that these genetic variant profiles can be treated as observed data taken from curves (Luo et al. 2012). The genetic variant profiles are called functional. Since standard multivariate statistical analyses often fail with functional data (Ferraty and Romain 2010), we formulate a test for the interaction between two genomic regions in quantitative trait analysis as a functional regression (FRG) model (Ramsay and Silverman 2005) with scalar response. In the FRG model, the genotype functions (genetic variant profiles) are defined as a function of the genomic position of the genetic variants rather than a set of discrete genotype values, and the quantitative trait is predicted by genotype functions with their interaction terms. We will show that the FRG with scale response is a natural extension of the multivariate regression for interaction analysis.
To evaluate its performance for interaction analysis, we use large-scale simulations to calculate the type I error rates of the FRG for testing the interaction between two genomic regions and to compare its power with pairwise interaction analysis and regression on principal components (PCs). To further evaluate its performance, the FRG for interaction analysis is applied to high-density lipoprotein (HDL) and exome sequence data from the NHLBI’s Exome Sequencing Project (ESP) and to whole-genome sequencing data from the CHARGE-S project.
Methods
Functional regression model for interaction analysis with a quantitative trait
Consider the two genomic regions  and
and  . Let
. Let  be the phenotypic value of a quantitative trait measured on the ith individual. Let
  and
and  be a genomic position in the first and second genomic regions, respectively. Let
  and
and  be genotype functions of the ith individual in the regions
  and
and  , respectively. The genotype function
  of the ith individual is defined as
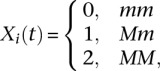 |
where M and m are two alleles of the SNP at the genomic position t. Recall that a regression model for interaction analysis is defined as
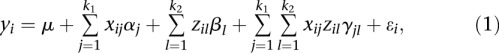 |
where  is an overall mean;
  is the main genetic additive effect of the jth SNP in the first genomic region;
  is the main genetic additive effect of the lth SNP in the second genomic region;
  is an additive × additive interaction effect between the jth SNP in the first genomic region and the jth SNP in the second genomic region;
  are indicator variables for the genotypes at the jth SNP and the lth SNP, respectively; and
  are independent and identically distributed normal variables with mean of zero and variance
  . Similar to the multiple regression models for interaction analysis with a quantitative trait, the FRG model for a quantitative trait can be defined as
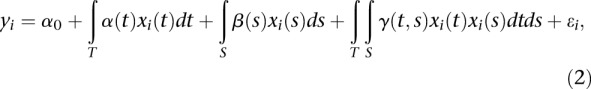 |
where  is an overall mean;
  are genetic additive effects of two putative QTLs located at the genomic positions
  and
and  , respectively;
  is the interaction effect between two putative QTLs located at the genomic positions
  and
and  ;
;  and
and  are genotype function; and
  are independent and identically distributed normal variables with mean of zero and variance
  .
.
In theory, the genetic additive effect and interaction effect functions can be obtained by variation of theory (Supplemental Note 1). The classical concept of genetic additive variance and interaction variance can be extended to the functional model (Supplemental Note 2). Below we take a numerical approach to estimate the genetic additive and interaction effect functions.
Estimation of interaction effects
We assume that both phenotypes and genotype functions are centered. The genotype functions  and
and  are expanded in terms of the orthonormal basis functions as
 |
where  and
and  are sequences of the orthonormal basis functions. The expansion coefficients
  and
and  are estimated by
 |
In practice, numerical methods for the integral will be used to calculate the expansion coefficients. Substituting Equation 3 into Equation 2, we obtain
 |
where  ,
,  and
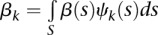
and  . The parameters αj, βk, and γjk are referred to as genetic additive and as additive × additive interaction effect scores. These scores can also be viewed as the expansion coefficients of the genetic effect functions with respect to orthonormal basis functions:
 |
Let  ,
,
 |
where the values J and K are chosen such that genotype function expansions can account for 80% of total genetic variation in the first and second genes, respectively.
If we use the above notations, Equation 5 can be reduced to
where  and
and  .
.
Therefore, the interaction models with integrals are transformed to the traditional multivariate regression models (Equation 7) for interaction analysis. The standard least square estimator of b is given by
and its variance is
where
Substituting the estimated genetic effect scores 
 , and
, and  into Equation 6 yields the estimated genetic additive effect and additive × additive interaction effect functions
 , and
, and  . If basis functions for expansion of genotype functions are functional PCs or eigenfunctions (Ash and Gardner 1975), then we can estimate the genetic additive and additive × additive interaction variances in Equation 2 (Supplemental Note 3).
Test statistics
An essential problem in genetic interaction studies of the quantitative trait is to test the interaction between two genomic regions (or genes). Formally, we investigate the problem of testing the following hypothesis:
which is equivalent to testing the hypothesis
where  is defined in Equation 7.
Let  be the matrix corresponding to the parameter
  of the variance matrix Var (
 in Equation 9. Define the test statistic for testing the interaction between the two genomic regions
  and
and  as
as
Then, under the null hypothesis  ,
,  is asymptotically distributed as a central
  distribution if
  components are taken in the expansion Equation 6.
Results
Null distribution of test statistics
In the previous section, we showed that the test statistics  are asymptotically distributed as a central
  distribution. To examine the validity of this statement, we performed a series of simulation studies to compare their empirical levels with the nominal ones.
The type I error rates for rare variants and both common and rare variants were calculated. We assumed the three models: model 1 (without marginal effects), model 2 (with marginal effect of one gene), and model 3 (with marginal effects of two genes to generate a phenotype) (Supplemental Note 4).
We generated a population with 1 million individuals by resampling from 3212 individuals with variants in eight genes selected from the NHLBI’s ESP, where the description of eight genes is summarized in Supplemental Table S1. To examine whether presence of the linkage disequilibrium (LD) between SNPs will seriously affect the type 1 error rates, we included some genes with linked variants. The number of sampled individuals range from 500 to 5000, and 5000 simulations were repeated. Table 1 and Supplemental Table S2 summarize the average type I error rates of the test statistics for testing the interaction between two genes with rare variants and mixed common and rare variants over all possible pairs of eight genes (28 pairs of genes), respectively, at the nominal levels α = 0.05, α = 0.01, and α = 0.001. These tables show that the type I error rates of the test statistics for testing interactions between two genes with or without marginal effects are not appreciably different from the nominal α levels.
Table 1.
Average type 1 error rates of the statistics for testing interaction between two genes with rare variants
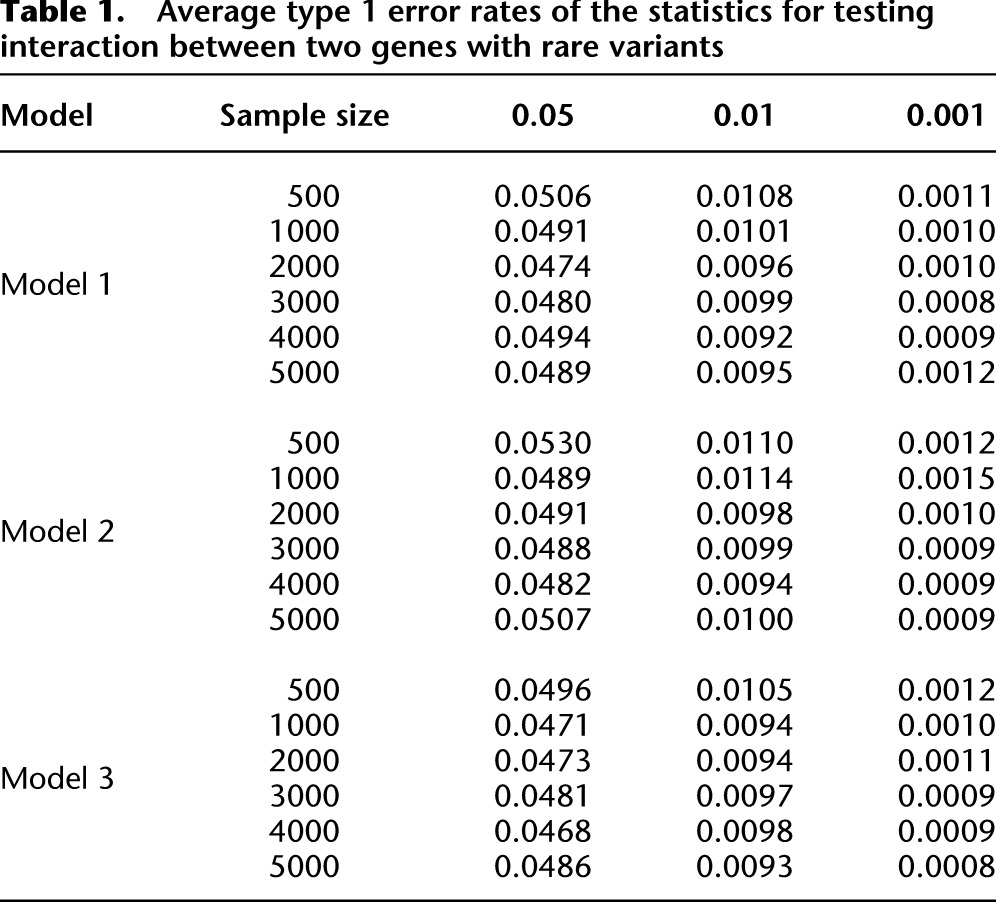
To study the impact of the LD between SNPs, we present Supplemental Table S3. Supplemental Table S3 summarizes the type 1 error rates of the FRG for testing interactions between genes: GBP3 and KANK4. The LD map of genes GBP3 and KANK4 is shown in Supplemental Figure 1. Supplemental Table S2 demonstrates that the presence of LD between genes being tested did not have a significant impact on the type 1 error rates. The impact of the lengths of the genes and sequencing error (on the type 1 error rates) will be limited (Supplemental Note 3).
Power evaluation
To evaluate the performance of the FRG for testing the interaction between two genes or genomic regions for a quantitative trait, simulated data were used to estimate their power to detect a true interaction. A true quantitative genetic model is given as follows. Consider  pairs of quantitative trait loci (QTLs) from two genes (genomic regions). Let
  and
and  be two alleles at the first QTL, and
  and
and  be two alleles at the second QTL, for the
  pair of QTLs. Let
  be the genotypes of the uth individual with
  and
and  , and
, and  be its genotypic value. The following multiple linear regression is used as a genetic model for a quantitative trait:
where  is a genotypic value of the hth pair of QTLs, and
  is distributed as a standard normal distribution
  .
.
Four models of interactions are considered: (1) Dominant OR Dominant, (2) Dominant AND Dominant, (3) Recessive OR Recessive, and (4) Threshold model (Supplemental Table S4). The Recessive AND Recessive model is excluded due to infrequency of that condition with rare variants. The parameter  varies from zero to one.
We generated 1 million individuals by resampling from 3212 individuals of European origin with variants in the two genes IQGAP3 and ACTN2 selected from the ESP data set. We randomly selected 20% of the variants as causal variants. A total of 2000 individuals for the four interaction models were sampled from the populations. A total of 1000 simulations were repeated for the power calculation.
The power of the proposed method is compared with the regression on PCs. For SNP genotypes in each genomic region, PC analysis (PCA) was performed. The number of PCs for each individual that can explain 80% of the total genetic variation in the genomic region will be selected as the variable. Specifically, the PC score of the ith individual in the first and second genomic regions is denoted by  and
and  , respectively. The regression model for detection of interaction is then given by
 |
The power of the proposed method is compared with the traditional point-wise interaction test, which takes the following model:
For a pair of genes, we assume that the first gene has  SNPs and the second gene has
  SNPs, and then the total number of all possible pairs is
  . For each pair of SNPs, we calculate a statistic for testing pairwise interaction
  . Finally, the maximum of
  :
:  is computed.
By permutation of 1000 times of the phenotypic values  , we can find the distribution of
  ; i.e., we have 1000 values of
  . From this empirical distribution, we can find the P-value of
  , which can be used to calculate the power of testing for interaction between two genes (genomic regions) by pairwise tests.
We first study the power of statistics for testing interactions between two genomic regions with all rare variants where 20% of the rare variants were chosen as causal variants. Figure 1, A through D, plots the power curves of three statistics: FRG, regression on PCs, and pairwise interaction tests. Permutations were used to adjust for multiple testing, that is, for testing interactions between two genomic regions (genes) that consist of only rare variants for a quantitative trait under Dominant OR Dominant, Dominant AND Dominant, Recessive OR Recessive, and Threshold models, respectively. These power curves are a function of the risk parameter at the significance level  . From these figures we observed several remarkable features. First, under all four interaction models, the test based on the FRG model was the most effective, followed by the regression on PCA. The pairwise tests where we tested the interaction between all possible pairs of SNPs in two genomic regions (genes) was the least effective. Second, the pairwise test almost had no power to detect interaction between two genomic regions (genes). Third, the effectiveness of the FRG-based test was substantially better than that of the pairwise tests. Fourth, the difference in power between the FRG and regression on PCA increases when the complexity of the interaction models increases.
Figure 1.

(A) Power curves of three statistics: the FRG, the regression on PCA, and pairwise interaction tests. Permutations were used to adjust for multiple testing, that is, for testing the interaction between two genomic regions that consist of rare variants, for a quantitative trait as a function of the relative risk parameter r at the significance level α = 0.05, under the Dominant OR Dominant model, assuming sample sizes of 2000. (B) Power curves of three statistics: the FRG, the regression on PCA, and pairwise interaction tests. Permutations were used to adjust for multiple testing, that is, for testing the interaction between two genomic regions that consist of rare variants, for a quantitative trait as a function of the relative risk parameter r at the significance level α = 0.05, under the Dominant AND Dominant model, assuming sample sizes of 2000. (C) Power curves of three statistics: the FRG, the regression on PCA, and pairwise interaction tests. Permutations were used to adjust for multiple testing, that is, for testing the interaction between two genomic regions that consist of rare variants, for a quantitative trait as a function of the relative risk parameter r at the significance level α = 0.05, under the Recessive OR Recessive model, assuming sample sizes of 2000. (D) Power curves of three statistics: the FRG, the regression on PCA, and pairwise interaction tests. Permutations were used to adjust for multiple testing, that is, for testing the interaction between two genomic regions that consist of rare variants, for a quantitative trait as a function of the relative risk parameter r at the significance level α = 0.05, under the Threshold model, assuming sample sizes of 2000. (E) Power curves of three statistics: the FRG, the regression on PCA, and pairwise interaction tests. Permutations were used to adjust for multiple testing, that is, for testing the interaction between two genomic regions that consist of rare variants, for a quantitative trait as a function of the sample size at the significance level α = 0.05, under the Dominant OR Dominant model, assuming the relative risk parameter r = 0.1. (F) Power curves of three statistics: the FRG, the regression on PCA, and pairwise interaction tests. Permutations were used to adjust for multiple testing, that is, for testing the interaction between two genomic regions with both common and rare variants, where 10% of the common variants and 10% of the rare variants were chosen as causal variants, as a function of the relative risk parameter r at the significance level α = 0.05, under the Dominant OR Dominant model, assuming sample sizes of 2000.
To investigate the impact of sample size on the power, we plotted Figure 1E and Supplemental Figures 2 through 4, showing the power of three statistics for testing the interaction between two genomic regions (or genes) with only rare variants as a function of sample sizes under four interaction models, assuming 20% of the risk rare variants and the risk parameter  for Dominant OR Dominant and Recessive OR Recessive, and
  for the Dominant AND Dominant and Threshold models, respectively. We observed similar power patterns of the three statistics under the four interaction models as those previously discussed. When sample sizes reach 10,000, the FRG model can be highly effective, but the effectiveness of the pairwise interaction test was still low even if the sample sizes increased to 10,000.
The FRG can also be applied to the presence of both common and rare variants. Figure 1F plotted the power curves of three statistics for testing interactions between two genomic regions (or genes) with both common and rare variants where 10% of the common variants and 10% of the rare variants were chosen as causal variants under the Dominant OR Dominant interaction model. Again, the FRG was the most effective among the three statistics. The power patterns of the tests for the interactions under the other three interaction models were similar. To limit the length of this publication, the investigation of the power of the tests in other scenarios is presented in Supplemental Note 5.
Application to real data examples
To further evaluate its performance, the FRG for testing interaction was applied to data from the NHLBI’s ESP Project. The trait we considered was HDL. A total of 2225 individuals of European origin from 15 different cohorts in the ESP Project with no missing HDL phenotype value were included in the analysis. No evidence of cohort- and/or phenotype-specific effects or of other systematic biases was found (Tennessen et al. 2012). Exomes from related individuals were excluded from further analysis. The logarithm of HDL was taken as a trait value. The total number of genes tested for interactions, which included both common and rare variants, was 18,498. The remaining annotated human genes that did not contain any SNPs in our data set were excluded from the analysis. A P-value for declaring significant interactions after applying the Bonferroni correction for multiple tests was 4.75 × 10⁻¹⁰. To examine the behavior of the FRG, we plotted QQ plots of the test (Fig. 2). The QQ plots showed that the false-positive rate of the FRG for detection of interaction in some degree is controlled.
Figure 2.

(A) QQ plot for the ESP data set. (B) QQ plot for the CHARGE-S data set.
In total, 27 pairs of genes showed significant evidence of interaction with P-values < 4.58 × 10⁻¹⁰, which were calculated using the FRG model and logarithm transformation of the HDL. The results are summarized in Table 4 (below), where P-values for testing interactions between genes by regression on PCA and the minimum of P-values for testing all possible pairs of SNPs between two genes using a standard regression model are also listed. Since some complex traits in genetic studies often have non-normal distribution, we also used the rank-based inverse normal transformation (INT) to transform HDL (Beasley et al. 2009). The P-values for using INT of HDL with  are included in Table 2. These 27 pairs of genes were derived from 35 genes. An additional 130 pairs of genes with P-values < 9.87 × 10⁻⁹ are listed in Supplemental Table 5.
Table 4.
P-values of 11 pairs of genes that were significantly interacted in the ESP and CHARGE-S studies
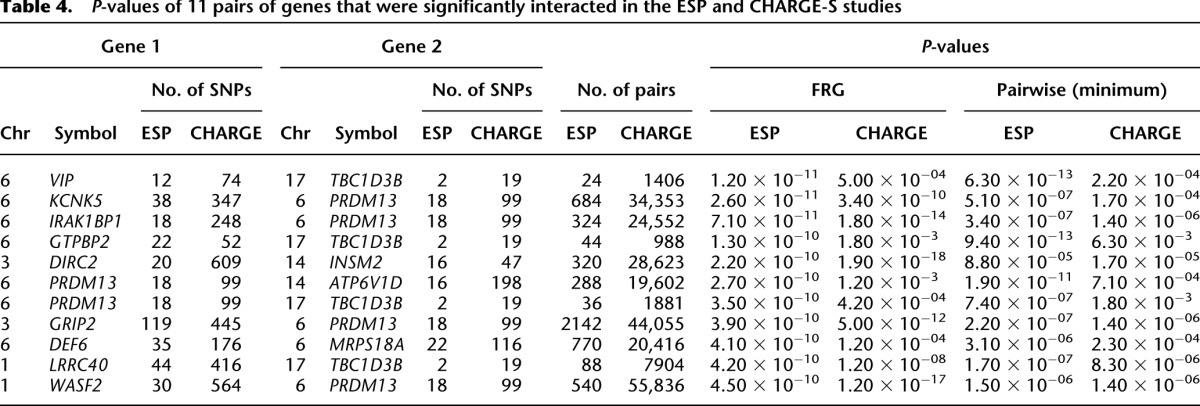
Table 2.
P-values of 27 pairs of significantly interacted genes identified by FRG
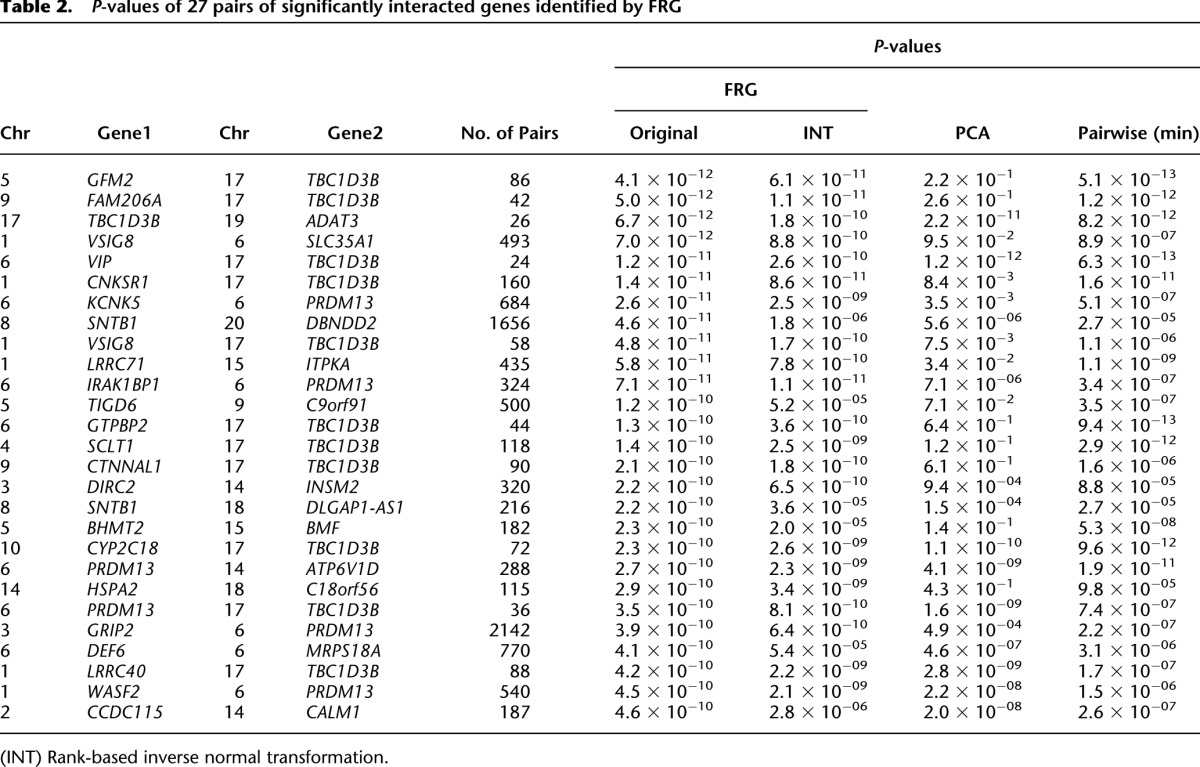
Several remarkable features from these results were observed. First, we frequently observed the pairwise interaction between rare and rare variants (65.56%), and rare and common variants (34.44%). Less observed was the significant pairwise interaction between common and common variants with P-values for testing interactions <1.0 × 10⁻⁶ in Table 2 and Supplemental Table 5, where variants with MAF < 0.05 are defined as rare variants, and variants with MAF ≥ 0.05 are defined as common variants. Second, pairs of SNPs between two genes jointly have significant interaction effects, but individually, each pair of SNPs makes mild contributions to the interaction effects, as shown in Table 3 and Supplemental Table 6. There were a total of 684 pairs of SNPs between genes KCNK5 and PRDM13. Table 3 lists 35 pairs of SNPs with P-values < 0.0497. None of the 35 pairs of SNPs showed strong evidence of interaction. However, a number of pairs of SNPs between the genes KCNK5 and PRDM13 collectively demonstrated significant interaction. We observed similar interaction patterns in Supplemental Table 6, where eight pairs of SNPs between the genes BHMT2 and BMF with P-values < 0.045 are listed. Third, the FRG often had a much smaller P-value to detect interaction than regression on the PCA and the minimum of P-values of pairwise tests had. Fourth, some investigators suggest that in genome-wide interaction analysis, only genes with large or mildly marginal genetic effects should be tested for interaction. However, we observed that genes may not show even mild marginal association, but they did demonstrate significant evidence of interaction (data were not shown). Fifth, computational time for gene-based interaction analysis is much less than that for pairwise tests. In Table 2, we tested a total of 27 pairs of genes and 9696 pairs of SNPs within them. The computational times for the FRG method for testing 27 pairs of gene interactions and by pairwise test for testing 9696 pairs of SNP interactions were 2.18 sec and 91.91 sec, respectively. The computer configuration is as follows: CPU, Intel Core i7-3770 CPU at 3.4 GHz; memory (RAM), 16 GB. The interaction analysis by FRG on the entire set of genes was carried out on the cluster with 10 nodes, with each node having 24 cores (Intel Xeon CPU X5690 at 3.47 GHz). The running time for FRG on the entire set of genes was 18.3 h. Sixth, although interacting genes did not form large connected networks, we did observe some small interacted networks (Fig. 3). We observed three hub genes: TBC1D3B, SNTB1, and PRDM13. TBC1D3B had significant interactions with 12 genes (P-values < 4.20 × 10⁻¹⁰) and interactions with 14 genes (P-values range from 9.10 × 10⁻⁹ to 5.10 × 10⁻¹⁰). SNTB1 strongly interacted with two genes and had modest interactions with another 26 genes (P-values varying from 9.19 × 10⁻⁹ to 9.10 × 10⁻¹⁰). PRDM13 strongly interacted with five genes (P-values < 4.58 × 10⁻¹⁰) and had modest interactions with another 10 genes (P-values varying from 9.83 × 10⁻⁹ to 1.55 × 10⁻⁹) (Table 2; Supplemental Table 5). SNTB1 is a peripheral membrane protein. It is reported that SNTB1 plays an essential role in regulating vascular tone and blood pressure (Lyssand et al. 2008). The multiple copies of TBC1D3B are located within a cluster of chemokine genes and might be a hominoid oncoprotein (Hodzic et al. 2006). We also observed modest interactions between SNTB1 and LDLR (P-value < 4.76 × 10⁻⁷) and between SNTB1 and LIPC (P-value < 7.85 × 10⁻⁶). LDLR and LIPC were reported to influence lipid levels in genome-wide association studies (GWAS) (Aulchenko et al. 2009). PRDM13 is involved in transcriptional regulation (Chang et al. 2013). Point mutation in its strongly interacted gene KCNK5 causes early-onset of autosomal dominant hypertension (Charmandari et al. 2012). Two interacted subnetworks with PRDM13 and TBC1D3B as hub genes were connected via directed interaction between two hub genes or via their interactions with WASF2 and EFNA3 (Fig. 3). EFNA3 is a key regulator of embryogenesis and is expressed in human atherosclerotic plaque (Sakamoto et al. 2011). It was reported that EFNA3 was a potential target of microRNA 210 as a novel therapy for treatment of ischemic heart disease (Hu et al. 2010).
Table 3.
P-values of 35 pairs of SNPs between genes KCNK5 and PRDM13 for testing interaction
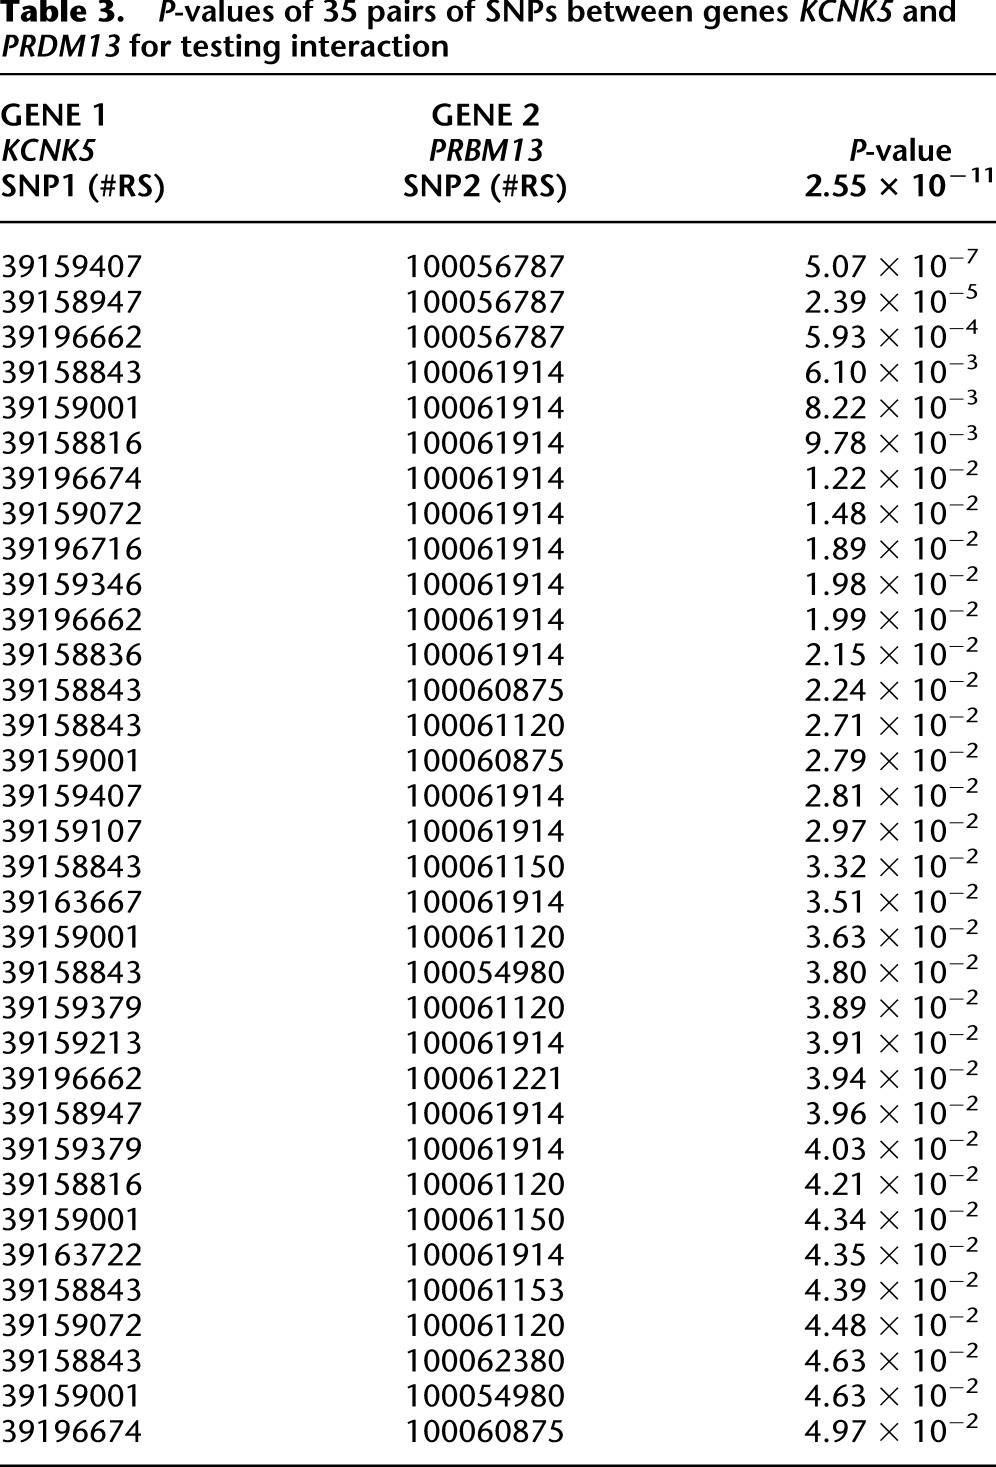
Figure 3.

Networks of 27 pairs of genes showing significant evidence of interactions and genes showing mild interactions in Supplemental Table S5.
To further evaluate the performance of the FRG for interaction analysis, we investigated whether 27 pairs of interacted genes (Table 2) in the ESP can be replicated in the CHARGE-S studies, which generated low-coverage, whole-genome sequencing data of 955 individuals from the ARIC (Atherosclerosis Risk in Communities), Framingham, and CHS (Cardiovascular Health Study) longitudinal cohorts after quality control with rich phenotypes including HDL cholesterol levels. A total of 25 pairs of genes in Table 2 in CHARGE-S were sequenced (SNTB1 was not sequenced in CHARGE-S). Since we carried out 25 tests, the P-value for declaring replication after the Bonferroni correction for multiple tests was 0.002. We observed that 11 of the 25 pairs of significantly interacted genes (involving 14 genes) in the ESP project were replicated in the CHARGE-S study (Table 4). To further evaluate the performance of the FRG, we also considered a scenario where INT transformation of the HDL was taken as a trait value. The P-values for testing interactions between 10 pairs of genes selected from Table 2 using INT transformation of the HDL as a trait are included in Supplemental Note 6 (Supplemental Table S10). It is interesting to note that a subnetwork including six interactions with hub gene PRDM13 and four interactions with hub gene TBC1D3B (Fig. 4) were replicated in the CHARGE-S study. This again showed that PRDM13 and TBC1D3B may make a large contribution to HDL-level variation.
Figure 4.

Nine interactions (pink color) between genes (green color) which form a subnetwork were replicated in the NHLBI’s ESP and CHARGE-S studies.
Discussion
The current paradigm of pairwise interaction analysis was originally designed for testing the interaction for common variants and cannot be applied to genome-wide interaction analysis with rare variants due to its poor ability to detect interaction between rare variants, and rare and common variants, its prohibitive computational time, and the extremely large number of tests being conducted. To address these central themes and critical barriers in interaction analysis, we shift the paradigm of interaction analysis from the pairwise test to the collective group test, where we take a genome region (or gene) as a basic unit of interaction analysis and collectively test the interaction between all possible pairs of SNPs within two genome regions (or genes) and use FRG to develop a novel statistical framework for testing the interaction between two genomic regions (or genes). Using large simulations and real data analysis, we demonstrate the merits and limitations of the proposed new paradigm of interaction analysis.
The new approach uses all genetic information in the genome region to collectively test interaction between multiple SNPs within the regions. In the FRG approach to interaction analysis, we first expand the genotype function in a genomic region (gene) in terms of orthonormal basis functions. Genetic information across all variants in the genomic region, including all single variant variation and their linkage disequilibrium, is compressed into expansion coefficients. We use the compressed genetic information to globally test interaction between two genomic regions (genes). Therefore, the FRG for interaction analysis overcomes limitations inherent in pairwise interaction tests. By large simulations and real data analysis, we showed that the proposed FRG substantially increased the power and dramatically reduced the computational burden. In real data analysis, we also clearly demonstrate that pairs of SNPs between two genes jointly have significant interaction effects, but individually each pair of SNPs makes a mild contribution to interaction effects.
The pairwise interaction analysis is designed to test interactions between common and common variants, and is difficult to use to test interactions between rare and rare variants, and rare and common variants. There is an increasing need to develop statistics that can be used to test interactions among the entire allelic spectrum of variants. The FRG can efficiently test the interaction between rare and rare, rare and common, and common and common variants.
The essential problems in performing genome-wide interaction analysis in practice are the power of the test statistics, feasibility of computations, and efficient methods for P-value correction of multiple tests. Due to the lack of power of the widely used pairwise tests for interaction and its computational intensity, exploration of genome-wide gene–gene interactions has been limited (Ay 2002; Costanzo et al. 2010). Many geneticists question the universal presence of significant gene–gene interactions. Very few genome-wide interaction analyses with NGS data and very few results of significant interactions between rare and rare variants, and rare and common variants, have been reported. To our knowledge, we are among the first to conduct genome-wide interaction analysis with exome sequencing data. From genome-wide interaction analysis of HDL using the NHLBI’s Exome Sequencing data, we have several important observations.
We observed that the majority of the significantly interacting genes showed no marginal association. Surprisingly, in 157 top pairs of interacting genes, the P-values for testing the marginal association of genes by the functional linear model ranged from 0.9933 to 0.00017. This strongly suggested that testing interactions for only genes with strong or mild marginal association will miss the majority of the interactions.
An interesting question to ask is what types of variants–rare or common–are more often present in the interaction. Our limited results showed that large proportions of interactions were due to interaction between rare and rare variants, and rare and common variants, but less significant pairwise interaction arose from interaction between common and common variants.
Whether interactions are most often present in isolation or whether interacting genes form networks is an open question. Our results indicated that interacting genes formed small interacting networks and that hub genes were present in the networks. These hub genes might be essential for interaction, which in turn may lead to important biological functions causing phenotype variation. We identified large networks that were generated from examining interactions between loci associated with serum lipid levels in recent GWAS, although interactions between genes in the networks were mild. We suspect that these genes in the network may jointly make contributions to the phenotype variation. Our preliminary results also showed that interactions can be replicated in two independent studies and observed that interactions with hub genes were more easily replicated.
It is well known that population stratification or cryptic relatedness may create artifactual LD, which in turn will lead to spurious interaction. In the presence of population structure and cryptic relatedness, in general, we need to use mixed FRG to avoid the impact of population structure and cryptic relatedness on the tests. A detailed investigation is beyond the scope of this article.
NGS techniques generalize extremely high-dimensional genomic data. Transition of analysis from low-dimensional data to extremely high-dimensional data demands changes in the concept of interaction and quantitative trait models. Functional data analysis and the concept of group tests will provide a powerful tool for interaction analysis. However, the results presented in this article are considered preliminary. The number of basis functions in the expansion of genotype function will influence the performance of the FRG for interaction analysis. In practice, we select the number of basis functions which can explain 80%–90% of the genetic variation. Gene–gene interaction is an important but complex concept. Although functional data analysis and taking genomic regions as the unit of analysis can largely reduce the dimension of data for interaction analysis, genome-wide gene–gene interaction analysis still needs intensive computations. Genome-wide interaction analysis still poses great challenges. The main purpose of this article is to stimulate discussion about the optimal strategies for genome-wide interaction analysis. We hope that our results will greatly increase confidence in applying them to genome-wide gene–gene interaction analysis.
Data access
Software for implementing the proposed methods can be downloaded from Bioconductor (http://www.bioconductor.org/packages/2.14/bioc/html/FRGEpistasis.html) and our website http://www.sph.uth.tmc.edu/hgc/faculty/xiong/index.htm.
Acknowledgments
We thank the reviewers for their very useful comments. The project described was supported by grant 1R01AR057120–01 and 1R01HL106034-01 from the National Institutes of Health and National Heart, Lung, and Blood Institute (NHLBI), respectively. We acknowledge the support of the NHLBI and the contributions of the research institutions, study investigators, field staff, and study participants in creating this resource for biomedical research. Funding for GO ESP was provided by NHLBI grants RC2 HL-103010 (HeartGO), RC2 HL-102923 (LungGO), and RC2 HL-102924 (WHISP). The exome sequencing was performed through NHLBI grants RC2 HL-102925 (BroadGO) and RC2 HL-102926 (SeattleGO).
Footnotes
[Supplemental material is available for this article.]
Article published online before print. Article, supplemental material, and publication date are at http://www.genome.org/cgi/doi/10.1101/gr.161760.113.
References
- Ash RB, Gardner MF 1975. Topics in stochastic processes. Academic Press, New York [Google Scholar]
- Aulchenko YS, Ripatti S, Lindqvist I, Boomsma D, Heid IM 2009. Loci influencing lipid levels and coronary heart disease risk in 16 European population cohorts. Nat Genet 41: 47–55 [DOI] [PMC free article] [PubMed] [Google Scholar]
- Ay N 2002. Locality of global stochastic interaction in directed acyclic networks. Neural Comput 14: 2959–2980 [DOI] [PubMed] [Google Scholar]
- Bansal V, Libiger O, Torkamani A, Schork NJ 2010. Statistical analysis strategies for association studies involving rare variants. Nat Rev Genet 11: 773–785 [DOI] [PMC free article] [PubMed] [Google Scholar]
- Beasley TM, Erickson S, Allison DB 2009. Rank-based inverse normal transformations are increasingly used, but are they merited?. Behav Genet 39: 580–595 [DOI] [PMC free article] [PubMed] [Google Scholar]
- Bocianowski J 2012. The use of weighted multiple linear regression to estimate QTL-by-QTL epistatic effects. Genet Mol Biol 35: 802–809 [DOI] [PMC free article] [PubMed] [Google Scholar]
- Breen MS, Kemena C, Vlasov PK, Notredame C, Kondrashov FA 2012. Epistasis as the primary factor in molecular evolution. Nature 490: 535–538 [DOI] [PubMed] [Google Scholar]
- Chang JC, Meredith DM, Mayer PR, Borromeo MD, Lai HC, Ou Y, Johnson JE 2013. Prdm13 mediates the balance of inhibitory and excitatory neurons in somatosensory circuits. Dev Cell 25: 182–195 [DOI] [PMC free article] [PubMed] [Google Scholar]
- Charmandari E, Sertedaki A, Kino T, Merakou C, Hoffman DA, Hatch MM, Hurt DE, Lin L, Xekouki P, Stratakis CA, et al. 2012. A novel point mutation in the KCNJ5 gene causing primary hyperaldosteronism and early-onset autosomal dominant hypertension. J Clin Endocrinol Metab 97: E1532–E1539 [DOI] [PMC free article] [PubMed] [Google Scholar]
- Chen Z, Cui W 2010. A two-phase procedure for QTL mapping with regression models. Theor Appl Genet 121: 363–372 [DOI] [PubMed] [Google Scholar]
- Cordell HJ 2009. Detecting gene-gene interactions that underlie human diseases. Nat Rev Genet 10: 392–404 [DOI] [PMC free article] [PubMed] [Google Scholar]
- Costanzo M, Baryshnikova A, Bellay J, Kim Y, Spear ED, Sevier CS, Ding H, Koh JL, Toufighi K, Mostafavi S, et al. 2010. The genetic landscape of a cell. Science 327: 425–431 [DOI] [PMC free article] [PubMed] [Google Scholar]
- Ferraty F, Romain Y 2010. The Oxford handbook of functional data analysis. Oxford University Press, New York [Google Scholar]
- Fisher R 1918. The correlation between relatives on the supposition of Mendelian inheritance. Trans R Soc Edinb 52: 399–433 [Google Scholar]
- Guyon I, Elisseeff A 2003. An introduction to variable selection and feature selection. J Mach Learn Res 3: 1157–1182 [Google Scholar]
- Guyon I, Gunn S, Nikravesh M, Zadeh L 2006. Feature extraction: foundations and applications (Studies in fuzziness and soft computing). Springer, New York [Google Scholar]
- Hodzic D, Kong C, Wainszelbaum MJ, Charron AJ, Su X, Stahl PD 2006. TBC1D3, a hominoid oncoprotein, is encoded by a cluster of paralogues located on chromosome 17q12. Genomics 88: 731–736 [DOI] [PubMed] [Google Scholar]
- Hu S, Huang M, Li Z, Jia F, Ghosh Z, Lijkwan MA, Fasanaro P, Sun N, Wang X, Martelli F, et al. 2010. MicroRNA 210 as a novel therapy for treatment of ischemic heart disease. Circulation 122: S124–S131 [DOI] [PMC free article] [PubMed] [Google Scholar]
- Joyce P, Tavaré S 1995. The distribution of rare alleles. J Math Biol 33: 602–618 [DOI] [PubMed] [Google Scholar]
- Li B, Leal SM 2008. Methods for detecting associations with rare variants for common diseases: application to analysis of sequence data. Am J Hum Genet 83: 311–321 [DOI] [PMC free article] [PubMed] [Google Scholar]
- Li J, Tang R, Biernacka JM, de Andrade M 2009. Identification of gene-gene interaction using principal components. BMC Proc 3: S78. [DOI] [PMC free article] [PubMed] [Google Scholar]
- Luo L, Boerwinkle E, Xiong MM 2011. Association studies for next-generation sequencing. Genome Res 21: 1099–1108 [DOI] [PMC free article] [PubMed] [Google Scholar]
- Luo L, Zhu Y, Xiong MM 2012. Quantitative trait locus (QTL) analysis for next-generation sequencing with the functional linear models. J Med Genet 49: 513–524 [DOI] [PMC free article] [PubMed] [Google Scholar]
- Lyssand JS, DeFino MC, Tang XB, Hertz AL, Feller DB, Wacker JL, Adams ME, Hague C 2008. Blood pressure is regulated by an α1D-adrenergic receptor/dystrophin signalosome. J Biol Chem 283: 18792–18800 [DOI] [PMC free article] [PubMed] [Google Scholar]
- Madsen BE, Browning SR 2009. A groupwise association test for rare mutations using a weighted sum statistic. PLoS Genet 5: e1000384. [DOI] [PMC free article] [PubMed] [Google Scholar]
- Nelson MR, Wegmann D, Ehm MG, Kessner D, Jean St P, Verzilli C, Shen J, Tang Z, Bacanu SA, Fraser D, et al. 2012. An abundance of rare functional variants in 202 drug target genes sequenced in 14,002 people. Science 337: 100–104 [DOI] [PMC free article] [PubMed] [Google Scholar]
- Prabhu S, Pe’er I 2012. Ultrafast genome-wide scan for SNP-SNP interactions in common complex disease. Genome Res 22: 2230–2240 [DOI] [PMC free article] [PubMed] [Google Scholar]
- Ramsay JO, Silverman BW 2005. Functional data analysis. Springer, New York [Google Scholar]
- Saeys Y, Inza I, Larranaga P 2007. A review of feature selection techniques in bioinformatics. Bioinformatics 23: 2507–2517 [DOI] [PubMed] [Google Scholar]
- Sakamoto A, Sugamoto Y, Tokunaga Y, Yoshimuta T, Hayashi K, Konno T, Kawashiri MA, Takeda Y, Yamagishi M 2011. Expression profiling of the ephrin (EFN) and Eph receptor (EPH) family of genes in atherosclerosis-related human cells. J Int Med Res 39: 522–527 [DOI] [PubMed] [Google Scholar]
- Steen KV 2011. Travelling the world of gene–gene interactions. Brief Bioinform 13: 1–19 [DOI] [PubMed] [Google Scholar]
- Tennessen JA, Bigham AW, O’Connor TD, Fu W, Kenny EE, Gravel S, McGee S, Do R, Liu X, Jun G, et al. 2012. Evolution and functional impact of rare coding variation from deep sequencing of human exomes. Science 337: 64–69 [DOI] [PMC free article] [PubMed] [Google Scholar]
- Wu MC, Lee S, Cai T, Li Y, Boehnke M, Lin X 2011. Rare-variant association testing for sequencing data with the sequence kernel association test. Am J Hum Genet 89: 82–93 [DOI] [PMC free article] [PubMed] [Google Scholar]