

Abstract
Accurate and timely diagnosis of dementia is important to guide management and provide appropriate information and support to patients and families. Currently, with the exception of individuals with genetic mutations, postmortem examination of brain tissue remains the only definitive means of establishing diagnosis in most cases, however, structural neuroimaging, in combination with clinical assessment, has value in improving diagnostic accuracy during life. Beyond the exclusion of surgical pathology, signal change and cerebral atrophy visible on structural MRI can be used to identify diagnostically relevant imaging features, which provide support for clinical diagnosis of neurodegenerative dementias. While no structural imaging feature has perfect sensitivity and specificity for a given diagnosis, there are a number of imaging characteristics which provide positive predictive value and help to narrow the differential diagnosis. While neuroradiological expertise is invaluable in accurate scan interpretation, there is much that a non-radiologist can gain from a focused and structured approach to scan analysis. In this article we describe the characteristic MRI findings of the various dementias and provide a structured algorithm with the aim of providing clinicians with a practical guide to assessing scans.
Keywords: DEMENTIA, VASCULAR DEMENTIA, NEURORADIOLOGY, MRI, IMAGE ANALYSIS
Introduction
There are an estimated 36 million people with dementia worldwide, with this figure expected to double every 20 years as the population ages.1 In response to this challenge a number of countries have committed to long-term national dementia strategies, which include improving timely diagnosis.2–5 For many patients there are delays in diagnosis of dementia, preventing them from accessing relevant care services, information and treatment.6–8 Patients with unrecognised cognitive impairment present in a range of clinical settings often with health concerns unrelated to dementia: in one study 42% of those aged over 70 years admitted to an acute medical admissions unit had dementia, with only half having been diagnosed prior to admission.9
The most common causes of dementia are Alzheimer's disease (AD), vascular disease (in several forms), dementia with Lewy bodies (DLB) and frontotemporal lobar degeneration (FTLD), but there are many others.10 11 Accurate and early diagnosis has considerable implications for the patient in terms of prognosis and management and will be increasingly important if and when disease modifying treatments become available. Currently, postmortem examination of brain tissue remains the only definitive means of establishing diagnosis in most cases. Molecular biomarkers are now available to provide support for a diagnosis of AD in life, for example, amyloid imaging with positron emission tomography (PET) and cerebrospinal fluid (CSF) analysis of amyloid-β (Aβ1–42) and tau,12 13 however, these markers are mainly research tools and definitive blood tests are still lacking. Until these techniques become widely available, structural neuroimaging, in combination with clinical assessment, offers the greatest utility in improving diagnostic accuracy during life.
The UK National Institute of Health and Care Excellence (NICE), European and US diagnostic guidelines14–17 recommend that structural imaging (non-contrast enhanced CT or ideally MRI) should be performed in the evaluation of patients with suspected dementia. In recognition of advances in imaging research, the justification for this has shifted from the exclusion of surgical pathology (eg, cerebral tumours), although still relevant, to the inclusion of features that help to support a clinical diagnosis of the underlying cause(s) of the dementia. MRI offers a number of advantages over CT18 and is the imaging modality of choice in identifying diagnostic imaging features.14 15 17 While no structural imaging features have perfect sensitivity and specificity for any given diagnosis, there are a number which provide positive predictive value and help to narrow the differential diagnosis to the most likely underlying pathologies. By describing these characteristic MRI findings in the context of a structured algorithm, this article aims to provide clinicians with a practical means of extracting useful imaging features of common dementias in order to improve diagnostic accuracy. While neuroradiology expertise is invaluable in accurate scan interpretation, there is much that a non-radiologist can gain from a focused and structured approach to scan analysis.
Systematic assessment of structural imaging
Beyond the exclusion of surgical pathology, structural MRI in patients with suspected dementia should be assessed in terms of signal change on MRI and cerebral atrophy in a systematic fashion.19 The assessment of signal change using T2-weighted imaging or fluid attenuated inversion recovery (FLAIR) can be used to help identify vascular damage, but can also indicate inflammatory, metabolic, toxic or infective processes which may be contributing to cognitive deficits. The presence and topographical pattern of cerebral atrophy has (pathologically proven) positive predictive value for dementia.20 Based on these two broad categories, a systematic approach to identifying diagnostically relevant imaging features, which provide support for clinical diagnosis, is presented in figure 1 and discussed in detail below and expanded in figures 2 and 3. Using the predominant imaging features of the most common causes of dementia, the diagnosis with the greatest likelihood is presented. Figure 4 presents (mostly pathologically proven) imaging examples of many of the features described.
Figure 1.
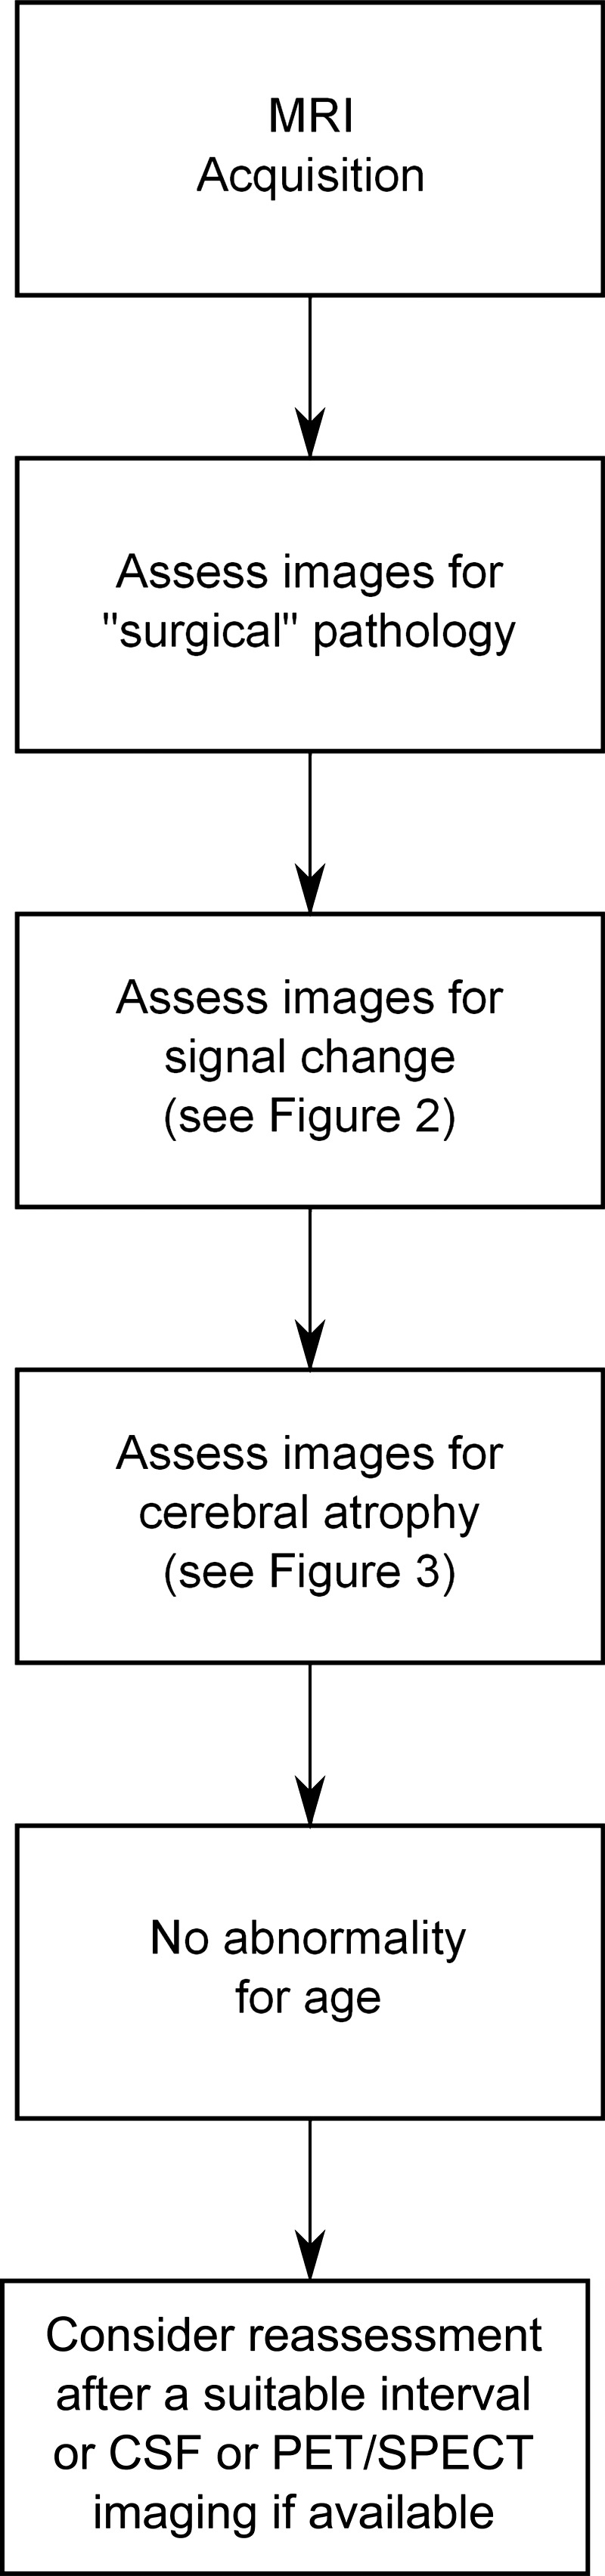
Algorithmic assessment of MRI in dementia.
Figure 2.

An approach to signal change assessment in cognitive impairment.
Figure 3.

An approach to cerebral atrophy assessment in cognitive impairment.
Figure 4.

Images demonstrating characteristic atrophy in several forms of pathologically proven dementia (Displayed as clinical diagnosis—pathology diagnosis, * indicates pathology findings not available).
The algorithm
Exclusion of surgical pathology
The exclusion of a structural brain lesion potentially amenable to surgical intervention should be the starting point when reviewing structural imaging. These include tumour (eg, meningioma, glioma), subdural haematoma, arteriovenous malformation and hydrocephalus. Idiopathic normal pressure hydrocephalus should also be considered, although imaging markers have not yet proved sensitive enough for reliable diagnosis.21 22
Assessment of ‘signal change’
Signal intensity within a single tissue type should be reasonably uniform on MRI. The presence of regions of hyperintensity or hypointensity within the tissue typically reflects pathology. In the context of a suspected dementia, punctate or confluent regions of signal change within white matter or deep grey matter are most commonly associated with vascular pathology, but rarely (and in the correct clinical context) may also indicate inflammatory, metabolic or infective processes. The prevalence of vascular cognitive impairment (VCI) is second only to AD. They share many risk factors, including an increasing prevalence with age, and therefore, in many patients vascular and degenerative pathology coexist.23 The exact interaction between neurodegenerative and vascular pathology is debated but critically for the patient, it is important that vascular risk factors are managed and treated. Differentiating the relative contribution of vascular from neurodegenerative pathology as the cause of a patient's cognitive problems is a common clinical problem where MRI plays a central role. If MRI is not possible, CT can also be used relatively effectively to evaluate the presence and extent of cerebrovascular disease, with changes in white matter appearing hypodense.
Clinical and research guidelines require imaging evidence of cerebrovascular disease for a diagnosis of vascular dementia (VaD) or VCI to be made.23 24 In the absence of evidence of vascular damage on MRI a vascular cause for cognitive impairment is very unlikely; conversely, extensive vascular changes are very likely to produce significant cognitive deficits.25 The clinical difficulty lies in determining whether a mild or moderate degree of vascular changes is sufficient to explain the clinical picture, particularly in older people where mixed vascular and neurodegenerative pathology is more common. While it remains important to address treatable vascular risk factors, treating a potential neurodegenerative condition, for example, with cholinesterase inhibition should not be overlooked. Serial imaging may help identify the relative contributions and there is some evidence that the rate of cognitive decline may provide further evidence of the underlying pathology, with patients with VaD typically declining at a slower rate than patients with neurodegenerative pathology.26
T2-weighted images including FLAIR are most useful in detecting ischaemic changes while T2* or susceptibility weighted imaging can identify microbleeds suggestive of cerebral amyloid angiopathy or arteriosclerotic small vessel disease (SVD). Diffusion weighted imaging may be useful in cases of rapid cognitive decline suggestive of prion disease. Figure 2 describes a systematic assessment of MR signal changes in the context of dementia.
FLAIR/T2 hyperintensity
Located in cerebral white matter: Hyperintensities in cerebral white matter on T2-weighted or FLAIR imaging, and less prominently on T1-weighted imaging, are more likely to be vascular in origin. If deep grey matter and brainstem hyperintensities are also apparent the term subcortical hyperintensities of presumed vascular origin should be used.27 The severity of hyperintensities can be visually quantified by application of an established rating scale such as the age-related white matter changes scale28 or the Fazekas scale.29 Confluence of hyperintensities in at least two regions, and the beginning of confluence of hyperintensities in a further two regions, is considered to represent the involvement of at least a quarter of the total white matter and is sufficient to assume SVD is the cause of VCI or VaD.30 However, even in cases of extensive white matter hyperintensities, the existence of mixed pathology should be considered, although it may be difficult to confirm or refute. Extension of confluent hyperintensities into the temporal poles is rare and may indicate that the pathology is not of ‘conventional’ vascular origin. If the patient has a positive family history of dementing illness and is known to have suffered previously from strokes and/or migraines, cerebral autosomal dominant arteriopathy with subcortical infarcts and leukoencephalopathy (CADASIL) should also be considered and genetic testing may be appropriate19 31 (see figure 4). Although a relatively rare form of dementia, CADASIL is included here due to this fairly specific (but not entirely sensitive) feature of non-enhancing hyperintensities extending in to the temporal poles, with white matter changes often appearing relatively more severe than expected from the patient's clinical appearance. While temporal lobe extension raises the question of CADASIL it may also feature in demyelinating conditions such as multiple sclerosis.32 If demyelinating disease is a diagnostic consideration then contrast enhanced axial T1-weighted brain scanning with Gadolinium may demonstrate active/new lesions.33 Less often, multifocal/confluent regions of hyperintensity in a patient with suspected dementia may result from a number of other conditions, including infections, inflammatory demyelinating diseases, leukodystrophies or leukoencephalopathies.19 34 Infective processes may need consideration in immunocompromised patients at risk of opportunistic infections, including cerebral toxoplasmosis.35
Strategic Infarcts: T2/FLAIR hyperintensities with corresponding T1 hypointensity in strategic locations such as arterial territories, association areas and watershed carotid territories may be sufficient to produce cognitive symptoms which can be termed VaD due to large vessel disease.30 36 Hyperintensities with CSF-like signal intensity on all MRI sequences (dark on T1 and FLAIR, bright on T2) in the region of a single deep perforating arteriole are likely to represent recent small deep brain infarcts.27 The inclusion of a rim of hyperintensity on FLAIR images (thought to reflect gliosis) is sufficient to indicate a lacune of vascular origin, and is useful to help distinguish them from prominent perivascular spaces.27 Additionally, prominent perivascular spaces will typically appear linear when imaged parallel to the course of the vessel, and round or ovoid, with a diameter generally smaller than 3 mm, when imaged perpendicular to the course of the vessel.27 Bilateral thalamic lesions are sufficient to imply VaD due to SVD.30 It should be noted that T2-weighted images are more sensitive to signal change in the thalamus than FLAIR images.37
Striatum and/or neocortex: Although rare, Creutzfeldt-Jakob disease is included in the algorithm as it has very characteristic MRI features: hyperintensities in the cortex and/or basal ganglia, particularly in the putamen, best seen on FLAIR imaging. Diffusion weighted imaging sequences have greater sensitivity to hyperintensities within these regions38 (see figure 4), which may be especially prominent in the early stages of the disease when vacuoles are small resulting in restricted diffusion.19 In rapidly progressive dementia where there is doubt over the diagnosis of Creutzfeldt-Jakob disease, contrast enhanced MRI scanning is recommended to rule out alternative causes.
No Regions of Hyperintensity: The absence of hyperintensities on T2 or FLAIR imaging indicates the patient's symptoms are very unlikely to be vascular in origin. Neurodegenerative pathology therefore remains the most likely cause of cognitive impairment and structural imaging should be assessed for atrophy.
T2* hypointensity
T2* gradient-echo (or susceptibility weighted imaging) is required in order to detect cerebral microhaemorrhages or microbleeds (CMBs). Radiologically these are defined as small, rounded, homogeneous hypointense lesions,39 while pathologically they have been found to represent focal leakage of blood-breakdown products from abnormal (small) blood vessels.40 The location of CMBs broadly reflects their underlying cause, with CMBs associated with hypertension developing in deep brain regions (basal ganglia, thalamus and brainstem), while the distribution of CMBs associated with cerebral amyloid angiopathy (eg, in AD) is mostly cortical-subcortical (lobar)19 (see figure 4); although the two conditions often coexist in elderly subjects.41 42 A conservative estimate from a large population based study suggests the incidence of microbleeds in the general population is approximately 10%.43
T2* hypointensities may also result from calcification, iron deposits (from causes other than CMBs), haemorrhagic metastasis or diffuse axonal injury. Care should also be taken to exclude MR artefacts such as flow voids or signals from temporal bones.
Cerebral atrophy assessment
Atrophy is the principal imaging finding in neurodegenerative dementias and is typically best identified on T1-weighted images and assessed on a combination of axial, sagittal and coronal views. Despite a degree of overlap among disease subtypes, some patterns of atrophy are indicative of specific underlying pathology, however, such findings should be considered in the context of the patient's age and clinical examination. Figure 3 sets out an approach to the assessment of cerebral atrophy.
Focal lobar atrophy
Atrophy with a focal lobar predominance is a useful starting point to help narrow the differential diagnosis in patients with cognitive decline. In particular, an asymmetrical pattern of atrophy (left greater than right or vice versa) or more anterior than posterior atrophy, is more suggestive of underlying FTLD pathology rather than AD pathology.
Frontal lobe: Disproportionate frontal lobe atrophy is associated with FTLD pathology but does not differentiate between different FTLD histopathologies (eg, Pick's disease or corticobasal degeneration (CBD)). Patients with behavioural variant FTD (bvFTD) may have symmetrical or asymmetrical frontal atrophy with or without additional temporal lobe atrophy.44–46 Despite a typically asymmetric clinical presentation, symmetrical frontal lobe atrophy is the predominant imaging finding in patients with dementia due to CBD pathology.47–49 However, many patients with a clinical diagnosis of corticobasal syndrome are found to have pathology other than CBD at postmortem,50 which may account for some of the variability reported in the literature. Currently imaging features are not included in the diagnostic criteria for CBD.51 Left-sided posterior frontoinsular atrophy, which may be limited to a subtle widening of the left sylvian fissure, is typically found in cases of progressive non-fluent aphasia44 52 (see figure 4).
Temporal lobe: Asymmetric temporal atrophy is most commonly due to FTLD pathology but can also be due to AD. The semantic dementia variant of FTD has a characteristic pattern of loss: typically, left greater than right focal anterior temporal atrophy particularly involving the temporal pole (which progresses to ‘knife edge’ atrophy), the amygdala and anterior hippocampus and often selective loss of anterior fusiform gyrus, with relative preservation of more posterior structures.44 45 52–54 Asymmetrical atrophy of the right temporal lobe with a similar distribution to SD may also occur, most commonly presenting as bvFTD and often with additional features of prosopagnosia and/or topographical memory impairment.55 While the asymmetry is usually dramatic in SD and the right temporal variant of bvFTD, both temporal lobes usually become involved and over time the pattern of atrophy may start to look more symmetrical (see figure 4).45 56 57 Logopenic aphasia (LPA) is also associated with greater left-sided atrophy in the temporal lobe although in contrast to SD the pattern of atrophy extends more posteriorly than in SD, predominantly affecting the posterior perisylvian and temporoparietal areas (angular gyrus, posterior middle temporal gyrus, superior temporal gyrus and superior temporal sulcus) 44 58 (see figure 4). Unlike the majority of clinical syndromes associated with an asymmetrical pattern of atrophy, LPA is typically found to be a result of AD pathology.49 Nonetheless the presence of an anterior/posterior atrophy gradient in the temporal lobe is suggestive of FTLD rather than AD and can usefully be assessed by scrolling posterior to anterior through coronal T1 slices of the temporal lobe.
Parietal/Occipital lobe: Posterior cortical atrophy (PCA) involving the parietal/occipital cortex is usually the result of underlying AD pathology (see figure 4), however the differential diagnosis includes CBD, DLB and other less common causes. PCA with additional medial temporal lobe (MTL) atrophy supports AD as the most likely cause however the MTL may initially be (relatively) spared in posterior variant AD (PCA), especially in early-onset cases.59 Visual rating of posterior atrophy in combination with MTL atrophy rating has been reported to help discriminate AD from FTD and AD from normal ageing with a sensitivity of 73% and specificity of 87%.60 Gross frontoparietal atrophy (extending into the temporal lobe) confined to a single hemisphere has been described in patients with progranulin mutations and should be considered in the presence of a strong family history.61–63
Focal hippocampal atrophy
Hippocampal atrophy is the most established imaging biomarker of AD and as a result has now been incorporated in to diagnostic criteria.14 16 17 The sensitivity and specificity of visual rating of MTL atrophy are approximately 80% when mild AD cases are compared with elderly control subjects.64 Relative preservation of the MTL is suggested as a means of distinguishing DLB from AD at a group level,65 however this may not be true of older patients or patients with advanced DLB and may not be reliable in individual cases66 (see figure 4), particularly as many patients with DLB pathology also have AD pathology at postmortem.67 Dopamine transporter imaging offers greater utility in distinguishing DLB from AD.68 Hippocampal atrophy is also a feature of hippocampal sclerosis and hyperintensity of the hippocampus on T2 or FLAIR images makes this diagnosis more likely. Focal (and often severe) atrophy affecting the anteromedial temporal lobes has been described in tau mutation (microtubule associated protein tau (MAPT)) carriers, with striking loss of the amygdala, parahippocampus and hippocampal heads bilaterally62 63 69 (see figure 4). Although more often asymmetrical, bvFTD may also demonstrate symmetrical MTL atrophy and/or frontal lobe atrophy.45 56 57
Infratentorial atrophy
Progressive supranuclear palsy (PSP) can present as a dementia, often with frontal features or occasionally with progressive non-fluent aphasia. Midbrain atrophy is characteristic of PSP and has been described as having a ‘hummingbird’ appearance in midsagittal slices (see figure 4), with axial slices demonstrating the so called ‘mickey mouse’ sign. Other imaging features in PSP include dilation of the third ventricle and atrophy of the red nucleus.70 Frontal atrophy may be subtle or marked in PSP. Pontocerebellar atrophy may indicate other neurodegenerative conditions such as multiple system atrophy, which in rare cases may present with a cognitive phenotype.19
Generalised atrophy
Global volume loss without focal lobar atrophy is a common and non-specific finding on structural MRI studies in normal ageing and dementia, and it can sometimes be difficult to determine where normal ageing ends and pathological atrophy begins. Symmetrical generalised atrophy (ie, left=right, anterior=posterior) is typically seen in AD and DLB, and may also accompany white matter changes in patients with vascular disease.
No imaging abnormality demonstrated
When all stages fail to reveal any abnormalities, beyond what is expected for age, the scan is reported as within normal limits. This does not of course exclude dementia, nor does it rule out a neurodegenerative cause particularly if the clinical syndrome is mild. If clinical suspicion persists, a SPECT (single photon emission computed tomography) or PET scan can be helpful to look for changes in cerebral perfusion/metabolism, or repeat MRI scanning in 6–12 months. Normal imaging particularly with repeat imaging after (greater than) 6 months should however prompt consideration of a non-neurodegenerative cause including psychiatric conditions. In the future molecular diagnostic indices such as CSF Aβ1–42 or amyloid PET scanning may increasingly be used to confirm or exclude the presence of AD (amyloid) pathology in these cases.
Conclusion
Clinical diagnosis of the cause of cognitive complaints or decline can be difficult. Nonetheless accurate and timely diagnosis is increasingly important to guide management and to provide appropriate information and support. As reflected in current diagnostic guidelines, structural imaging can provide valuable positive as well as negative predictive information and the algorithm described here, based on reported imaging features with greatest diagnostic value, is designed to provide a systematic aid to help differentiate between the different causes of dementia. It is of course important that imaging findings are interpreted in the correct clinical context and that the limitations of making an individual diagnosis on the basis of imaging findings are recognised.
While the diagnostic approach we describe here is based on visual assessment of structural imaging, techniques such as volumetric quantification of brain structures and automated classifier algorithms may play a complementary role in future clinical practice. Brain volumetry is already used extensively in research studies71 and clinical trials72 and has the potential to be used at the single patient level to help support diagnosis and monitor disease progression.73
In the meantime, structural imaging in cognitive cases can provide easily accessible, clinically useful information that can be realistically assessed by the non-specialist. Using a systematic approach such as set out in this article may help clinicians in evaluating their own scans, rather than relying on radiological reports alone, and ultimately support the diagnostic process. Further work is, however, required to evaluate the sensitivity and specificity of imaging signatures for neurodegenerative pathology.
Acknowledgments
The authors thank Dr Colin Mahoney for helpful comments on atrophy in FTD. This work was carried out at the NIHR Queen Square Biomedical Research Unit in Dementia, and with the support of the Leonard Wolfson Experimental Neurology Centre. The Dementia Research Centre is an Alzheimer's Research UK Coordinating Centre. LH is supported by Alzheimer's Research UK.
Footnotes
Contributors: NCF, FB and PS devised the original concept of the article. LH, NCF and JMS planned and wrote the article. All authors revised and approved the final version to be published.
Competing interests: None.
Provenance and peer review: Commissioned; externally peer reviewed.
References
- 1.World Health Organisation. Alzheimer's disease international. Dementia: A public health priority. WHO Press, 2012 [Google Scholar]
- 2.2008. Direction générale de l'action sociale, Direction de la sécurité sociale, Direction de l'hospitalisation et de l'organisation des soins. Plan Alzheimer et maladies apparentées 2008–2012.
- 3.UK Department of Health. Living well with dementia: a National Dementia Strategy. 2009
- 4.UK Department of Health. Prime minister's challenge on dementia—Delivering major improvements in dementia care and research by 2015. 2012
- 5.US Department of Health and Human Services. National plan to address Alzheimer's disease. 2012
- 6.de Vries K, Brooker DJ, Smith P. Dementia skills and competencies for primary care liaison: a model for improving identification and timely diagnosis. Prim Health Care Res Dev 2013 Jul;14(3):240–9 [DOI] [PubMed] [Google Scholar]
- 7.Joray S, Wietlisbach V, Büla CJ. Cognitive impairment in elderly medical inpatients: detection and associated six-month outcomes. Am J Geriatr Psychiatry 2004;12:639–47 [DOI] [PubMed] [Google Scholar]
- 8.Mitchell AJ, Meader N, Pentzek M. Clinical recognition of dementia and cognitive impairment in primary care: a meta-analysis of physician accuracy. Acta Psychiatr Scand 2011;124:165–83 [DOI] [PubMed] [Google Scholar]
- 9.Sampson EL, Blanchard MR, Jones L, et al. Dementia in the acute hospital: prospective cohort study of prevalence and mortality. Br J Psychiatry 2009;195:61–6 [DOI] [PubMed] [Google Scholar]
- 10.Cohn-Hokke PE, Elting MW, Pijnenburg YAL, et al. Genetics of dementia: update and guidelines for the clinician. Am J Med Genet B Neuropsychiatr Genet. 2012;159B:628–43 [DOI] [PubMed] [Google Scholar]
- 11.Rossor MN, Fox NC, Mummery CJ, et al. The diagnosis of young-onset dementia. Lancet Neurol 2010;9:793–806 [DOI] [PMC free article] [PubMed] [Google Scholar]
- 12.Clark CM, Pontecorvo MJ, Beach TG, et al. Cerebral PET with florbetapir compared with neuropathology at autopsy for detection of neuritic amyloid-βplaques: a prospective cohort study. Lancet Neurol 2012;11:669–78 [DOI] [PubMed] [Google Scholar]
- 13.Mattsson N, Zetterberg H, Hansson O, et al. CSF biomarkers and incipient Alzheimer disease in patients with mild cognitive impairment. JAMA 2009;302:385–93 [DOI] [PubMed] [Google Scholar]
- 14.Dubois B, Feldman HH, Jacova C, et al. Research criteria for the diagnosis of Alzheimer's disease: revising the NINCDS-ADRDA criteria. Lancet Neurol 2007;6:734–46 [DOI] [PubMed] [Google Scholar]
- 15.Hort J, O'Brien JT, Gainotti G, et al. EFNS guidelines for the diagnosis and management of Alzheimer's disease. Eur J Neurol 2010;17:1236–48 [DOI] [PubMed] [Google Scholar]
- 16.Jack CR, Jr, Albert MS, Knopman DS, et al. Introduction to the recommendations from the National Institute on Aging-Alzheimer's Association workgroups on diagnostic guidelines for Alzheimer's disease. Alzheimers Dement 2011;7:257–62 [DOI] [PMC free article] [PubMed] [Google Scholar]
- 17.NCC for Mental Health. Dementia: The NICE-SCIE Guideline on Supporting People with Dementia and Their Carers in Health and Social Care (National Clinical Practice Guideline). British Psychological Society and RCPsych Publications; 2007 [PubMed] [Google Scholar]
- 18.Scheltens P, Fox N, Barkhof F, et al. Structural magnetic resonance imaging in the practical assessment of dementia: beyond exclusion. Lancet Neurol 2002;1:13–21 [DOI] [PubMed] [Google Scholar]
- 19.Barkof F, Fox NC, Bastos-Leite AJ, et al. Neuroimaging in Dementia. Springer Berlin Heidelberg, 2011 [Google Scholar]
- 20.Likeman M, Anderson VM, Stevens JM, et al. Visual assessment of atrophy on magnetic resonance imaging in the diagnosis of pathologically confirmed young-onset dementias. Arch Neurol 2005;62:1410–15 [DOI] [PubMed] [Google Scholar]
- 21.Di Ieva A, Valli M, Cusimano MD. Distinguishing Alzheimer's disease from normal pressure hydrocephalus: a search for MRI biomarkers. J Alzheimers Dis 2013. [Epub ahead of print] [DOI] [PubMed] [Google Scholar]
- 22.Malm J, Graff-Radford NR, Ishikawa M, et al. Influence of comorbidities in idiopathic normal pressure hydrocephalus—research and clinical care. A report of the ISHCSF task force on comorbidities in INPH. Fluids Barriers CNS 2013;10:22. [DOI] [PMC free article] [PubMed] [Google Scholar]
- 23.Gorelick PB, Scuteri A, Black SE, et al. Vascular contributions to cognitive impairment and dementia: a statement for healthcare professionals from the american heart association/american stroke association. Stroke 2011;42:2672–713 [DOI] [PMC free article] [PubMed] [Google Scholar]
- 24.Román GC, Tatemichi TK, Erkinjuntti T, et al. Vascular dementia: diagnostic criteria for research studies. Report of the NINDS-AIREN International Workshop. Neurology 1993;43:250–60 [DOI] [PubMed] [Google Scholar]
- 25.Inzitari D, Simoni M, Pracucci G, et al. Risk of rapid global functional decline in elderly patients with severe cerebral age-related white matter changes: the LADIS study. Arch Intern Med 2007;167:81–8 [DOI] [PubMed] [Google Scholar]
- 26.Gill DP, Hubbard RA, Koepsell TD, et al. Differences in rate of functional decline across three dementia types. Alzheimers Dement 2013. May 2. pii: S1552–5260(12)02572–1 [DOI] [PMC free article] [PubMed] [Google Scholar]
- 27.Wardlaw JM, Smith EE, Biessels GJ, et al. Neuroimaging standards for research into small vessel disease and its contribution to ageing and neurodegeneration. Lancet Neurol 2013;12:822–38 [DOI] [PMC free article] [PubMed] [Google Scholar]
- 28.Wahlund LO, Barkhof F, Fazekas F, et al. A new rating scale for age-related white matter changes applicable to MRI and CT. Stroke 2001;32:1318–22 [DOI] [PubMed] [Google Scholar]
- 29.Fazekas F, Chawluk JB, Alavi A, et al. MR signal abnormalities at 1.5 T in Alzheimer's dementia and normal aging. AJR Am J Roentgenol 1987;149:351–6 [DOI] [PubMed] [Google Scholar]
- 30.van Straaten ECW, Scheltens P, Knol DL, et al. Operational definitions for the NINDS-AIREN criteria for vascular dementia: an interobserver study. Stroke 2003;34:1907–12 [DOI] [PubMed] [Google Scholar]
- 31.Federico A, Di Donato I, Bianchi S, et al. Hereditary cerebral small vessel diseases: a review. J Neurol Sci 2012;322:25–30 [DOI] [PubMed] [Google Scholar]
- 32.Barkhof F, Filippi M, Miller DH, et al. Comparison of MRI criteria at first presentation to predict conversion to clinically definite multiple sclerosis. Brain 1997;120(Pt 11):2059–69 [DOI] [PubMed] [Google Scholar]
- 33.Polman CH, Reingold SC, Banwell B, et al. Diagnostic criteria for multiple sclerosis: 2010 revisions to the McDonald criteria. Ann Neurol 2011;69:292–302 [DOI] [PMC free article] [PubMed] [Google Scholar]
- 34.Marjo Van Der Valk JV. Magnetic resonance of myelination and myelin disorders. illustrated edn Springer, 2005 [Google Scholar]
- 35.Levine AJ, Hinkin CH, Ando K, et al. An exploratory study of long-term neurocognitive outcomes following recovery from opportunistic brain infections in HIV+ adults. J Clin Exp Neuropsychol 2008;30:836–43 [DOI] [PMC free article] [PubMed] [Google Scholar]
- 36.Carrera E, Bogousslavsky J. The thalamus and behavior: effects of anatomically distinct strokes. Neurology 2006;66:1817–23 [DOI] [PubMed] [Google Scholar]
- 37.Bastos Leite AJ, van Straaten ECW, Scheltens P, et al. Thalamic lesions in vascular dementia: low sensitivity of fluid-attenuated inversion recovery (FLAIR) imaging. Stroke 2004;35:415–19 [DOI] [PubMed] [Google Scholar]
- 38.Kallenberg K, Schulz-Schaeffer WJ, Jastrow U, et al. Creutzfeldt-Jakob disease: comparative analysis of MR imaging sequences. AJNR Am J Neuroradiol 2006;27:1459–62 [PMC free article] [PubMed] [Google Scholar]
- 39.Charidimou A, Jäger HR, Werring DJ. Cerebral microbleed detection and mapping: principles, methodological aspects and rationale in vascular dementia. Exp Gerontol 2012;47:843–52 [DOI] [PubMed] [Google Scholar]
- 40.Fazekas F, Kleinert R, Roob G, et al. Histopathologic analysis of foci of signal loss on gradient-echo T2*-weighted MR images in patients with spontaneous intracerebral hemorrhage: evidence of microangiopathy-related microbleeds. AJNR Am J Neuroradiol 1999;20:637–42 [PMC free article] [PubMed] [Google Scholar]
- 41.Cordonnier C, van der Flier WM. Brain microbleeds and Alzheimer's disease: innocent observation or key player? Brain 2011;134(Pt 2):335–44 [DOI] [PubMed] [Google Scholar]
- 42.Ryan NS, Bastos-Leite AJ, Rohrer JD, et al. Cerebral microbleeds in familial Alzheimer's disease. Brain 2012;135(Pt 1):e201; author reply e202 [DOI] [PMC free article] [PubMed] [Google Scholar]
- 43.Poels MMF, Ikram MA, van der Lugt A, et al. Incidence of cerebral microbleeds in the general population: the Rotterdam Scan Study. Stroke 2011;42:656–61 [DOI] [PubMed] [Google Scholar]
- 44.Gorno-Tempini ML, Hillis AE, Weintraub S, et al. Classification of primary progressive aphasia and its variants. Neurology 2011;76:1006–14 [DOI] [PMC free article] [PubMed] [Google Scholar]
- 45.Lindberg O, Ostberg P, Zandbelt BB, et al. Cortical morphometric subclassification of frontotemporal lobar degeneration. AJNR Am J Neuroradiol 2009;30:1233–9 [DOI] [PMC free article] [PubMed] [Google Scholar]
- 46.Whitwell JL, Xu J, Mandrekar J, et al. Frontal asymmetry in behavioral variant frontotemporal dementia: clinicoimaging and pathogenetic correlates. Neurobiol Aging 2013;34:636–9 [DOI] [PMC free article] [PubMed] [Google Scholar]
- 47.Lee SE, Rabinovici GD, Mayo MC, et al. Clinicopathological correlations in corticobasal degeneration. Ann Neurol 2011;70:327–40 [DOI] [PMC free article] [PubMed] [Google Scholar]
- 48.Rohrer JD, Lashley T, Schott JM, et al. Clinical and neuroanatomical signatures of tissue pathology in frontotemporal lobar degeneration. Brain 2011;134(Pt 9):2565–81 [DOI] [PMC free article] [PubMed] [Google Scholar]
- 49.Whitwell JL, Josephs KA. Neuroimaging in frontotemporal lobar degeneration–predicting molecular pathology. Nat Rev Neurol 2011;8:131–42 [DOI] [PubMed] [Google Scholar]
- 50.Boeve BF, Maraganore DM, Parisi JE, et al. Pathologic heterogeneity in clinically diagnosed corticobasal degeneration. Neurology 1999;53:795–800 [DOI] [PubMed] [Google Scholar]
- 51.Armstrong MJ, Litvan I, Lang AE, et al. Criteria for the diagnosis of corticobasal degeneration. Neurology 2013;80:496–503 [DOI] [PMC free article] [PubMed] [Google Scholar]
- 52.Rohrer JD, Clarkson MJ, Kittus R, et al. Rates of hemispheric and lobar atrophy in the language variants of frontotemporal lobar degeneration. J Alzheimers Dis 2012;30:407–11 [DOI] [PMC free article] [PubMed] [Google Scholar]
- 53.Chan D, Fox NC, Scahill RI, et al. Patterns of temporal lobe atrophy in semantic dementia and Alzheimer's disease. Ann Neurol 2001;49:433–42 [PubMed] [Google Scholar]
- 54.Gorno-Tempini ML, Dronkers NF, Rankin KP, et al. Cognition and anatomy in three variants of primary progressive aphasia. Ann Neurol 2004;55:335–46 [DOI] [PMC free article] [PubMed] [Google Scholar]
- 55.Chan D, Anderson V, Pijnenburg Y, et al. The clinical profile of right temporal lobe atrophy. Brain 2009;132(Pt 5):1287–98 [DOI] [PubMed] [Google Scholar]
- 56.Rascovsky K, Hodges JR, Knopman D, et al. Sensitivity of revised diagnostic criteria for the behavioural variant of frontotemporal dementia. Brain 2011;134(Pt 9):2456–77 [DOI] [PMC free article] [PubMed] [Google Scholar]
- 57.Rosen HJ, Allison SC, Schauer GF, et al. Neuroanatomical correlates of behavioural disorders in dementia. Brain 2005;128(Pt 11):2612–25 [DOI] [PMC free article] [PubMed] [Google Scholar]
- 58.Rohrer JD, Ridgway GR, Crutch SJ, et al. Progressive logopenic/phonological aphasia: erosion of the language network. Neuroimage 2010;49:984–93 [DOI] [PMC free article] [PubMed] [Google Scholar]
- 59.Lehmann M, Koedam ELGE, Barnes J, et al. Posterior cerebral atrophy in the absence of medial temporal lobe atrophy in pathologically-confirmed Alzheimer's disease. Neurobiol Aging 2012;33:627.e1–627.e12 [DOI] [PMC free article] [PubMed] [Google Scholar]
- 60.Koedam ELGE, Lehmann M, van der Flier WM, et al. Visual assessment of posterior atrophy development of a MRI rating scale. Eur Radiol 2011;21: 2618–25 [DOI] [PMC free article] [PubMed] [Google Scholar]
- 61.Beck J, Rohrer JD, Campbell T, et al. A distinct clinical, neuropsychological and radiological phenotype is associated with progranulin gene mutations in a large UK series. Brain 2008;1313):706–20 [DOI] [PMC free article] [PubMed] [Google Scholar]
- 62.Rohrer JD, Ridgway GR, Modat M, et al. Distinct profiles of brain atrophy in frontotemporal lobar degeneration caused by progranulin and tau mutations. Neuroimage 2010;53:1070–6 [DOI] [PMC free article] [PubMed] [Google Scholar]
- 63.Whitwell JL, Weigand SD, Boeve BF, et al. Neuroimaging signatures of frontotemporal dementia genetics: C9ORF72, tau, progranulin and sporadics. Brain 2012;135(Pt 3):794–806 [DOI] [PMC free article] [PubMed] [Google Scholar]
- 64.Westman E, Cavallin L, Muehlboeck JS, et al. Sensitivity and specificity of medial temporal lobe visual ratings and multivariate regional MRI classification in Alzheimer's disease. PLoS One 2011;6:e22506. [DOI] [PMC free article] [PubMed] [Google Scholar]
- 65.Burton EJ, Barber R, Mukaetova-Ladinska EB, et al. Medial temporal lobe atrophy on MRI differentiates Alzheimer's disease from dementia with Lewy bodies and vascular cognitive impairment: a prospective study with pathological verification of diagnosis. Brain 2009;132(Pt 1):195–203 [DOI] [PubMed] [Google Scholar]
- 66.McKeith IG, Dickson DW, Lowe J, et al. Diagnosis and management of dementia with Lewy bodies: third report of the DLB Consortium. Neurology 2005;65:1863–72 [DOI] [PubMed] [Google Scholar]
- 67.Ince P, Irving D, MacArthur F, et al. Quantitative neuropathological study of Alzheimer-type pathology in the hippocampus: comparison of senile dementia of Alzheimer type, senile dementia of Lewy body type, Parkinson's disease and non-demented elderly control patients. J Neurol Sci 1991;106:142–52 [DOI] [PubMed] [Google Scholar]
- 68.Walker Z, Jaros E, Walker RWH, et al. Dementia with Lewy bodies: a comparison of clinical diagnosis, FP-CIT single photon emission computed tomography imaging and autopsy. J Neurol Neurosurg Psychiatry 2007;78:1176–81 [DOI] [PMC free article] [PubMed] [Google Scholar]
- 69.Rohrer JD, Warren JD. Phenotypic signatures of genetic frontotemporal dementia. Curr Opin Neurol 2011;24:542–9 [DOI] [PubMed] [Google Scholar]
- 70.Schrag A, Good CD, Miszkiel K, et al. Differentiation of atypical parkinsonian syndromes with routine MRI. Neurology 2000;54:697–702 [DOI] [PubMed] [Google Scholar]
- 71.Hampel H, Bürger K, Teipel SJ, et al. Core candidate neurochemical and imaging biomarkers of Alzheimer's disease. Alzheimers Dement 2008;4:38–48 [DOI] [PubMed] [Google Scholar]
- 72.Hampel H, Frank R, Broich K, et al. Biomarkers for Alzheimer's disease: academic, industry and regulatory perspectives. Nat Rev Drug Discov 2010;9:560–74 [DOI] [PubMed] [Google Scholar]
- 73.Giorgio A, De Stefano N. Clinical use of brain volumetry. J Magn Reson Imaging 2013;37:1–14 [DOI] [PubMed] [Google Scholar]