Abstract
♦ Background: Hyponatremia in peritoneal dialysis (PD) patients has previously been associated with water overload and weight gain, or with malnutrition and intracellular potassium depletion. Although there is a sizable literature about transmembrane sodium and water removal in PD, there are few reports about the incidence and characteristics of hyponatremia in the clinical setting.
♦ Aim: We evaluated the incidence and factors associated with hyponatremia in PD patients in a single PD unit.
♦ Methods: We retrospectively evaluated the records of all patients (n = 198) who were treated with PD in the Home PD Unit of the University Health Network at Toronto General Hospital during 2010. We identified 166 patients who had a minimum follow-up of 60 days during 2010 and at least 2 consecutive sodium measurements at least a month apart. We examined baseline differences between patients who developed hyponatremia and those who did not, and clinical and biochemical factors that correlated with mean sodium values. In the 24 patients who developed hyponatremia, we examined paired differences between the normonatremic and hyponatremic periods. Finally, we investigated any possible correlations of change in serum sodium with clinical and biochemical characteristics before and during the hyponatremic period.
♦ Results: The incidence of hyponatremia was 14.5%. In multivariate analysis, serum sodium correlated significantly and independently with residual renal function (RRF: r = 0.463, p = 0.0001) and negatively with the daily volume of instilled icodextrin (r = -0.476, p = 0.0001). Residual renal function was significantly lower in patients with hyponatremia than in those with normal serum sodium (1.97 ± 2.3 mL/min vs 4.31 ± 5.01 mL/min, p = 0.033). The mean paired difference in body weight was -1.113 kg and the median difference was -0.55 kg (range: -8.5 kg to +4.2 kg). Impressively, hyponatremia was not associated with an increase in body weight in most patients who developed this complication (13 of 16 for whom comparative weights were known). Moreover, the mean paired change in serum sodium (ΔNa) from normonatremia to hyponatremia was, contrary to our expectations, significantly correlated with a decrease in body weight (r = 0.584, p = 0.017). The ΔNa was also significantly correlated with serum potassium (r = 0.526, p = 0.008), the greatest drop in serum sodium being associated with lower serum potassium in the hyponatremic period, as predicted.
♦ Conclusions: Hyponatremia is seen more often than expected in a clinical setting. Serum sodium is strongly correlated with RRF, hyponatremia being associated with lower RRF. In patients who experienced hyponatremia, the fall in serum sodium was associated with a decrease, not an increase, in body weight and was correlated with serum potassium, suggesting that sodium and potassium depletion—and, by inference, malnutrition—may be important contributors in the clinical setting.
Key words: Hyponatremia, epidemiology
Despite extensive research and modeling of sodium and water flux across the peritoneal membrane, few studies have examined the factors possibly associated with the presence of hyponatremia in peritoneal dialysis (PD) patients. In the first study (1), published more than a decade ago, the incidence of hyponatremia (defined as ≤130 mmol/L on 2 occasions) was low (11 of 210 patients, 5.2%) and most cases were attributed to net water overload, because they were associated with an increase in body weight. In the few remaining reports, hypokalemia and malnutrition resulting in the loss of intracellular solutes (mainly potassium organic phosphate salts in RNA) were suggested as the principal reasons for the hyponatremia. In the setting of malnutrition, intracellular potassium and solute depletion leads to a compensatory shift of sodium from the extracellular to intracellular compartment, resulting in hypo-osmotic hyponatremia (1,2).
Hyponatremia in overhydrated PD patients has been associated with at least two different mechanisms:
excessive water intake, resulting in an absolute water overload; or
notwithstanding the contribution of ultrafiltration by aquaporins, the inability of intensified dialysis to remove sodium-free water from overhydrated hyponatremic patients without also removing large amounts of sodium (3).
Both of the foregoing mechanisms refer to overhydrated patients with excess water and not with absolute sodium depletion.
Shifts of water and sodium between the extracellular and intracellular compartments are a third possible mechanism that can account for hyponatremia in PD patients, regardless of total body water status. The use of icodextrin is an example of that mechanism. It is linked to hyponatremia through a rise in the osmotic pressure of the extracellular fluid (ECF) because of the presence of glucose polymers or their degradation products, maltotriose and maltotetraose (4). This hyponatremia is not factitious (4), and it is attributed to a shift of water from the intracellular fluid (ICF) to the ECF in a mechanism similar to that well described with hyperglycemia and mannitol administration. However, the former mechanism has been estimated to account for a mean fall of only approximately 3 mmol/L in serum sodium (5). Given the understanding that levels of osmotically-active icodextrin byproducts reach a plateau and remain stable thereafter, this mechanism would not, on its own, be enough to account for the presence of severe hyponatremia. It therefore cannot explain the presence of severe hyponatremia associated with the use of icodextrin that has been reported by some authors in diabetic patients (6).
Another possible mechanism of hyponatremia in PD that is difficult to evaluate is negative sodium (and potassium) balance (7). Several papers have addressed a quantitative evaluation of sodium removal in PD patients (8-11). There has been wide agreement that it is closely related to ultrafiltration and that it is greater with the use of continuous ambulatory than with automated PD and with the use of icodextrin (9,11). In both instances, compared with rapid-cycling automated PD, ultrafiltration occurs proportionately more through the small pores (where water is removed along with sodium), rather than through aquaporins. Another common finding is variation in the amount of total sodium removal that is achieved, with a considerable number of patients achieving a daily sodium removal of more than 140 mmol (8-10). There may be patients in whom total sodium removal—through PD and residual renal function (RRF)—can be greater than their average sodium intake (especially those who are older and malnourished).
Another theoretical cause of hyponatremia is a change in the set point for serum sodium or plasma tonicity. Although this change should not be significantly mediated by vasopressin-associated water reabsorption (given the very low glomerular filtration rate in dialysis patients), it is conceivable that water intake might be regulated toward a lower serum sodium concentration in some patients.
Recent data suggest that hyponatremia may be associated with mortality in hemodialysis (12), but no studies have evaluated serum sodium as an outcome predictor in PD.
The present study aimed to evaluate the epidemiology of hyponatremia in PD patients in a single large university PD unit and to identify the patient-related or PD-related parameters associated with its development.
Methods
We reviewed the records of all 198 patients treated using PD in a single center (Home Peritoneal Dialysis Unit, University Health Network, Toronto General Hospital) during 2010 (1 January 2010 to 31 December 2010). We excluded patients with a follow-up of less than 2 months or insufficient serum sodium data. We analyzed only incident hyponatremia (patients who were initially normonatremic and who became hyponatremic during follow-up).
Hyponatremia was defined as a serum sodium concentration of 130 mmol/L or less on 2 consecutive measurements at least 1 month apart. Low serum sodium values recorded during hospitalizations for illness not causally related to hyponatremia (that is, hyponatremia secondary to other disease or iatrogenic) or serum sodium associated with significant glycemia (>7.5 mmol/L) or lipemia were not included.
Correlation analysis was applied to the mean of serum sodium measurements for each patient over the follow-up period in 2010. For bivariate correlation analysis, the mean sodium concentration before the patient developed hyponatremia was used. That value was examined for correlations with the means of concurrent measurements of other biochemical and clinical parameters. The parameters examined for potential correlation with mean serum sodium included demographic and epidemiologic data, PD modality and prescription, dialysis vintage, RRF, residual renal (urine) volume (RRV), systolic and diastolic blood pressure, hematocrit, sodium, potassium, bicarbonate, calcium, phosphate, albumin, urea, creatinine, triglycerides, types of antihypertensive drugs, and use and dose of furosemide. Unfortunately, urine sodium concentrations were not routinely measured. Correlations between mean serum sodium and other continuous variables were tested by bivariate correlation analysis using either the Pearson product-moment correlation coefficient or the Spearman rank-order correlation, depending on the normality of the distribution of the examined variables.
Patients were classified into one of two groups depending on whether they developed hyponatremia during 2010. Differences in continuous variables between the groups were evaluated using an independent samples t-test or the Mann-Whitney test, as appropriate, after the normality of the data distribution in each group had been tested. Differences between nominal variables were evaluated using the chi-square test.
Among the patients who developed hyponatremia, data from the normonatremic period (before the development of hyponatremia) were compared with those from the hyponatremic period. This comparison aimed to define clinical, biochemical, and PD prescription-related changes that were associated with the development of hyponatremia. The parameters examined included body weight, change in body weight between the two periods, arterial blood pressure, modality and dose of PD, daily amount of 2.5% dextrose or icodextrin solution (4.25% solution is avoided in our program), daily ultrafiltration, RRF and RRV, hematocrit, albumin, serum electrolytes, phosphate, urea, and creatinine. Differences between the periods were evaluated using the paired-samples t-test or Wilcoxon signed-rank test, according to the normality of the distribution of the data (as checked by the Kolmogorov-Smirnov test).
Finally, we also used bivariate correlation analysis as described earlier to check for potential significant correlates of the incremental change from normo- to hyponatremia (ΔNa) and for correlates of serum sodium in the hyponatremic period.
We measured RRF as the mean of urea and creatinine clearances in a 24-hour urine collection. Body weight was measured in the clinic by a dedicated PD nurse, and it reflects the patient’s “dry” weight (without any PD fluid).
Statistical analyses were performed using the SPSS software application (version 13.0: SPSS, Chicago, IL, USA) for Windows (Microsoft Corporation, Redmond, WA, USA).
Results
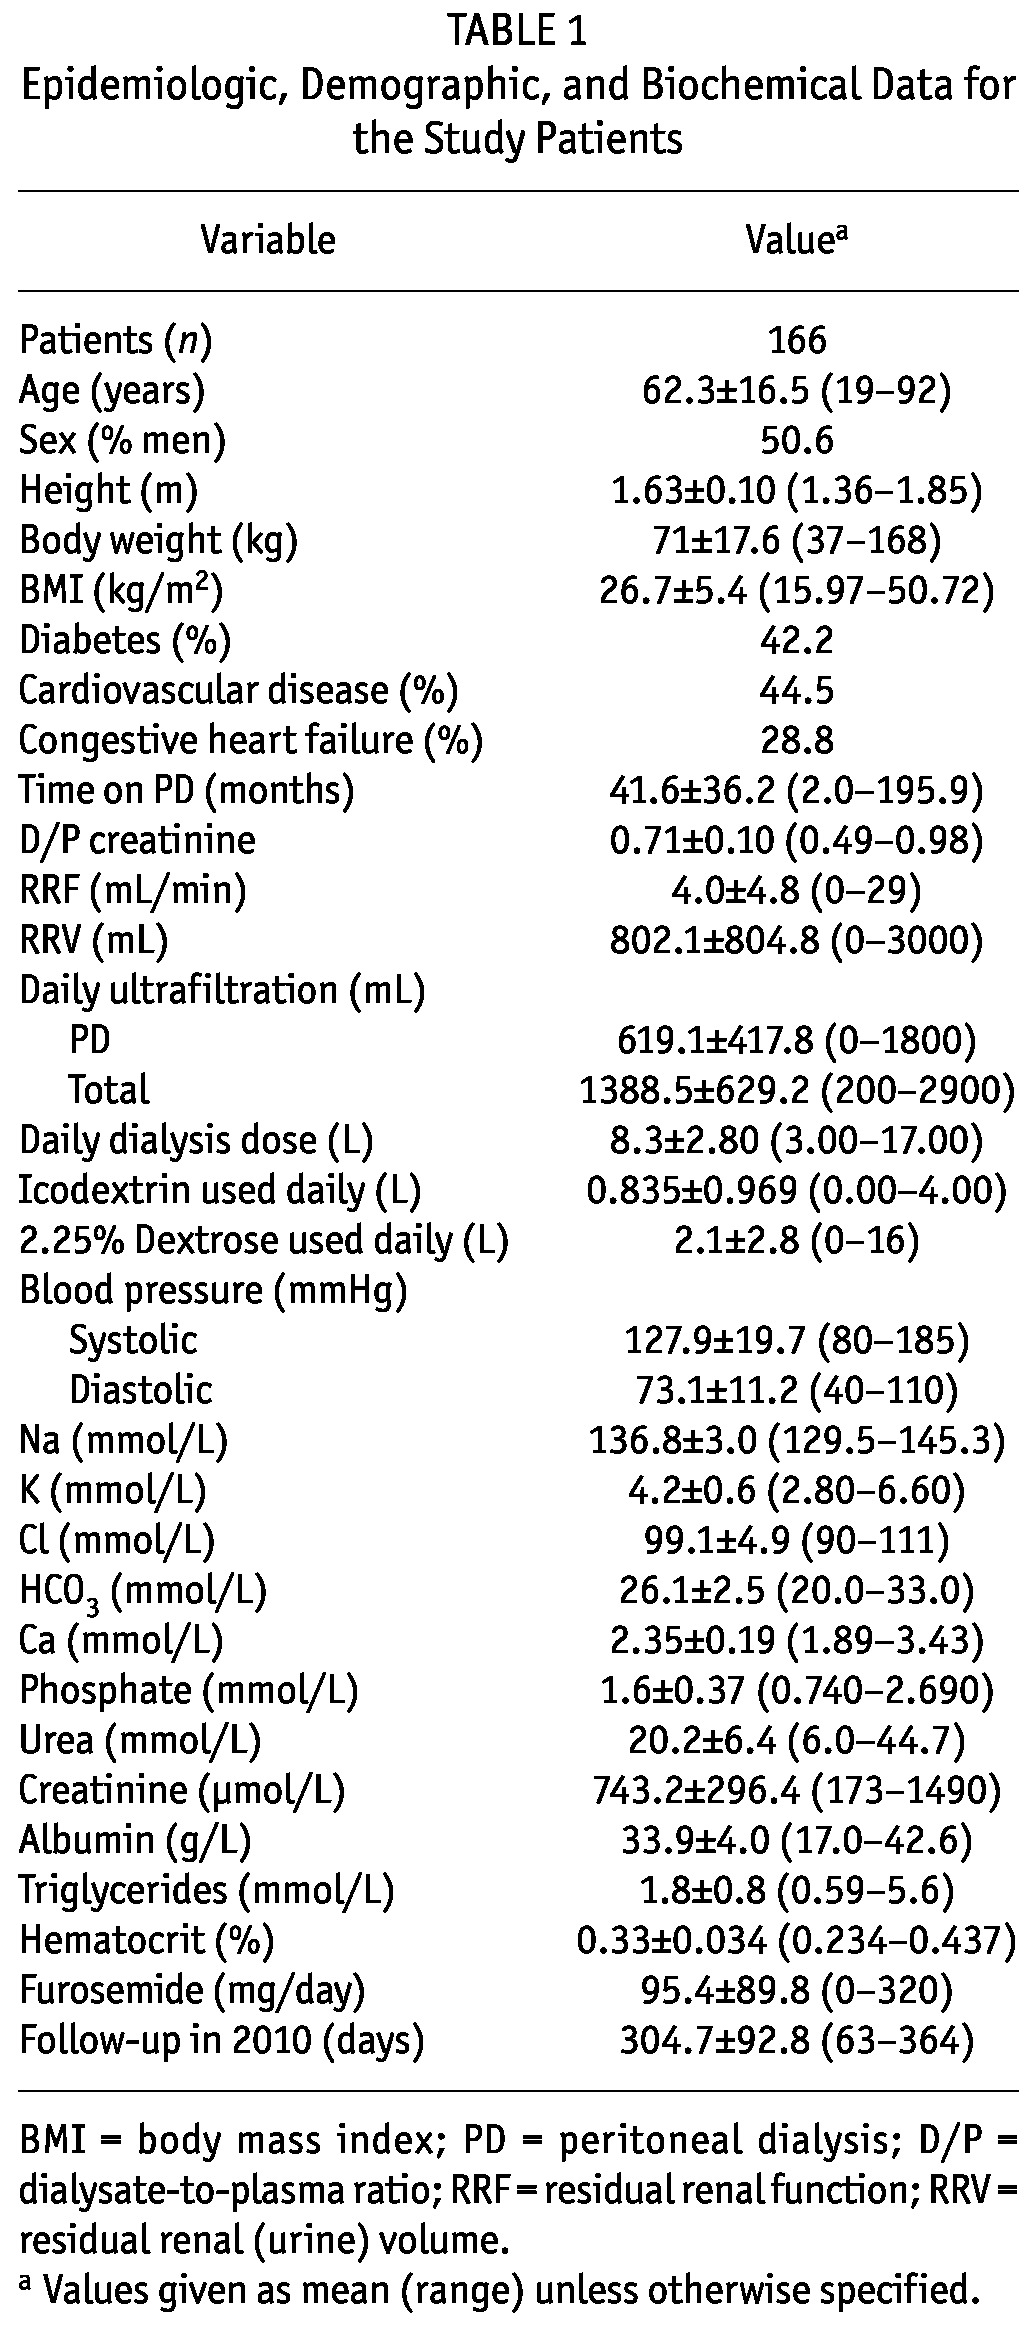
After excluding patients with less than 2 months of follow-up during 2010 or with fewer than 2 valid sodium measurements within 2010, 166 patients were eligible for further evaluation. Table 1 presents demographics and baseline biochemistry for the whole group. Within that group, 24 patients (14.5%) presented with hyponatremia during a mean follow-up period of 304.7 days (median: 364 days; range: 63 - 364 days).
TABLE 1.
Epidemiologic, Demographic, and Biochemical Data for the Study Patients
Non-Hyponatremic vs Hyponatremic Patients
Table 2 presents epidemiologic and biochemical data (“baseline” mean values in the months preceding the development of hyponatremia) for the patients who eventually developed hyponatremia compared with those who did not. As shown in the table, patients who developed hyponatremia did not differ significantly in age, sex, height, or body mass index from those who did not. The patients who developed hyponatremia tended to have a higher incidence of diabetes and a history of cardiovascular disease (coronary artery disease, cerebrovascular disease, or peripheral vascular disease) and congestive heart failure, although the differences did not reach statistical significance. The absence of hyponatremia was significantly associated with higher RRF (4.31 ± 5.01 mL/min vs 1.97 ± 2.3 mL/min, p = 0.033) and higher daily RRV (848.3 ± 817.8 mL vs 536.38 ± 680.7 mL, p = 0.057) and with daily total (peritoneal + RRV) ultrafiltration (1433.1 ± 637.9 mL vs 1057.5 ± 456.4 mL, p = 0.052). The groups did not differ significantly in the amount of dialysate used daily or in the volume of 2.5% dextrose dialysis solution and icodextrin used daily. However, the percentage of patients who used icodextrin was higher in the group with hyponatremia. The patients who developed hyponatremia also had significantly lower baseline serum sodium (133.82 ± 2.53 mmol/L vs 137.29 ± 2.78 mmol/L, p = 0.0001, Figure 1) and chloride, and higher serum potassium.
TABLE 2.
Comparison of Study Patients With and Without Hyponatremia During 2010
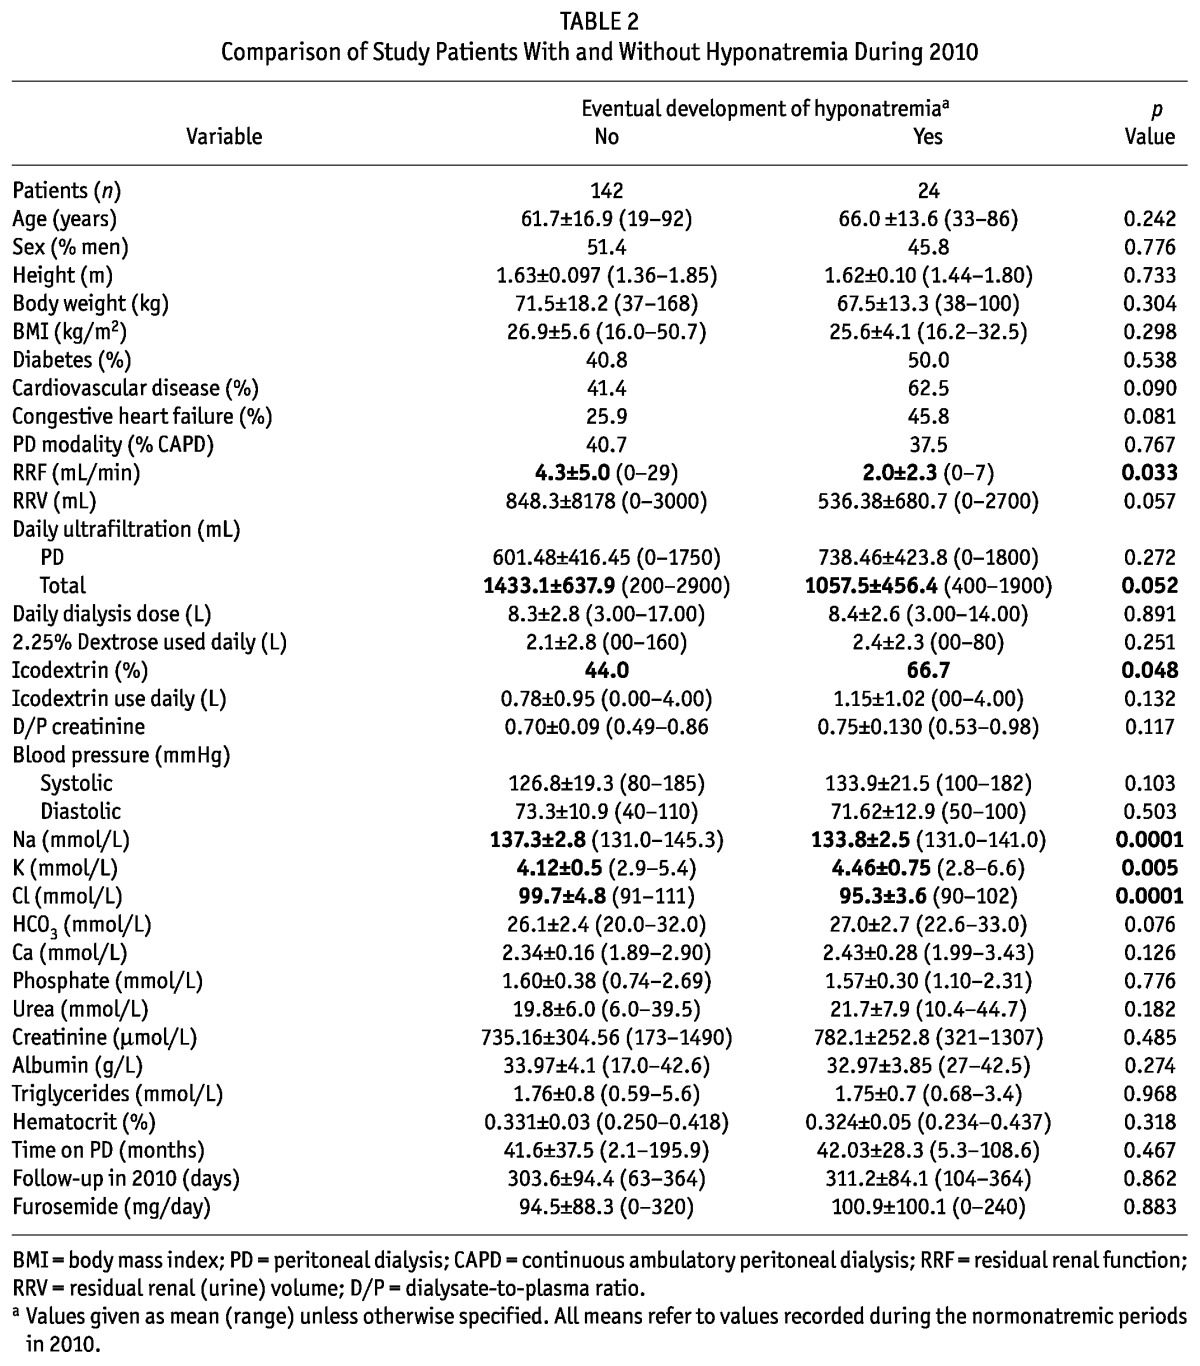
Figure 1 —
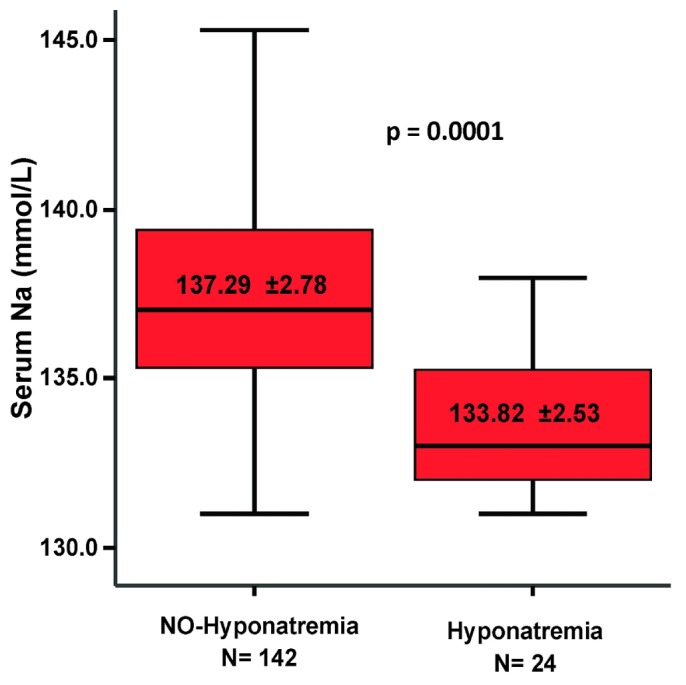
Difference in mean baseline serum sodium for patients who did and did not experience hyponatremia during 2010. The patients that eventually developed hyponatremia had a lower mean serum sodium at baseline. The whiskers in the plot represent the 95% confidence interval.
We observed no association between the types of antihypertensive agents used and the development of hyponatremia.
Parameters Correlated with Baseline Mean Serum Sodium
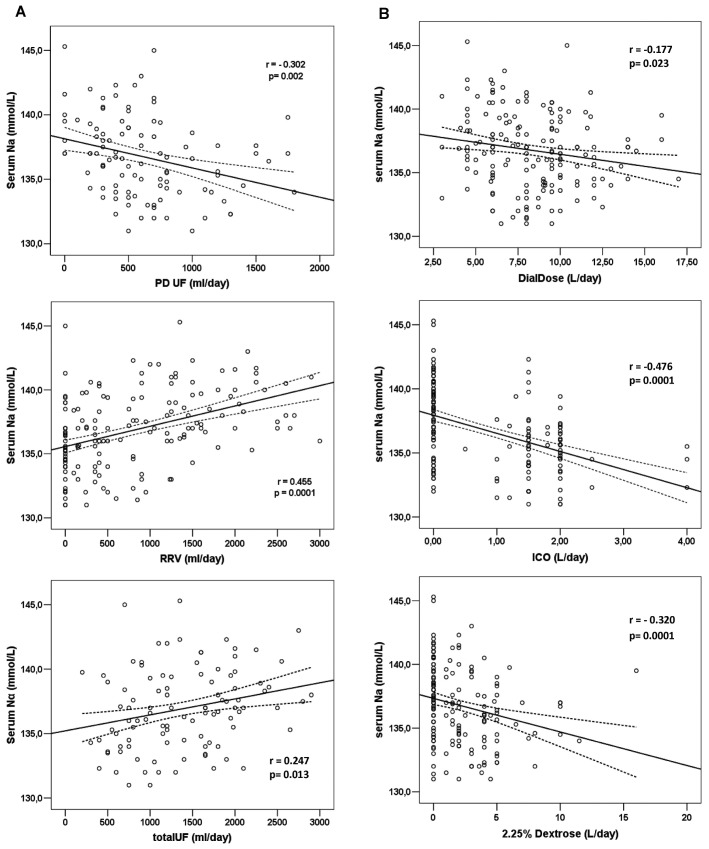
Table 3 shows correlations with mean serum sodium for the variables examined in the overall cohort (166 patients). As already mentioned, serum sodium was significantly correlated with RRF (r = 0.463, p = 0.0001, Figure 2). Patients with a lower residual glomerular filtration rate tended to be more hyponatremic. This case also held true for the RRV (r = 0.455, p = 0.0001) and for the total daily ultrafiltration volume (r = 0.247, p = 0.013). In contrast, when examined as continuous variables, mean daily PD ultrafiltration (r = -0.302, p = 0.002) and the amounts of dialysate (r = -0.177, p = 0.023), icodextrin (r = -0.476, p = 0.0001), and 2.5% dextrose dialysate (r = -0.320, p = 0.0001) used daily were all found to be significantly negatively (inversely) correlated serum sodium (Figure 3). Put another way, higher volumes of PD ultrafiltration and the use of more 2.5% dialysate or larger volumes of icodextrin were associated with lower serum sodium.
TABLE 3.
Bivariate Correlations of Serum Sodium with Relevant Parameters in the Study Patients
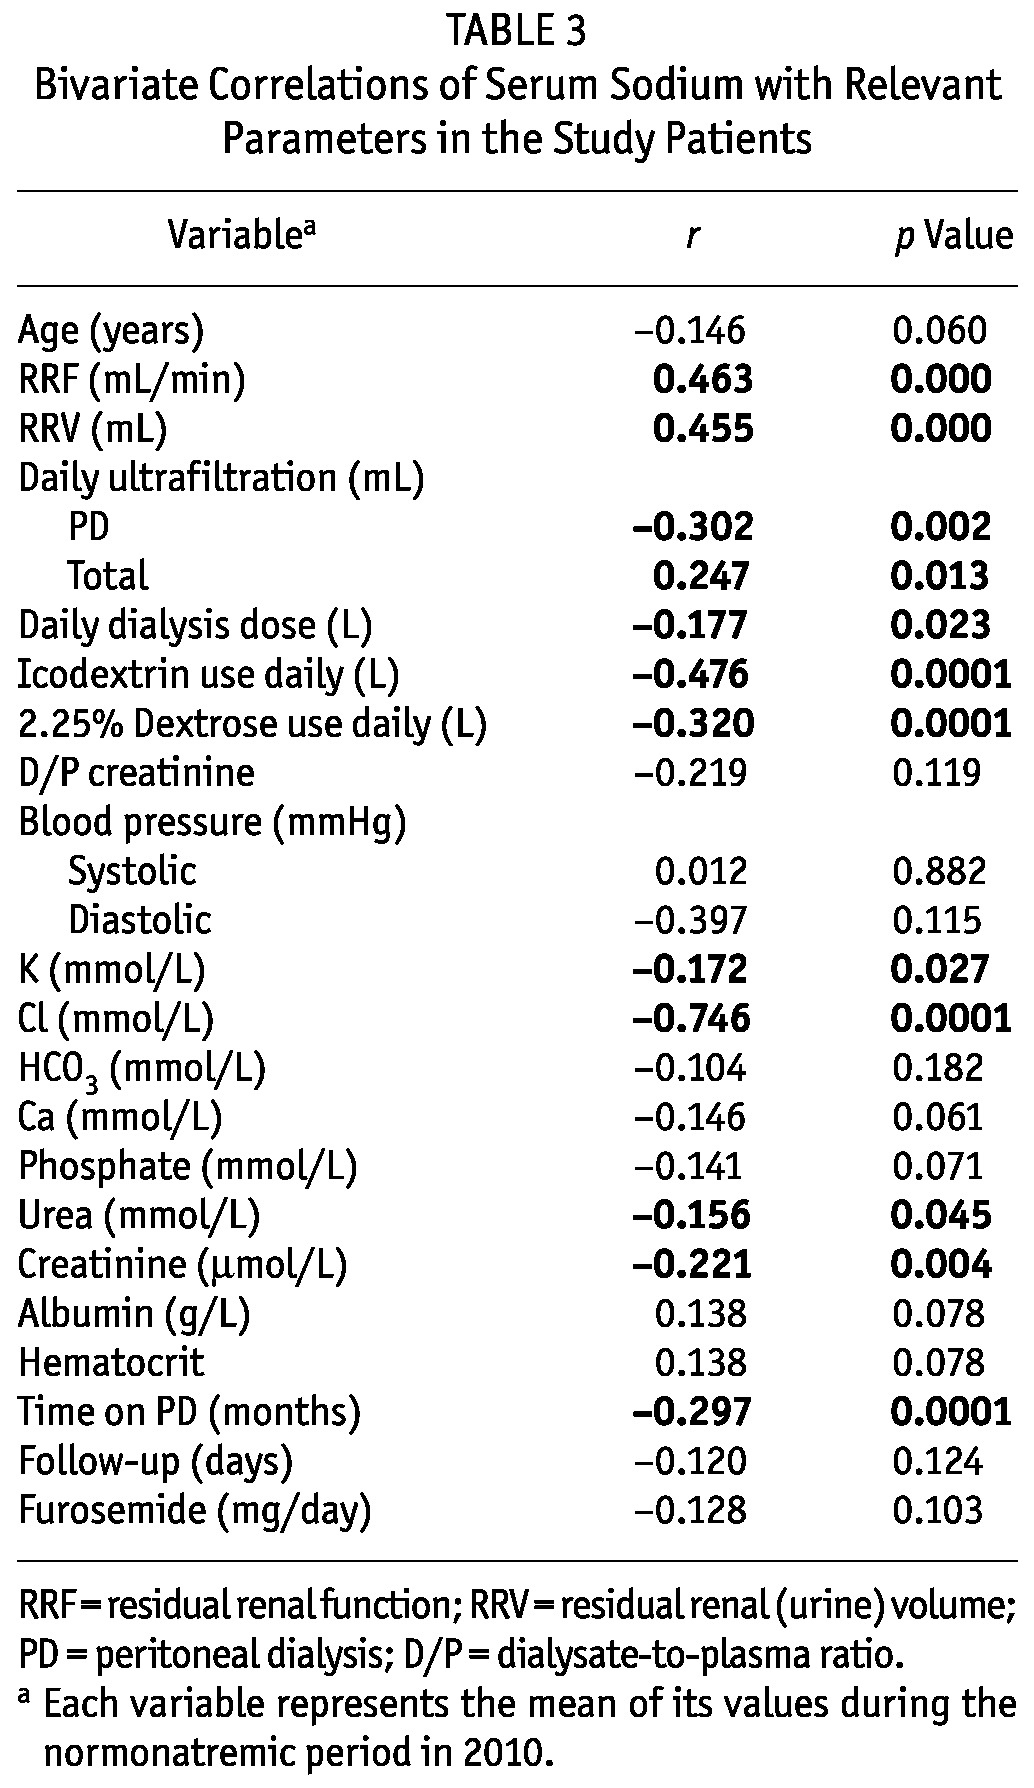
Figure 2 —
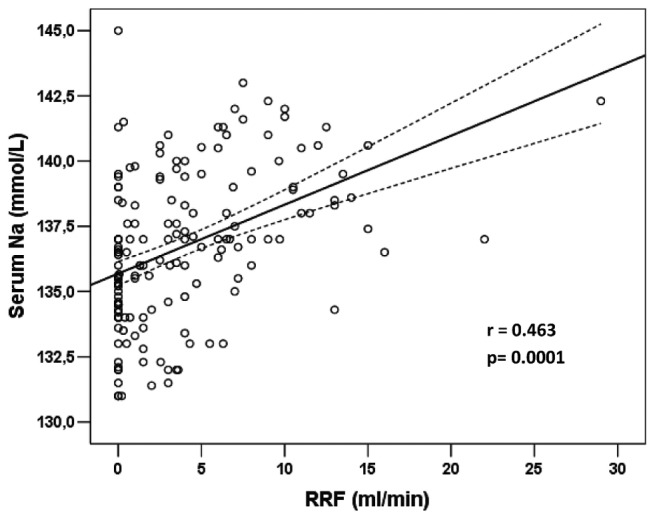
Correlation of serum sodium with residual renal function (RRF) in the 166 patients eligible for analysis. The plotted values represent mean serum sodium in non-hyponatremic periods during 2010.
Figure 3 —
(A) Correlations between serum sodium and volume control through daily peritoneal dialysis (PD) ultrafiltration (UF), residual renal urine volume (RRV), and a combination (totalUF). (B) Correlations between serum sodium and prescribed daily PD dose (DialDose) and volume (in liters) of icodextrin (ICO) and 2.25% dextrose used daily. The analysis refers to the baseline values for all 166 study patients.
Other variables that were significantly negatively correlated with serum sodium included mean serum urea (r = -0.156, p = 0.045), creatinine (r = -0.221, p = 0.004), and potassium (r = -0.172, p = 0.027). On the other hand, serum chloride was, as expected, strongly positively correlated with serum sodium (r = 0.746, p = 0.0001).
Time on PD (r = -0.297, p = 0.0001) was also significantly negatively correlated with serum sodium. This association probably reflects colinearity with RRF, because time on PD was also very strongly negatively correlated with RRF (r = -0.577, p = 0.0001).
In a stepwise multivariable regression model that included RRF, RRV, PD ultrafiltration, total ultrafiltration, total dialysate used daily, daily icodextrin volume, and serum creatinine, albumin, potassium, and phosphate, only the daily icodextrin volume and RRF remained as independent correlates of serum sodium in the final model (adjusted R2 = 0.284, p = 0.001).
Paired Differences Between the Normonatremic and Hyponatremic Periods
Table 4 shows the paired differences between the precedent normonatremic period and the hyponatremic period in the 24 patients who eventually developed hyponatremia. Also in this subgroup, apart from mean serum sodium (Figure 4), hyponatremia was associated with significantly lower serum chloride (p = 0.0001) and bicarbonate (p = 0.04) and a small but significant decrease in RRF (p = 0.008).
TABLE 4.
Paired Differences Between the Normonatremic and Hyponatremic Periods of the 24 Patients that Presented with Hyponatremia During 2010
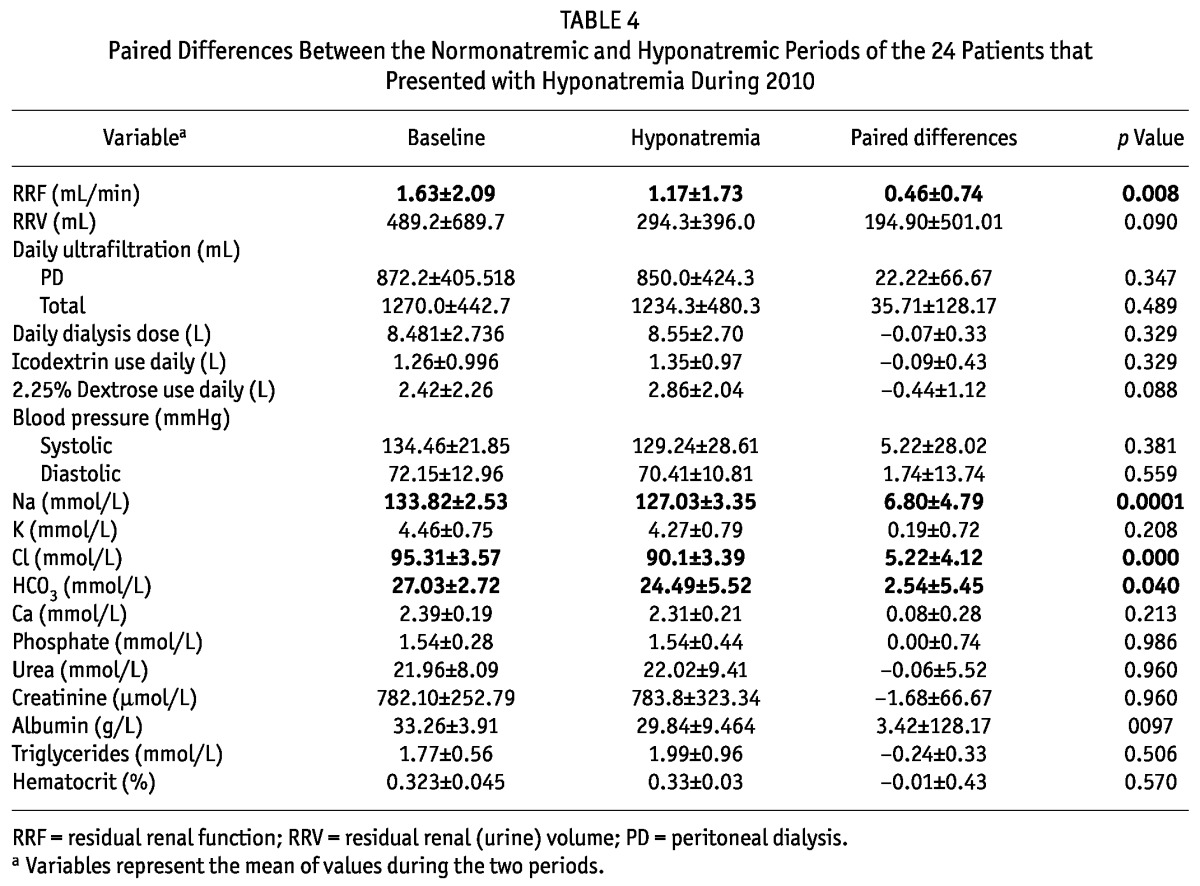
Figure 4 —
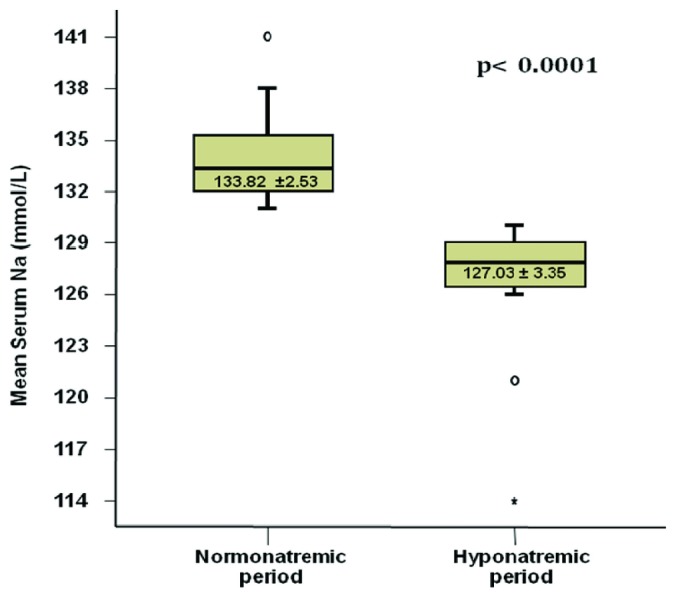
Box plot presenting the difference in mean serum sodium between the baseline “normonatremic” period and the subsequent hyponatremic period for the 24 patients who experienced hyponatremia. The whiskers in the plot represent the 95% confidence interval.
Data about weight change between the normo- and hyponatremic periods were available for 16 patients. The mean paired difference in body weight was -1.113 kg and the median was -0.55 kg (range: -8.5 kg to +4.2 kg). As shown in Figure 5(A), hyponatremia was not associated with an increase in body weight in most of the patients.
Figure 5 —
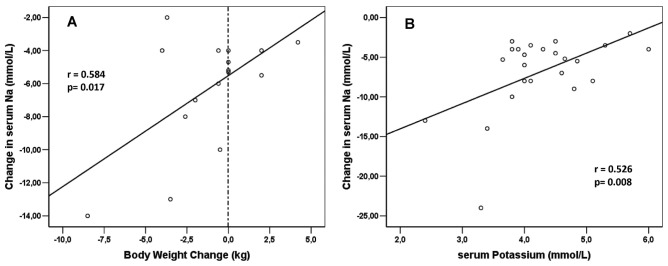
(A) Correlation of change in serum sodium with change in body weight from the normonatremic to the hyponatremic period for 16 patients with records of body weight in both periods among the 24 patients who experienced hyponatremia. (B) Correlation of change in serum sodium with change in serum potassium in the hyponatremic period for 24 patients who developed hyponatremia.
We observed no association between the types of antihypertensive agents used and the development of hyponatremia in patients who became hyponatremic.
There was no significant difference in the percentage of patients using icodextrin or the amount of icodextrin used by the patients between the normonatremic and hyponatremic periods. Indeed, 18 of the 24 patients were already on icodextrin, and only 1 patient was newly introduced to icodextrin between the normo- and hyponatremic periods.
Correlates of ΔNa from the Normo- to the Hyponatremic Period
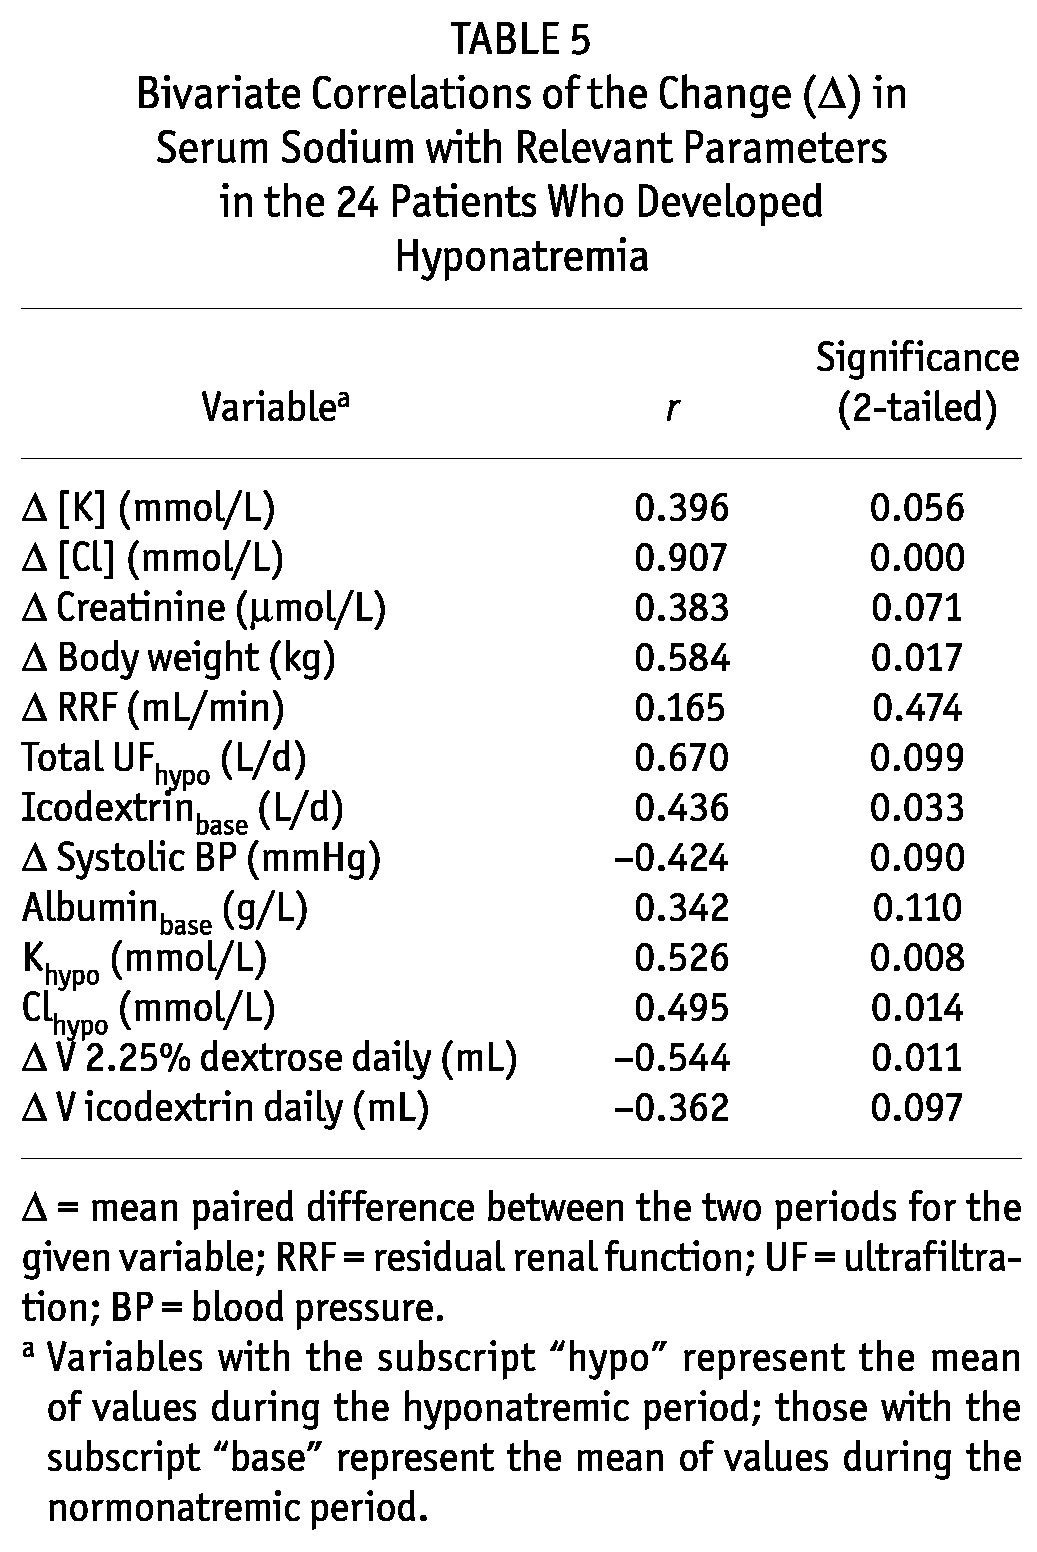
The mean paired ΔNa from normo- to hyponatremia was significantly correlated with change in serum chloride (r = 0.907, p = 0.0001, Table 5). It was also significantly correlated with change in body weight between the two periods (r = 0.584, p = 0.017) and with serum potassium in the hyponatremic period [r = 0.526, p = 0.008, Figure 5(A,B)]. Change in the daily volume of 2.5% dialysate also correlated significantly with ΔNa: that is, the use of higher volumes of more hypertonic dialysis solution was associated with a more profound drop in serum sodium.
TABLE 5.
Bivariate Correlations of the Change (Δ) in Serum Sodium with Relevant Parameters in the 24 Patients Who Developed Hyponatremia
Correlates of Serum Sodium During Hyponatremia
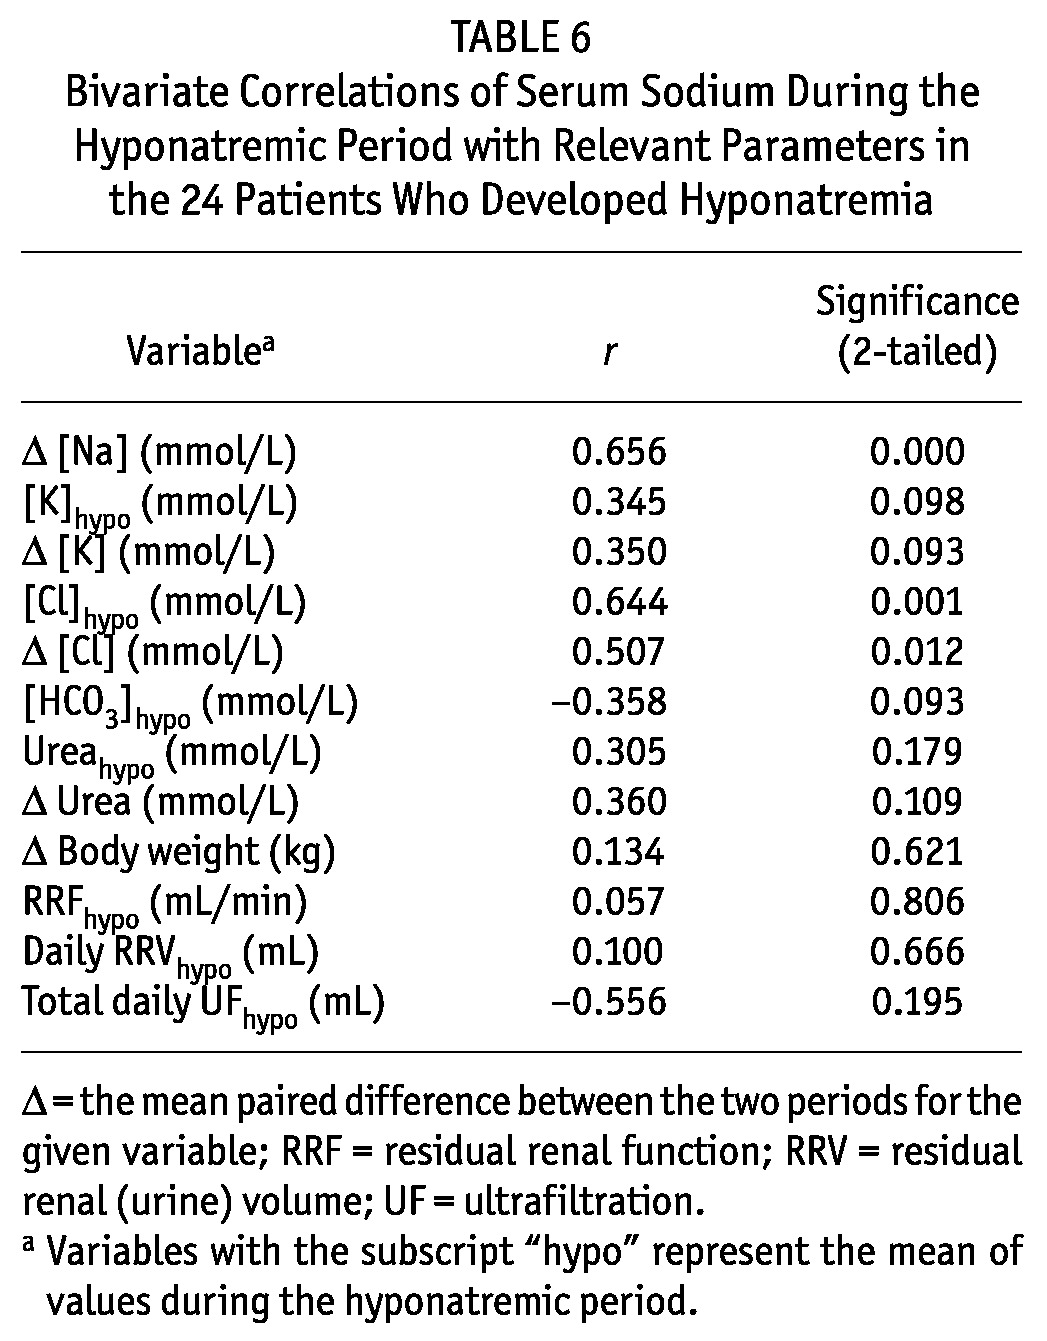
As expected, serum sodium during hyponatremia correlated significantly with the ΔNa and the change in serum chloride from baseline to hyponatremia (Table 6). We also observed a trend (p = 0.098) toward a positive correlation with serum potassium in the hyponatremic period (lower serum potassium was associated with lower serum sodium), but no other significant correlation was observed.
TABLE 6.
Bivariate Correlations of Serum Sodium During the Hyponatremic Period with Relevant Parameters in the 24 Patients Who Developed Hyponatremia
Discussion
Sodium sieving, resulting from the induction of aquaporins by the hyperosmotic stimulus of dextrose-based PD solutions, is the reason for the relative inefficacy of PD in removing sodium without removing an additional, excess, quantity of free water. This proportionally greater removal of water than sodium should, in theory, lead to hypernatremia rather than hyponatremia. However, hypernatremia is rarely seen in clinical practice, thirst being a potent stimulus for water consumption and restoration of normonatremia. However, clear-cut hyponatremia (≤130 mmol/L) would not be expected to be common in this population.
Hyponatremia was more common than we expected, affecting almost 15% of the patients being treated with PD in our study. But what was more striking was that, in most patients, hyponatremia was not associated with an increase in body weight that could have been easily attributed to water intake in excess of sodium intake. In fact, in 13 of the 16 patients for whom weight records were available in both periods, hyponatremia was not associated with an increase in body weight, and a loss of body weight was—impressively—significantly correlated with lower serum sodium [Figure 5(A)]. The more weight lost, the lower the serum sodium. Despite the drop in body weight, some of these patients might still have been relatively water overloaded if the weight loss had been a result of malnutrition and loss of fat and muscle mass. That possibility could be more properly addressed in future studies by using more sophisticated bioimpedance methods to examine hydration status in addition to the relative change in ICF and ECF volume (10).
An expected finding, and yet one never actually shown in the past, was the strong and significant correlation between RRF and serum sodium. When examining baseline data for the overall cohort, a lower glomerular filtration rate was associated with lower serum sodium (Figure 2). Moreover, compared with patients who did not develop hyponatremia, those who did develop the condition had a significantly lower mean baseline RRF (Table 3). Furthermore, significant loss of RRF was a hallmark of the transition from normonatremic to hyponatremic (Table 4). In the same respect, RRV was also significantly correlated with serum sodium. Insofar as sodium concentration in urine is usually less than that in plasma, RRV may defend against hyponatremia by excreting relatively more water than sodium. Alternatively, preserved RRF could be a marker of, or be directly associated with, better nutrition status.
Other significant but inverse correlates of serum sodium included liters of dialysate used daily, mean daily PD ultrafiltrate, and the amounts of 2.5% dextrose and icodextrin used daily. However, in the multivariable analysis, only volume of icodextrin used daily (inverse correlation) and RRF (positive correlation) proved to be significant independent predictors of serum sodium. Thus, it is likely that the variables showing univariate correlations were confounders of the presence (RRV) or absence (PD dose and ultrafiltration) of RRF.
Icodextrin use can be associated with hyponatremia in two different ways. The first is the well-described accumulation of osmotically active metabolic byproducts in the ECF, and the consequent shifting of water from the ICF. The second mechanism could be the removal of larger amounts of sodium through icodextrin-mediated ultrafiltration, which is based on colloid osmosis (9,11). The ultrafiltration generated by icodextrin is mediated through the small pores and not through aquaporins (the latter are induced by the hyperosmolality of dextrose-based PD solutions, with a resulting transcellular movement of sodium-free water). The foregoing theory is consonant with our finding that most patients with hyponatremia showed an associated weight (or sodium?) loss and not weight (or water?) gain.
In the patients who developed hyponatremia, the decrease in serum sodium was also significantly correlated with lower serum potassium in the hyponatremic period [Figure 5(B)]. The (well described) theoretical associations of low serum sodium with low serum potassium (1,2,7) seem to be confirmed in our hyponatremic patients. To our knowledge, this theoretical association has never been confirmed by clinical data in a large PD patient cohort—until now.
Low serum potassium can, in certain patients, be attributed to malnutrition, and potassium losses from the intracellular space can lead to sodium movement into cells and consequent hyponatremia without significant water overload (1,2). Among the weaknesses of our study, no formal surrogate marker of nutrition was evaluated. Approximate markers of nutrition (such as serum creatinine, urea, and phosphorus) did not significantly correlate with serum sodium or with ΔNa.
Being observational, based on a review of patient charts, our study has limitations. We lacked information about the amount of sodium removed by PD and RRF and about the amount being ingested in the diet. Several studies have demonstrated that the amount of sodium removed by PD can vary significantly, reaching high values in certain patients. In a survival study examining the impact of sodium removal on mortality, Ates et al. (8) also found that 50% of their 125 patients achieved a total sodium removal of 180 mmol or more daily; it should be mentioned, though, that their patient population had high daily ultrafiltration volumes. Rodriguez-Carmona and Fontán (9) also reported sodium removal to be as high as 200 mmol daily in PD patients. In fact, more than 97.8% of patients on continuous ambulatory PD with an ultrafiltration volume greater than 1 L daily managed to remove more than 100 mmol sodium daily in effluent. An interesting observation is that peritoneal sodium removal ranged very widely, with the higher values reaching 450 mmol daily on continuous ambulatory PD and 396 mmol daily on automated PD (9). Ultrafiltration, RRF, PD modality (continuous ambulatory PD), and the use of icodextrin have been identified as factors associated with higher total sodium removal (9,11).
Further detailed studies to evaluate the incidence, the possible correlates, and the impact of serum sodium and PD modality on morbidity and patient survival will be useful. Studies that are attempting to associate serum sodium with sodium balance in PD patients should also include more precise (that is, bioimpedance-derived) estimates of hydration status and relative change in the ICF and ECF volumes.
Conclusions
In clinical practice, hyponatremia (≤130 mmol/L) was recorded in approximately 15% of patients in a single university PD program over 1 year of observation. Serum sodium was strongly and independently correlated positively with RRF and inversely with the quantity of icodextrin solution used. Hyponatremia was associated with weight loss and not with weight gain, suggesting the possible contribution of malnutrition in the development of this condition. The ΔNa in patients who developed hyponatremia was significantly correlated with lower serum potassium, supporting the concept of intracellular potassium depletion generating a flux of sodium into cells.
Disclosures
JMB has received speaker fees from Amgen, Otsuka, Baxter Healthcare, and DaVita Healthcare Partners. The remaining authors have no financial conflicts of interest to disclose.
References
- 1. Zevallos G, Oreopoulos DG, Halperin ML. Hyponatremia in patients undergoing CAPD: role of water gain and/or malnutrition. Perit Dial Int 2001; 21:72–6 [PubMed] [Google Scholar]
- 2. Cherney DZ, Zevallos G, Oreopoulos D, Halperin ML. A physiological analysis of hyponatremia: implications for patients on peritoneal dialysis. Perit Dial Int 2001; 21:7–13 [PubMed] [Google Scholar]
- 3. Uribarri J, Prabhakar S, Kahn T. Hyponatremia in peritoneal dialysis patients. Clinical Nephrol 2004; 61:54–8 [DOI] [PubMed] [Google Scholar]
- 4. Posthuma N, ter Wee PM, Donker AJ, Oe PL, van Dorp W, Peers EM, et al. Serum disaccharides and osmolality in CCPD patients using icodextrin or glucose as daytime dwell. Perit Dial Int 1997; 17:602–7 [PubMed] [Google Scholar]
- 5. Gokal R, Moberly J, Lindholm B, Mujais S. Metabolic and laboratory effects of icodextrin. Kidney Int Suppl 2002; (81):S62–71 [DOI] [PubMed] [Google Scholar]
- 6. Gradden CW, Ahmad R, Bell GM. Peritoneal dialysis: new developments and new problems. Diabet Med 2001; 18:360–3 [DOI] [PubMed] [Google Scholar]
- 7. Zanger R. Hyponatremia and hypokalemia in patients on peritoneal dialysis. Semin Dial 2010; 23:575–80 [DOI] [PubMed] [Google Scholar]
- 8. Ateş K, Nergizoğlu G, Keven K, Sen A, Kutlay S, Ertürk S, et al. Effect of fluid and sodium removal on mortality in peritoneal dialysis patients. Kidney Int 2001; 60:767–76 [DOI] [PubMed] [Google Scholar]
- 9. Rodriguez-Carmona A, Fontán MP. Sodium removal in patients undergoing CAPD and automated peritoneal dialysis. Perit Dial Int 2002; 22:705–13 [PubMed] [Google Scholar]
- 10. Boudville NC, Cordy P, Millman K, Fairbairn L, Sharma A, Lindsay R, et al. Blood pressure, volume, and sodium control in an automated peritoneal dialysis population. Perit Dial Int 2007; 27:537–43 [PubMed] [Google Scholar]
- 11. Fourtounas C, Hardalias A, Dousdampanis P, Papachristopoulos B, Savidaki E, Vlachojannis JG. Sodium removal in peritoneal dialysis: the role of icodextrin and peritoneal dialysis modalities. Adv Perit Dial 2008; 24:27–31 [PubMed] [Google Scholar]
- 12. Waikar SS, Curhan GC, Brunelli SM. Mortality associated with low serum sodium concentration in maintenance hemodialysis. Am J Med 2011; 124:77–84 [DOI] [PMC free article] [PubMed] [Google Scholar]


