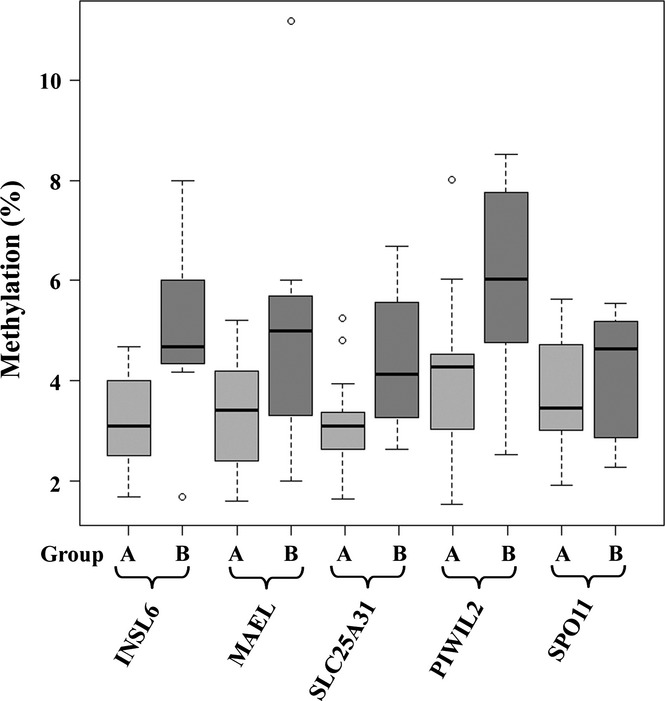
Figure 4.

Pyrosequencing results of candidate genes. The box plots show the distribution of INSL6, MAEL, SLC25A3, PIWIL2 and SPO11 methylation values in groups A and B. The bottom and the top of the boxes represent the 25th and 75th percentiles respectively. The median is represented by vertical lines. Bars extend from the boxes to at most 1.5 times the height of the box. Circles indicate outliers.
